
Table of Contents
XRP Price Prediction by Year
What is the XRP price prediction for the next 5 years?
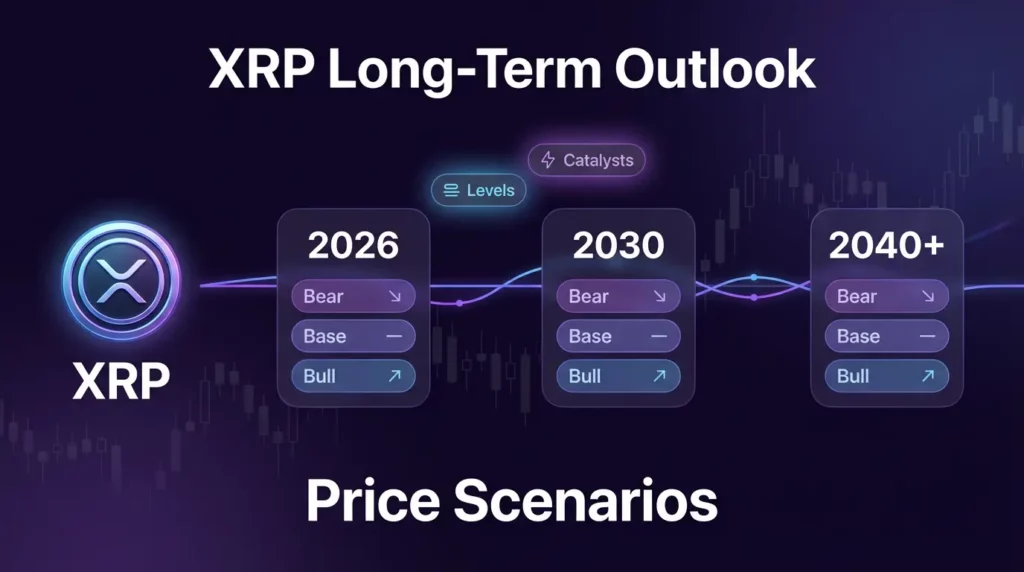
Year-by-year XRP forecasts work best as scenarios, not one number. This hub links to 2026–2030 outlooks with key assumptions, support/resistance zones, and catalysts so you can compare base, bull, and bear paths.
Year-by-year XRP price prediction forecasts organize price outlooks across multiple time horizons, from near-term (2026) to long-term (2030, 2035, and beyond). Unlike single-point predictions that offer one target, this hub presents scenario-based ranges for each year, identifying the key support and resistance levels, dominant catalysts, and market regime assumptions that determine whether a bull, base, or bear path becomes reality.
This page serves as the central navigation index for all year-specific XRP forecasts on VTrader.io. Use the quick links below to jump directly to a particular year’s detailed outlook, or read on to understand how year-by-year forecasts are constructed, what drivers change multi-year paths, and how to interpret scenario ranges across different time horizons.
Quick Navigation: Jump to Your Year
| Year | Forecast Type | Last Updated | Action |
| 2025 | Short-term scenarios | Q1 2026 | Read 2025 forecast |
| 2026 | Base, bull, bear paths | Q1 2026 | Read 2026 forecast |
| 2027 | Mid-term outlook | Q1 2026 | Read 2027 forecast |
| 2028 | Mid-term outlook | Q1 2026 | Read 2028 forecast |
| 2029 | Mid-term outlook | Q1 2026 | Read 2029 forecast |
| 2030 | Long-term scenarios | Q1 2026 | Read 2030 forecast |
| 2035 | Extended horizon | Q1 2026 | Read 2035 forecast |
| 2040+ | Speculative long-term | Q1 2026 | Read 2040+ forecast |
How to Use This Hub
- Choose a year from the table above based on your planning or investment horizon.
- Read the scenarios on that year’s dedicated page—each includes base, bull, and bear paths with specific price ranges.
- Note invalidation triggers—conditions that would move the forecast from one scenario to another.
- Check catalysts—the events, regulatory milestones, or market shifts that could accelerate or decelerate price movement.
- Refer to the Methodology hub to understand how scenario bands are constructed and how to interpret confidence levels.
This structured approach prevents confusion between single-number “predictions” and probabilistic scenario planning, helping you make better-informed decisions.
How Year-by-Year XRP Forecasts Work
Year-level XRP price forecasts are not single targets but scenario-driven outlooks that account for uncertainty, regime shifts, and evolving fundamentals. Understanding the mechanics behind these forecasts helps you interpret ranges, assign probability weights, and recognize when a forecast needs updating.
Why Scenarios Beat Single-Point Predictions
Single-point predictions (e.g., “XRP will be $5 in 2028”) fail to capture:
- Volatility and uncertainty: Cryptocurrency markets experience regime changes—bull markets, bear markets, consolidation periods—that make point estimates unreliable.
- Conditional outcomes: Price paths depend on catalysts (ETF approval, regulatory clarity, adoption milestones) that may or may not occur.
- Risk management: Scenarios let you plan for multiple outcomes rather than anchoring to one number.
Scenario-based forecasts present:
- Base case: The most probable outcome given current conditions and trends.
- Bull case: An optimistic path triggered by positive catalysts (e.g., XRP ETF approval, strong adoption, favorable legal resolution).
- Bear case: A pessimistic path if negative catalysts (regulatory setbacks, market crashes, liquidity crises) materialize.
Each scenario includes explicit invalidation triggers—price levels or events that signal the scenario is no longer valid and a re-assessment is needed.
What Changes a Year Forecast: Regime Shifts and Catalysts
Multi-year forecasts evolve as market conditions and fundamentals change. Key factors that alter year-level outlooks include:
- Market regime shifts: Transitions between risk-on (bull markets) and risk-off (bear markets) environments, often correlated with Bitcoin dominance, macroeconomic policy, and liquidity cycles.
- Regulatory and legal developments: Progress or setbacks in the SEC lawsuit, new guidance from regulators, or legislative clarity can dramatically shift institutional participation and market access.
- Adoption and utility milestones: Real-world use cases on the XRP Ledger (XRPL), Ripple’s partnerships, RLUSD stablecoin adoption, and cross-border payment volume growth affect fundamental valuation drivers.
- Technical level breaks: Major support or resistance levels (identified via technical analysis) act as regime-change signals—breaking above resistance can validate a bull path; breaking below support can confirm a bear scenario.
- External shocks: Macroeconomic events (inflation policy changes, banking crises, geopolitical tensions) and crypto-specific shocks (exchange collapses, major hacks) create sudden regime changes.
For a detailed explanation of how these drivers interact, see the XRP Catalysts library and Sentiment & Liquidity hub.
XRP Price Prediction 2026
The XRP price prediction for 2026 represents the nearest full-year horizon and is the most data-anchored forecast in this index. It incorporates current technical structure, near-term catalysts, and regime assumptions with the highest confidence.
2026 Base, Bull, and Bear Scenario Snapshot
| Scenario | 2026 Price Range | Key Assumption | Primary Catalyst |
| Bull | $4.50 – $7.00 | ETF approval + risk-on regime | Institutional inflows, legal clarity |
| Base | $2.00 – $3.50 | Moderate growth, no major shocks | Steady adoption, market stability |
| Bear | $0.80 – $1.50 | Risk-off regime or regulatory setback | Liquidity crunch, adverse legal ruling |
The 2026 outlook is sensitive to:
- Q1–Q2 2026 technical breakouts or breakdowns: If XRP breaks above key resistance zones (e.g., $3.00–$3.50), it validates the bull path. A sustained break below $1.80 support would trigger the bear scenario.
- Regulatory milestones: Final SEC lawsuit resolution or formal ETF filing/approval decisions.
- Bitcoin market cycle phase: If BTC enters a parabolic phase in 2026, altcoins including XRP typically benefit; if BTC stagnates or corrects sharply, XRP faces headwinds.
For full scenario details, invalidation triggers, and monthly breakdowns within 2026, visit the dedicated 2026 XRP forecast page.
Key 2026 Levels: Support and Resistance Summary
- Major resistance: $3.00, $3.50, $4.20, $5.00
- Major support: $1.80, $1.40, $1.00, $0.80
These levels are derived from historical price action, Fibonacci retracements, and volume profile analysis. For methodology and real-time updates, see the Technical Analysis hub.
XRP Price Prediction 2027
The XRP price prediction for 2027 extends the 2026 outlook by one year, incorporating assumptions about mid-cycle market behavior, adoption trajectory, and evolving regulatory clarity.
2027 Scenario Summary
| Scenario | 2027 Price Range | Key Assumption | Primary Driver |
| Bull | $6.00 – $10.00 | Sustained institutional demand, strong XRPL adoption | ETF inflows, Ripple expansion |
| Base | $2.50 – $5.00 | Continued growth, no extreme volatility | Steady fundamentals, regulatory stability |
| Bear | $1.00 – $2.00 | Market correction or extended bear phase | Macro headwinds, low liquidity |
Key differences from 2026:
- Longer compounding assumptions: Bull case assumes 2026 catalysts (ETF, legal clarity) have materialized and are now compounding in 2027.
- Mid-cycle risk: If 2026 was a strong bull year, 2027 may face correction risk or consolidation; if 2026 was weak, 2027 could represent recovery.
- Adoption inflection: 2027 scenarios incorporate whether XRPL utility metrics (transaction volume, active addresses, RLUSD usage) have grown or stagnated.
For complete scenario paths, quarterly milestones, and invalidation levels, visit the 2027 XRP forecast.
XRP Price Prediction 2028
The XRP price prediction for 2028 enters the mid-term horizon where market cycle timing and structural adoption trends become the dominant variables.
2028 Scenario Summary
| Scenario | 2028 Price Range | Key Assumption | Primary Driver |
| Bull | $8.00 – $15.00 | Multi-year bull market intact, high institutional adoption | Global regulatory acceptance, CBDC integration |
| Base | $3.00 – $6.00 | Mature growth phase, moderate volatility | Stable market structure, incremental adoption |
| Bear | $1.20 – $2.50 | Extended bear market or cycle top correction | Post-bubble correction, regulatory crackdown |
Key considerations for 2028:
- Market cycle position: 2028 may fall in a post-halving consolidation phase (if Bitcoin’s 2024 halving drives a 2025–2026 bull run) or early in a new cycle.
- Institutional infrastructure maturity: By 2028, ETF markets, custody solutions, and regulatory frameworks should be more established, reducing volatility but potentially capping explosive upside.
- Adoption validation: Whether Ripple’s enterprise partnerships and XRPL use cases have translated into measurable transaction volume and network value.
Visit the 2028 XRP forecast page for detailed quarterly paths and assumption sensitivity analysis.
XRP Price Prediction 2029
The XRP price prediction for 2029 reflects a mature market environment where XRP’s role in the global financial system—and its competitive position—will be clearer.
2029 Scenario Summary
| Scenario | 2029 Price Range | Key Assumption | Primary Driver |
| Bull | $10.00 – $20.00 | XRP becomes a core bridge asset in CBDCs and cross-border systems | Institutional ubiquity, network effects |
| Base | $4.00 – $8.00 | Stable market share in payments and DeFi | Moderate adoption, competitive landscape |
| Bear | $1.50 – $3.00 | XRP fails to capture significant utility or faces obsolescence | Competitor dominance, regulatory barriers |
Key 2029 uncertainties:
- Competitive positioning: Will XRP maintain its lead in cross-border payments, or will competitors (Stellar, SWIFT alternatives, central bank solutions) erode its market share?
- Regulatory landscape maturity: By 2029, most major jurisdictions will have crypto frameworks in place. XRP’s compliance posture and legal history will heavily influence institutional adoption.
- Network effects vs. technological risk: If XRPL adoption reaches critical mass, network effects could drive exponential value; if adoption stalls, technological obsolescence becomes a risk.
For long-term scenario modeling and assumption trees, see the 2029 XRP forecast.
XRP Price Prediction 2030
The XRP price prediction for 2030 represents a key psychological and planning horizon—a full market cycle and half-decade from today. It is the most commonly searched long-term year forecast.
2030 Scenario Summary
| Scenario | 2030 Price Range | Key Assumption | Primary Driver |
| Bull | $15.00 – $30.00 | XRP is a top-3 crypto by market cap and utility | Mass institutional adoption, central bank integration |
| Base | $5.00 – $12.00 | XRP is a stable top-10 asset with solid use cases | Incremental growth, diversified ecosystem |
| Bear | $2.00 – $4.00 | XRP is marginalized or faces existential competitive threats | Regulatory exclusion, tech disruption |
Why 2030 forecasts carry high uncertainty:
- Assumption compounding: A 2030 forecast assumes 4–5 years of correct assumptions about regulation, adoption, competition, and market cycles. Small early errors compound into large variance.
- Technological change: By 2030, blockchain technology and payment systems may have evolved significantly, making 2026 assumptions obsolete.
- Macro environment: Global economic conditions, inflation policy, and financial system structure in 2030 are highly uncertain.
The 2030 XRP forecast page includes transparent assumption lists, sensitivity scenarios (e.g., “What if Ripple adoption grows 20% faster than base case?”), and links to ongoing research updates.
Long-Term Years: 2035 and 2040+
Forecasts beyond 2030 enter speculative territory where assumption uncertainty is extremely high. These pages serve educational and scenario-planning purposes rather than actionable trading or investment guidance.
2035 XRP Outlook
Scenario ranges (illustrative):
- Bull: $30.00 – $100.00 (assumes XRP becomes foundational infrastructure for global payments and CBDCs)
- Base: $8.00 – $25.00 (stable utility, moderate growth)
- Bear: $3.00 – $8.00 (competitive displacement or technological obsolescence)
Key assumption: By 2035, either XRP has achieved deep institutional embedding and network lock-in, or it has been displaced by more efficient systems.
2040+ XRP Outlook
Scenario ranges (highly speculative):
- Bull: $50.00 – $500.00+ (transformational adoption and scarcity dynamics)
- Base: $10.00 – $50.00 (sustained but not explosive growth)
- Bear: $5.00 – $15.00 (mature, commoditized asset with limited upside)
Important caveats for long-term forecasts:
- Technology risk: Blockchain technology may be replaced or fundamentally altered by 2040.
- Regulatory risk: Legal frameworks 15–20 years out are impossible to predict with confidence.
- Market structure: Crypto market structure, liquidity mechanisms, and valuation models may be entirely different.
- Discount rates: The further out the forecast, the higher the discount rate should be—long-term targets should not drive near-term decisions.
For assumption-transparent long-term scenario planning, visit:
Recommendation: Use long-term forecasts to explore “what if” scenarios and stress-test assumptions, not as price targets for portfolio construction.
Common Drivers That Change Multi-Year Paths
Understanding the cross-year drivers that affect multiple time horizons helps you interpret why forecasts change and when to re-evaluate scenarios.
Market Regime: BTC Dominance, Risk Appetite, and Liquidity Cycles
Bitcoin’s market cycle timing heavily influences altcoin performance, including XRP:
- Bull phase (risk-on, declining BTC dominance): Altcoins outperform; XRP bull scenarios become more probable.
- Consolidation phase: BTC dominance rises; altcoins underperform; base or bear scenarios dominate.
- Bear phase (risk-off, liquidity crunch): All crypto assets decline; XRP bear scenarios activate.
Liquidity and leverage conditions:
- High leverage and abundant liquidity (low interest rates, crypto credit expansion) amplify upside in bull scenarios.
- Deleveraging events (exchange collapses, margin calls, credit contraction) trigger sharp drawdowns and validate bear scenarios.
For real-time monitoring of regime indicators, see the Sentiment & Liquidity hub.
Ripple, RLUSD, and XRPL Adoption and Utility Signals
Fundamental adoption metrics directly influence multi-year price paths:
- Ripple partnerships and ODL volume: On-Demand Liquidity (ODL) volume growth signals real utility and can justify higher valuations.
- RLUSD stablecoin adoption: Increased RLUSD usage on XRPL drives transaction volume and network effects.
- XRPL active addresses and transaction count: Growth in these metrics validates network utility; stagnation or decline undermines bull scenarios.
- DeFi and NFT activity on XRPL: Expansion beyond payments into DeFi, tokenization, and NFTs broadens XRP’s value proposition.
Adoption milestones serve as scenario triggers—for example, if ODL volume doubles year-over-year, it may shift a base scenario to a bull scenario.
For detailed fundamental tracking, visit the Fundamentals hub.
Legal, ETF Access, and Institutional Channels
Regulatory and market-access developments are high-impact, low-frequency catalysts that can redefine multi-year trajectories:
- SEC lawsuit resolution: A final favorable ruling removes legal overhang and opens U.S. institutional channels. An adverse ruling would trigger bear scenarios.
- XRP ETF approval: ETF approval creates passive inflows, legitimizes XRP as an institutional asset, and reduces volatility—key enablers of bull scenarios.
- Exchange listings and custody solutions: Broader exchange access (especially in the U.S.) and institutional-grade custody increase liquidity and investor participation.
- Global regulatory clarity: Coordinated regulatory frameworks (e.g., MiCA in Europe, new U.S. legislation) reduce uncertainty and lower risk premiums.
These drivers are binary or stepwise—they occur as discrete events and cause sudden regime changes rather than gradual shifts.
For catalyst tracking and scenario updates tied to legal/regulatory developments, see:
Related Hubs
This Years hub is one layer in VTrader.io’s multi-dimensional XRP forecast network. Use the related hubs below to refine your time horizon, methodology understanding, and driver analysis.
Shorter Time Horizons
- XRP Price Prediction by Month: Navigate to specific months for near-term scenario planning and tactical positioning. Monthly forecasts capture seasonal patterns, volatility regime shifts, and short-term catalysts.
Methodology and Interpretation
- XRP Price Prediction Methodology: Learn how scenarios are constructed, how to interpret confidence levels, and how invalidation triggers work. Essential reading before using any forecast.
Technical and Fundamental Analysis
- XRP Technical Analysis: Explore the chart patterns, support/resistance zones, and indicator signals that define key levels in year-by-year forecasts.
- XRP Fundamentals: Deep dive into adoption metrics, network activity, and valuation models that underpin long-term scenario assumptions.
Catalysts and Drivers
- XRP Catalysts: Browse the full library of high-impact events (regulatory decisions, partnerships, technological upgrades) that trigger scenario shifts.
- XRP Sentiment & Liquidity: Monitor market regime indicators—leverage, funding rates, social sentiment, and liquidity conditions—that determine whether bull, base, or bear scenarios are active.
Pillar Page
- XRP Price Prediction: The main hub linking all forecasting dimensions (years, months, weeks, technical, fundamental, regulatory). Start here for the full semantic network.
Year Comparison Table
Use this table to compare assumptions, key catalysts, and base-case ranges across all published year forecasts:
| Year | Base Case Range | Key Assumption | Main Catalyst | Uncertainty Level |
| 2025 | $1.80 – $3.00 | Short-term technical stability | Regulatory clarity or technical breakout | Moderate |
| 2026 | $2.00 – $3.50 | Moderate growth, stable regime | ETF progress, adoption growth | Moderate |
| 2027 | $2.50 – $5.00 | Continued institutional interest | Sustained Ripple expansion | Moderate-High |
| 2028 | $3.00 – $6.00 | Mid-cycle maturity | Market cycle positioning | High |
| 2029 | $4.00 – $8.00 | Competitive positioning solidifies | Network effects or competitive threats | High |
| 2030 | $5.00 – $12.00 | Long-term adoption trajectory | Mass adoption or stagnation | Very High |
| 2035 | $8.00 – $25.00 | Deep institutional embedding or displacement | Foundational role in payments or obsolescence | Extreme |
| 2040+ | $10.00 – $50.00 | Speculative, technology-dependent | Transformational adoption or replacement | Extreme |
How to use this table:
- Compare base case ranges to see expected growth trajectories under “most likely” assumptions.
- Review key assumptions to identify which variables you believe are most likely to change.
- Check uncertainty level to calibrate your confidence in each forecast—higher uncertainty means wider scenario bands and more frequent updates needed.
Frequently Asked Questions
How are XRP price predictions different by year?
Each year represents a different time horizon and different dominant drivers. Shorter horizons (2026–2027) are more sensitive to technical levels, volatility regimes, and near-term catalysts like ETF decisions or legal rulings. Longer horizons (2030+) depend more on adoption trajectory, competitive positioning, regulatory maturity, and macroeconomic cycles. The further out the forecast, the more assumptions must hold true, increasing uncertainty and requiring explicit assumption lists and invalidation triggers.
What is the XRP price prediction for the next 5 years?
The next 5 years (2026–2030) should be treated as a set of scenario ranges rather than a single target. Base-case ranges suggest gradual growth from $2.00–$3.50 in 2026 to $5.00–$12.00 in 2030, assuming stable adoption, moderate regulatory progress, and no extreme market shocks. Bull scenarios (driven by ETF approval, strong Ripple expansion, risk-on markets) could push 2030 prices toward $15.00–$30.00. Bear scenarios (regulatory setbacks, prolonged bear markets, competitive displacement) could keep 2030 prices in the $2.00–$4.00 range. Always compare scenarios and monitor catalysts that shift probabilities.
Which years have the most uncertainty in XRP forecasts?
Uncertainty increases with time horizon. 2026–2027 have moderate uncertainty because near-term technical structure and catalyst timelines are clearer. 2028–2030 have high uncertainty due to compounding assumptions about market cycles, adoption rates, and regulatory outcomes. 2035 and 2040+ have extreme uncertainty because technology, competition, and market structure may fundamentally change. Long-term forecasts should always list assumptions explicitly and include sensitivity analysis showing how changes in key variables (adoption growth rate, regulatory clarity, competitive dynamics) alter outcomes.
What factors change year-by-year XRP forecasts the most?
The highest-impact factors are:
- Regulatory and legal milestones: SEC lawsuit outcomes, ETF approval decisions, and new legislation create step-function changes in market access and institutional participation.
- Market regime shifts: Transitions between bull and bear markets, driven by Bitcoin cycles, liquidity conditions, and macroeconomic policy, determine whether optimistic or pessimistic scenarios dominate.
- Adoption and utility growth: Real-world usage metrics (ODL volume, RLUSD adoption, XRPL transaction growth) validate or invalidate fundamental value assumptions.
- Technical level breaks: Major support and resistance zones act as regime-change signals—breaking key levels shifts scenario probabilities.
For detailed driver analysis, see the Fundamentals and Catalysts hubs.
Why do different sites show very different XRP yearly predictions?
Forecast variance across publishers stems from different methodologies (technical analysis vs fundamental valuation models), assumption differences (adoption growth rates, regulatory timeline expectations, market cycle timing), transparency levels (high-quality forecasts state assumptions explicitly while low-quality forecasts present single numbers without justification), and update frequency. Always prefer forecasts that provide scenario ranges, explicit assumptions, and links to methodology over single-point predictions with no supporting analysis
How should I compare 2026 vs 2030 XRP forecasts?
Compare them by assumptions and scenario logic, not just price numbers. Identify assumption differences, check catalyst dependencies, review invalidation triggers, compare uncertainty levels, and use shorter horizons to validate longer ones. If 2026 unfolds as expected, it increases confidence in 2027–2030 paths. If 2026 diverges, re-evaluate long-term assumptions.
How often should yearly XRP forecasts be updated?
Update frequency depends on materiality of changes: immediate updates (within 24–48 hours) for major level breaks or regulatory announcements, quarterly updates (every 3 months) to refresh assumptions based on adoption metrics and market regime changes, and event-driven updates when pre-defined invalidation triggers are hit or scenario-shifting catalysts occur.
Where can I find XRP price predictions by month instead of by year?
Use the XRP Price Prediction by Month hub for shorter planning horizons and more granular scenario updates. Monthly forecasts capture seasonal patterns and cyclical volatility, respond faster to near-term catalysts, and provide tactical positioning guidance for traders and short-term investors.
How do legal and ETF developments affect multi-year XRP forecasts?
Legal and ETF developments are binary or stepwise catalysts that cause sudden regime changes. A favorable SEC ruling removes legal overhang and unlocks institutional participation, shifting base scenarios toward bull. XRP ETF approval creates passive buying flows and legitimizes XRP as an institutional asset class. These discrete, high-impact events are often listed as primary scenario triggers in year forecasts.
Disambiguation: Year Hub vs. Individual Year Pages
- This hub (Years): Navigation index, cross-year comparison, driver summaries, and methodology links. Use for orientation and choosing a year.
- Individual year pages (e.g., 2026, 2030): Full scenario details, quarterly milestones, assumption trees, invalidation triggers, and sensitivity analysis. Use for in-depth planning.
Always start at the hub, then drill into the year that matches your investment or analysis horizon.
Last updated: Q1 2026
For weekly and daily updates that feed into year-level forecasts, visit the XRP Price Prediction pillar page and explore the monthly, technical, and catalyst hubs.

Steve Gregory is a lawyer in the United States who specializes in licensing for cryptocurrency companies and products. Steve began his career as an attorney in 2015 but made the switch to working in cryptocurrency full time shortly after joining the original team at Gemini Trust Company, an early cryptocurrency exchange based in New York City. Steve then joined CEX.io and was able to launch their regulated US-based cryptocurrency. Steve then went on to become the CEO at currency.com when he ran for four years and was able to lead currency.com to being fully acquired in 2025.


