
Table of Contents
XRP Technical Analysis (For Price Prediction)
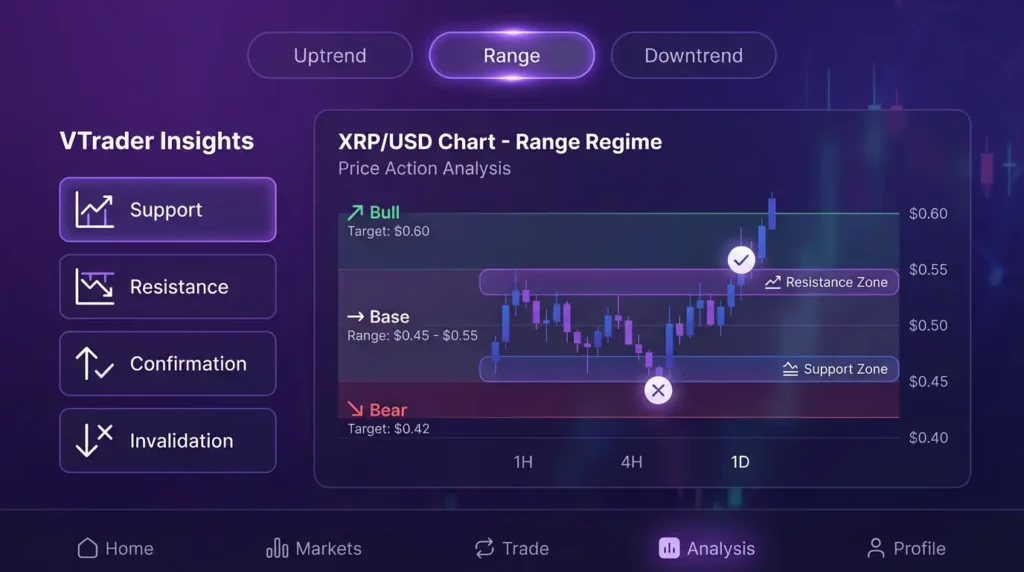
What are the key support and resistance levels for XRP?
Key XRP support and resistance levels are high-liquidity price zones where XRP repeatedly reacts. VTrader defines zones (not single prices) and pairs them with confirmation and invalidation rules so readers can map bullish, base, and bearish scenarios to structure.
Technical analysis helps forecast XRP by identifying structure—trend direction, key price levels, and volatility patterns—then defining confirmation and invalidation rules that convert structure into actionable scenarios. This hub explains how we use TA to build XRP forecasts across all time horizons. For the complete forecasting framework, see the XRP price prediction methodology.
Key Levels Framework: We define support/resistance as zones (not single prices) based on historical reaction points, volume clustering, and liquidity concentration. Each zone includes confirmation triggers (how it validates) and invalidation rules (what disproves it).
Scenario Setup Template: Base Case (trend continues) | Bull Case (trigger: break resistance, confirmation: volume + retest holds) | Bear Case (trigger: break support, confirmation: close below zone). Each scenario includes invalidation conditions.
Apply TA to forecasts: XRP tomorrow forecast | XRP next week forecast | XRP 2026 forecast | XRP 2030 forecast
Last updated: January 14, 2026
What Technical Analysis Means for XRP
Technical analysis is a framework for reading price structure and identifying zones where scenarios change probability. It cannot predict exogenous catalysts (ETF decisions, legal rulings), but it can define ranges and trigger conditions that keep forecasts coherent regardless of which catalyst materializes.
Structure vs Indicators (What Matters More)
Structure refers to price behavior at key levels: trend direction (higher highs/lows or lower highs/lows), support/resistance zones, and volatility regimes. Indicators are mathematical derivatives of price/volume that can help confirm structure but should not replace it.
- Structure first: Where is price relative to key levels? What is the trend?
- Indicators second: Does momentum (RSI, MACD) confirm or diverge from structure?
Why Levels and Liquidity Zones Dominate Outcomes
Crypto markets are liquidity-driven. Large orders cluster at specific price zones, and these clusters determine where price reacts. Understanding where liquidity sits is more predictive than most indicator combinations.
- Support zones: Areas where buy orders cluster and price tends to bounce
- Resistance zones: Areas where sell orders cluster and price tends to stall or reverse
- Liquidity sweeps: Price often moves through zones to trigger stop orders before reversing
Key Levels (Support, Resistance, Invalidation)
Key levels form the foundation of every XRP forecast. They define where scenarios switch probability and provide the confirmation/invalidation framework readers need to track forecasts over time.
How to Identify Support/Resistance Zones
High-quality support/resistance identification requires:
- Multiple touches: Zones where price has reacted at least 2-3 times on higher timeframes
- Volume confirmation: Significant volume traded at the zone, indicating real participation
- Zone width: Treat levels as zones (e.g., $2.00-$2.05) rather than single prices
- Timeframe relevance: Higher timeframe levels (daily, weekly) are more significant than intraday levels
Current XRP Key Levels (January 2026):
| Level Type | Zone | Significance | Scenario Impact |
| Support 1 | $2.00-$2.05 | Psychological + 50-day MA confluence | Break below increases bear probability |
| Support 2 | $1.77-$1.80 | 2025 low / major structural support | Break = base case invalidation |
| Resistance 1 | $2.30-$2.40 | 200-day EMA / prior breakdown zone | Break above confirms bull scenario |
| Resistance 2 | $3.00-$3.20 | 2025 highs / major supply zone | Break = bull scenario acceleration |
| ATH Resistance | $3.65-$3.80 | All-time high zone | Break = new price discovery |
Breakout vs Fakeout Rules (Confirmation Signals)
Not every level break is a true breakout. Fakeouts occur when price briefly crosses a level then reverses. Confirmation rules reduce false signals:
- Close confirmation: Wait for a candle close above/below the zone (not just a wick)
- Volume expansion: True breakouts typically show above-average volume
- Retest behavior: Broken resistance becomes support (and vice versa) on a healthy retest
- Timeframe consistency: Higher timeframe closes (daily, weekly) are more reliable than intraday
Invalidation Rules and Scenario Switching
Every forecast must state what would prove it wrong. Invalidation levels define when the current preferred scenario should be abandoned:
- Bull scenario invalidation: Weekly close below key support shifts probability to base or bear
- Bear scenario invalidation: Weekly close above key resistance shifts probability to base or bull
- Base scenario invalidation: Any decisive level break triggers reassessment toward bull or bear
Trend and Market Regimes (Bull/Bear/Range)
Understanding the current market regime is essential. Strategies that work in a trending market fail in a range, and vice versa.
Higher Highs/Lows and Trend Structure
Trend is defined by swing structure:
- Uptrend: Higher highs (HH) and higher lows (HL) in sequence
- Downtrend: Lower highs (LH) and lower lows (LL) in sequence
- Trend break: First break of the swing sequence (e.g., uptrend prints a lower low)
Range Conditions and Mean Reversion
When price oscillates between support and resistance without trending, different rules apply:
- Range-bound: Price respects both support and resistance; breakout attempts fail
- Mean reversion: Price tends to return to range midpoint; buy support / sell resistance
- Range resolution: Eventually resolves with a breakout; direction often determines next trend
Volatility Expansion vs Compression
Volatility cycles between expansion and compression:
- Compression: Narrow ranges, low ATR, Bollinger Band squeeze—often precedes explosive moves
- Expansion: Wide ranges, high ATR, trending conditions—eventually leads back to compression
Volume, Liquidity, and Market Structure (TA’s Missing Layer)
Traditional TA often ignores liquidity dynamics, but in crypto they’re essential. Price moves differently when liquidity is thin vs thick. For detailed liquidity analysis, see the XRP sentiment and liquidity hub.
Why Liquidity Matters More Than Most Indicators
Liquidity determines how easily price can move through levels:
- Thin liquidity: Price can move rapidly through zones with minimal volume
- Thick liquidity: Price tends to consolidate at zones with heavy order book depth
- Liquidity voids: Gaps where price moves quickly; often created after sharp moves
Volume Interpretation in Crypto
- Breakout volume: True breakouts typically show 2-3x average volume
- Declining volume: Moves on declining volume are suspect; may reverse
- Volume profile: Where most volume traded identifies key zones for future reactions
Derivatives Positioning as Context
Futures open interest, funding rates, and liquidation levels provide context for spot price action. Extreme positioning often precedes reversals. For detailed derivatives analysis, see the sentiment and liquidity hub.
Indicators (Use as Support, Not the Driver)
Indicator Hygiene: Avoid stacking correlated indicators (e.g., RSI + Stochastic + CCI all measure momentum). Prioritize structure + one momentum indicator + one volume indicator.
Moving Averages (Trend Filter)
Moving averages smooth price data to identify trend:
- 50-day MA: Medium-term trend filter; price above = bullish bias
- 200-day MA: Long-term trend filter; often acts as dynamic support/resistance
- Golden/Death cross: 50-day crossing 200-day signals trend shift (lagging but significant)
RSI/MACD (Momentum Context)
- RSI (Relative Strength Index): Measures momentum; >70 = overbought, <30 = oversold (but can stay extreme in trends)
- MACD: Momentum + trend indicator; signal line crosses and histogram show momentum shifts
- Divergences: Price makes new high/low but indicator doesn’t = potential reversal warning
When Indicators Fail (Chop, Regime Shifts)
Indicators fail systematically in certain conditions:
- Choppy/range markets: Trend indicators whipsaw; overbought/oversold signals fail
- Regime shifts: Indicators calibrated to old regime produce false signals in new regime
- Catalyst-driven moves: Indicators can’t anticipate news events; rely on levels and scenario rules instead
Chart Patterns (How to Evaluate Without Overfitting)
Pattern Skepticism: Pattern naming is not prediction. Charts can be retroactively fit to many patterns. Require structure-based confirmation + liquidity context + clear invalidation before acting on any pattern.
Triangles, Ranges, and Breakouts
- Triangles: Ascending (bullish bias), descending (bearish bias), symmetric (neutral)—but direction not guaranteed
- Ranges: Horizontal consolidation between support and resistance; eventual breakout sets direction
- Breakout rules: Wait for close + volume confirmation; watch for retest behavior
Elliott Wave / ABC Patterns (Limitations + Confirmation)
Elliott Wave provides a framework for understanding market cycles but has significant limitations:
- Subjective: Wave counts can be interpreted multiple ways; different analysts see different patterns
- Requires confirmation: Use wave analysis as hypothesis, not prediction; confirm with structure and levels
- Define invalidation: Every wave count should state what level break would invalidate it
Example: XRP’s ABC Wave Pattern Predicts Potential Price Surge
TA → Forecast Scenarios (How We Publish Outputs)
Technical analysis converts to published forecasts through our scenario framework. Each horizon uses TA differently:
| Horizon | TA Focus | Timeframe | Key Levels | Update Freq |
| Today/Tomorrow | Intraday structure, immediate levels | 1H, 4H, Daily | Tight zones | Daily |
| Next Week | Daily structure, weekly zones | Daily, Weekly | Week’s range | Weekly |
| Monthly | Weekly structure, monthly zones | Weekly, Monthly | Month range | Monthly |
| Yearly | Monthly structure, major levels | Monthly | Year range | Quarterly |
Next-Day Setups (Today/Tomorrow)
Short-term forecasts focus on intraday levels, immediate catalyst windows, and tight scenario ranges. Structure must be confirmed on 4H or daily timeframes. See: XRP price prediction today | XRP price prediction tomorrow
Next-Week Setups
Weekly forecasts use daily structure and weekly support/resistance zones. The week’s open-close range defines primary scenarios. See: XRP price prediction next week | Ripple XRP price forecast: What this week holds
Monthly and Year Setups (2026, 2030)
Longer horizons use higher-timeframe structure and major historical levels. TA provides range context while fundamentals and catalysts drive scenario probabilities. See: XRP price prediction by month | XRP price prediction 2026
Risk Management for Forecast Readers (Not Advice, but Framework)
Technical analysis provides structure for risk management. These are educational concepts, not personalized advice.
Position Sizing Principles
- Risk per trade: Define maximum loss per trade as percentage of portfolio (commonly 1-2%)
- Position size: Calculate based on distance to invalidation level; tighter stops = larger positions (same risk)
Stop Placement and Invalidation
- Below/above structure: Place stops beyond key levels, not at round numbers where they cluster
- Invalidation = exit: When price hits stop level, the setup is invalidated; exit without hoping for recovery
Avoiding Narrative-Driven Overconfidence
- Narratives are not setups: “XRP will moon because of ETF” is a narrative, not a structured trade setup
- Structure overrides story: If price breaks support, the bearish structure matters more than the bullish story
Common TA Mistakes in XRP Predictions
- Single indicator reliance: Treating RSI “oversold” as a buy signal without structure confirmation
- Ignoring invalidation: Not defining what would prove the setup wrong before entering
- Overfitting patterns: Finding patterns that “fit” historical data but have no predictive value
- Ignoring market regime: Using trend strategies in ranges or range strategies in trends
- Ignoring BTC: XRP setups can fail when Bitcoin breaks down, regardless of XRP-specific structure
- No update discipline: Failing to revise forecasts when structure changes
Frequently Asked Questions
Is technical analysis useful for XRP price prediction?
Technical analysis is useful for defining structure—trend, key levels, and scenario rules. It can’t predict exogenous catalysts, but it helps map likely ranges and define confirmation/invalidation conditions so forecasts remain coherent.
What indicators work best for XRP technical analysis?
Indicators work best as supporting tools. Moving averages can filter trend; RSI/MACD can show momentum shifts. But structure and liquidity zones usually matter more than stacking multiple indicators that often correlate.
How do you find XRP support and resistance levels?
Identify high-liquidity zones where price repeatedly reacts on higher timeframes (daily/weekly). Treat levels as zones, look for multiple touches, and confirm with volatility and volume behavior around the zone.
What does ‘invalidation’ mean in XRP technical setups?
Invalidation is the level or condition that proves the current setup is wrong—often a decisive break of support/resistance or a structural shift. When invalidation occurs, the forecast should state which scenario becomes most likely next.
Do chart patterns like Elliott Wave work for XRP?
Patterns can be descriptive but are unreliable without confirmation. Use patterns as hypotheses and require structure-based confirmations (breakout, retest, trend shift) and clear invalidation rules to avoid narrative overfitting.
Why do XRP breakouts fail (fakeouts)?
Breakouts fail when liquidity is insufficient, broader market regime turns risk-off, or price sweeps liquidity and reverses. Confirmation rules (close above/below, retest behavior, volatility expansion) reduce fakeout risk.
How does Bitcoin affect XRP technical analysis?
Bitcoin often sets the overall market regime. If BTC breaks key levels or volatility spikes, XRP setups can fail even if XRP structure looks clean. Use BTC regime as a context layer when evaluating XRP setups.
How often should XRP technical levels be updated?
Update after meaningful structure changes: a major breakout/breakdown, a new swing high/low, or volatility regime change. For short-horizon pages, update more frequently; for year hubs, update with a log and only when levels materially change.
Should I use TA for tomorrow, next week, or 2026 forecasts?
TA applies to all horizons, but the timeframe changes. Tomorrow uses intraday/daily structure; next week uses daily/weekly zones; 2026 uses higher-timeframe levels and multi-phase scenario mapping.
What are the most common mistakes in XRP technical predictions?
Common mistakes include treating a single indicator as a ‘signal’, ignoring invalidation levels, overfitting patterns, and ignoring market regime/liquidity. High-quality forecasts use scenarios and explicit confirmation rules.
Related Forecast Hubs
- XRP price prediction – Main pillar hub
- XRP fundamentals hub – Adoption and utility metrics
- XRP catalysts hub – Event and driver tracking
- XRP price targets – Target feasibility analysis
- XRP AI modeling hub – AI-assisted forecasting
Last updated: January 14, 2026

Steve Gregory is a lawyer in the United States who specializes in licensing for cryptocurrency companies and products. Steve began his career as an attorney in 2015 but made the switch to working in cryptocurrency full time shortly after joining the original team at Gemini Trust Company, an early cryptocurrency exchange based in New York City. Steve then joined CEX.io and was able to launch their regulated US-based cryptocurrency. Steve then went on to become the CEO at currency.com when he ran for four years and was able to lead currency.com to being fully acquired in 2025.


