
Table of Contents
XRP Sentiment & Liquidity (For Price Prediction)
What do XRP funding rate and open interest mean?
XRP funding rate reflects the cost of holding perpetual futures positions and can signal crowded longs/shorts, while open interest shows how much leverage is in the system. Extreme funding + rising OI can increase squeeze and liquidation risk, widening next-day and next-week forecast ranges.
Sentiment and liquidity signals help estimate near-term range expansion, squeeze risk, and probability shifts in forecast scenarios. These metrics bridge the gap between technical structure and catalyst-driven regime changes. For the complete forecasting framework, see the XRP price prediction methodology.
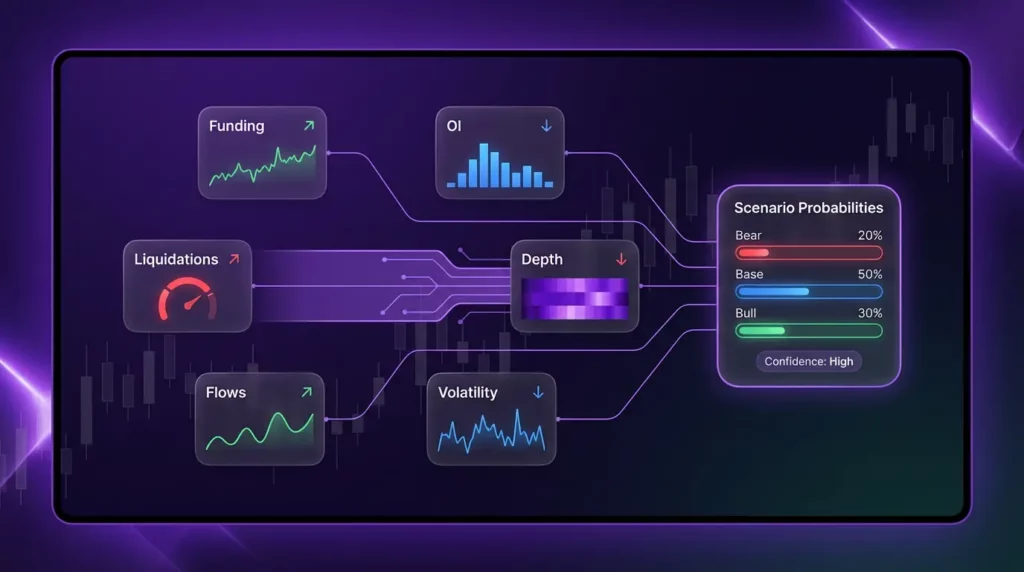
Signal Dashboard: Funding Rate | Open Interest | Liquidations | Order Book Depth | Exchange Flows | Volatility Regime
How to Interpret: Each signal has bullish, bearish, and neutral states. Context matters more than any single reading. Extreme values increase forecast range width; conflicting signals suggest range-bound conditions.
Apply to forecasts: XRP price prediction today | XRP price prediction tomorrow | XRP price prediction next week
Last updated: January 14, 2026
What ‘Sentiment’ Means in Crypto Markets
In crypto, ‘sentiment’ isn’t just social media buzz or survey data. It’s the aggregate positioning of traders as revealed through derivatives markets, order flows, and liquidity conditions. These measurable signals matter more than subjective mood assessments.
Positioning vs Emotions (Why Derivatives Matter)
Derivatives markets reveal actual capital commitment:
- Perpetual futures positioning: Funding rates and open interest show where traders have money at risk
- Leveraged exposure: Unlike spot holdings, derivatives positions can be forced to close (liquidations)
- Measurable vs narrative: Data from exchanges is more actionable than Twitter sentiment
Reflexivity and Squeezes (Why It Moves Fast)
Crypto markets are reflexive—positioning creates feedback loops:
- Crowded positioning: When too many traders are on one side, the opposite move becomes explosive
- Liquidation cascades: Forced selling/buying creates self-reinforcing price moves
- Fast regime shifts: Markets can flip from bullish to bearish positioning within hours
Funding Rate (Perpetuals) – What It Signals
Funding rate is the periodic payment between long and short holders of perpetual futures contracts. It keeps the perpetual price anchored to spot price and reveals the dominant market bias.
Positive vs Negative Funding Interpretation
| Funding State | What It Means | Market Bias | Scenario Impact |
| Positive (mild) | Longs pay shorts; normal in uptrends | Bullish bias | Trend continuation likely |
| Positive (extreme) | Longs paying high premium; crowded | Overextended long | Squeeze risk increases |
| Negative (mild) | Shorts pay longs; bearish lean | Bearish bias | Downtrend continuation likely |
| Negative (extreme) | Shorts paying high premium; crowded | Overextended short | Short squeeze risk |
Funding Extremes and Squeeze Risk
Extreme funding creates squeeze conditions:
- High positive funding: Longs are paying significant premium to stay positioned; vulnerable to downside moves
- High negative funding: Shorts are paying to stay positioned; vulnerable to upside moves
- Threshold context: What counts as ‘extreme’ varies by market conditions; compare to recent history
Funding vs Trend (When It’s Contrarian)
Funding becomes most predictive when it diverges from price action. If price is making new highs but funding is resetting or turning negative, it suggests the rally may be healthier (not crowded). If price is falling but funding stays positive, it suggests trapped longs who may capitulate.
Open Interest (OI) – Positioning Pressure
Open interest represents the total number of outstanding derivatives contracts. Rising OI means new positions are being opened; falling OI means positions are being closed. OI is the ‘fuel’ that can amplify moves.
OI Rising with Price vs Against Price
| OI Change | Price Change | Interpretation | Implication |
| Rising | Rising | New longs entering; trend participation | Bullish continuation likely |
| Rising | Falling | New shorts entering; building pressure | Bearish pressure building |
| Falling | Rising | Short covering rally; positions closing | Rally may be temporary |
| Falling | Falling | Long capitulation; positions closing | Decline may exhaust soon |
OI Spikes and Liquidation Cascades
Sudden OI spikes signal increased leverage and potential volatility:
- OI spike + extreme funding: High liquidation risk; forecast range should widen
- OI spike + thin liquidity: Cascade risk elevated; price can move sharply on liquidations
- OI flush: Rapid OI decline signals positions were closed (liquidated or stopped out)
Liquidations – Forced Flows and Volatility
Liquidations occur when traders’ margin is insufficient to maintain their positions. The exchange force-closes the position, creating a market order that can accelerate price moves.
Long vs Short Liquidations
- Long liquidations: Occur when price drops; create forced selling that accelerates downside
- Short liquidations: Occur when price rises; create forced buying that accelerates upside
- Liquidation cascades: One liquidation triggers price move, causing more liquidations—self-reinforcing
‘Liquidity Sweep’ Behavior and Fakeouts
Price often moves to ‘sweep’ liquidity (trigger stop losses and liquidations) before reversing:
- Stop hunts: Price pushes through obvious support/resistance to trigger stops, then reverses
- Fakeout recognition: Watch for rapid reversal after liquidation spike + volume exhaustion
- Confirmation rules: Wait for close beyond level + sustained follow-through before confirming breakout
Liquidity and Order Book Depth (Market Impact)
Liquidity determines how easily XRP can be bought or sold without significant price impact. Order book depth shows the resting bids and asks at various price levels.
Depth/Spreads and Slippage (Why Levels Break)
- Deep books: Large orders can execute with minimal slippage; levels tend to hold
- Thin books: Even moderate orders cause significant price impact; levels break easily
- Spread widening: When bid-ask spreads widen, it signals reduced market maker participation and higher volatility risk
Thin Liquidity = Wider Forecast Bands
When liquidity is thin, forecast ranges should widen because price can move further on the same order flow. This is especially important for short-horizon forecasts (XRP price prediction this week, XRP price prediction next 7 days) where microstructure matters most.
Flows and ‘Whale’ Activity (On-Chain / Exchange)
Exchange flows and large wallet movements can provide context about supply/demand dynamics, but these signals are noisier than derivatives data.
Exchange Inflows/Outflows (Context, Limitations)
- Inflows: XRP moving to exchanges can indicate intent to sell—but not always (could be for trading, staking, etc.)
- Outflows: XRP leaving exchanges reduces immediate sell-side availability—but timing is uncertain
- Context required: Exchange-held XRP is down 57% since early 2025; structural tightening in available supply
Large Transfers vs Meaningful Distribution
Large wallet movements (‘whale alerts’) generate attention but are often noise. Many large transfers are internal movements (exchange cold wallets, escrow operations) rather than market-moving distribution. Combine flow data with price structure and derivatives positioning before adjusting scenarios.
Volatility Regimes (Compression vs Expansion)
Volatility cycles between compression (tight ranges) and expansion (wide moves). The current volatility regime directly affects forecast range width.
Why Volatility Changes Forecast Range
- Low volatility: Narrow forecast ranges appropriate; mean reversion strategies work better
- High volatility: Wide forecast ranges required; trend-following works better
- Regime transition: Compression often precedes expansion; watch for breakout setups after extended quiet
How to Detect Regime Shifts
- ATR (Average True Range): Rising ATR signals expansion; falling ATR signals compression
- Bollinger Band width: Squeeze (narrow bands) often precedes breakout
- Implied volatility: Options IV shows market’s expectation of future volatility
Putting Signals Together (Scenario Probability Shifts)
Individual signals are less useful than combined context. Here’s how signals map to scenario probabilities:
Bull Case: Risk-On + Supportive Positioning
Bull scenario probability increases when:
- Funding is mildly positive or resetting (not extreme)
- OI rising with price (trend participation)
- Order book depth is solid; liquidity is healthy
- Exchange outflows persistent; available supply tightening
Base Case: Mixed Signals + Range Rules
Base scenario remains most likely when:
- Signals are mixed (some bullish, some bearish)
- Funding neutral; OI stable
- Volatility compressed; range-bound conditions
- No clear directional catalyst on horizon
Bear Case: Risk-Off + Distribution + Thin Liquidity
Bear scenario probability increases when:
- Funding extreme positive (crowded longs vulnerable)
- OI rising while price stalls (building liquidation risk)
- Order book depth thin; spreads widening
- Exchange inflows spiking; potential distribution
How VTrader Uses These Signals (Method Excerpt)
Sentiment and liquidity signals feed directly into our forecast updates. For the full methodology, see the XRP price prediction methodology hub.
Update Triggers
We update forecasts when sentiment/liquidity conditions change materially:
- Funding flips (positive to negative or vice versa)
- OI spikes or flushes (>20% change)
- Major liquidation events (>$50M)
- Volatility regime shifts (compression to expansion)
Avoiding Overfitting (Signal Hygiene)
Signal Hygiene Checklist: Avoid double-counting correlated indicators. Prefer a small set of orthogonal signals (funding, OI, depth, flows, volatility) over stacking similar metrics. Context > any single reading.
Related: XRP technical analysis hub (structure context) | XRP catalysts hub (events that break signals)
Common Mistakes With Sentiment/Liquidity Data
- Single-signal trading: Treating one funding reading as a trade signal without structure/catalyst context
- Ignoring regime: What’s ‘extreme’ in one regime may be normal in another
- Flow data overconfidence: Whale alerts and exchange flows are noisy; don’t trade on alerts alone
- Ignoring BTC: Bitcoin sentiment often overrides XRP-specific signals in the short term
- Lagging updates: Sentiment data can change rapidly; stale readings can mislead
Forecast applications: XRP price prediction | XRP price prediction 2026 | XRP price prediction next month | SEC lawsuit impact | XRP ETF impact | XRP AI modeling
Frequently Asked Questions
Is funding rate bullish or bearish for XRP?
Funding is context-dependent. Mild positive funding can be normal in uptrends, but extreme positive funding can signal crowded longs and increase squeeze risk. Negative funding can mean bearish positioning—or contrarian upside if shorts become crowded.
What does rising open interest mean for XRP price?
Rising OI means more leverage and positioning. If OI rises with price, it can signal trend participation; if OI rises while price stalls or falls, liquidation risk can build. The key is how OI changes relative to price, volatility, and liquidity depth.
Do liquidations cause XRP crashes or rallies?
Liquidations are forced orders that can accelerate moves. Long liquidations can intensify downside; short liquidations can fuel sharp rallies. They often mark volatility events and can create temporary extremes that revert once forced flow ends.
How do you spot a short squeeze or long squeeze in XRP?
Squeeze risk increases when positioning is crowded (funding extremes, elevated OI) and liquidity is thin. A sudden move through a key level can trigger liquidations and cascade. Use confirmation and invalidation rules rather than assuming a squeeze will happen.
What is ‘liquidity’ in crypto and why does it matter for XRP?
Liquidity is how easily XRP can be bought or sold without moving the price. When depth is thin and spreads widen, price can move sharply on relatively small orders, so forecast ranges should widen and fakeouts become more common.
How do exchange inflows/outflows affect XRP price short-term?
Inflows can indicate potential sell-side availability and outflows can indicate reduced immediate supply, but signals are noisy. The best use is context: combine flows with price structure, liquidity depth, and derivatives positioning before changing scenarios.
How does Bitcoin sentiment affect XRP sentiment?
Bitcoin often sets the market’s risk regime. When BTC volatility spikes or risk sentiment shifts, XRP positioning can unwind quickly. Treat BTC as a context layer that can override XRP-specific signals in the short term.
Which sentiment signals matter most for tomorrow vs next week?
For tomorrow, focus on funding changes, OI shocks, liquidation events, and liquidity depth. For next week, combine these with volatility regime and macro/catalyst windows to estimate whether ranges will expand or compress.
Can sentiment data help with the 2026 XRP forecast?
It’s less predictive for long horizons, but it helps identify regime shifts and risk premium changes that can persist. Use it to adjust probability bands, not to set long-term price targets.
How often should sentiment and liquidity metrics be updated?
Update when conditions materially change: funding flips, OI spikes/drops, liquidation events occur, or liquidity depth shifts. For short-horizon pages, updates can be more frequent; keep an update log to avoid confusion.
Last updated: January 14, 2026

Steve Gregory is a lawyer in the United States who specializes in licensing for cryptocurrency companies and products. Steve began his career as an attorney in 2015 but made the switch to working in cryptocurrency full time shortly after joining the original team at Gemini Trust Company, an early cryptocurrency exchange based in New York City. Steve then joined CEX.io and was able to launch their regulated US-based cryptocurrency. Steve then went on to become the CEO at currency.com when he ran for four years and was able to lead currency.com to being fully acquired in 2025.


