
Table of Contents
How do you predict XRP price?
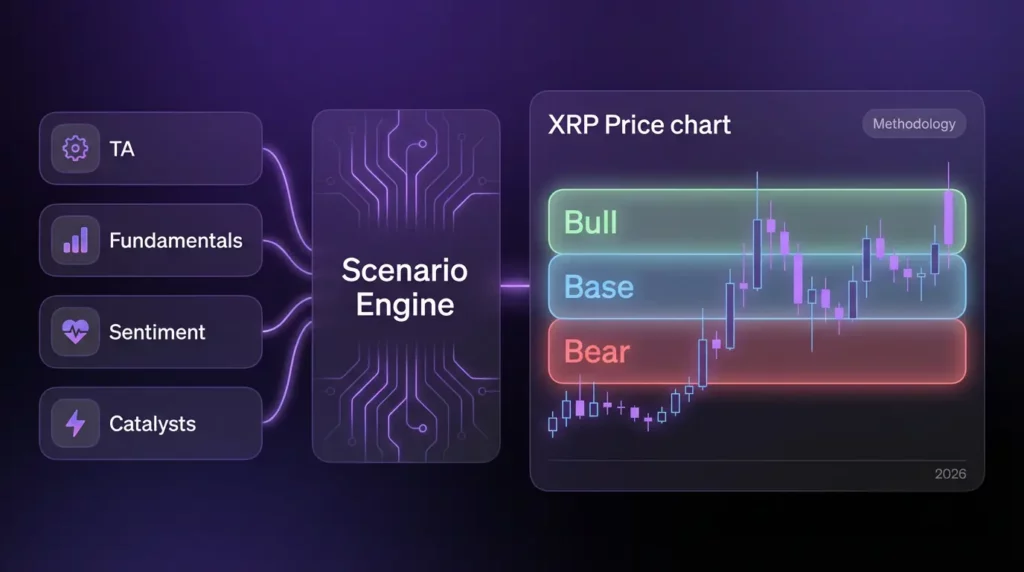
We forecast XRP using a scenario model: technical structure and key levels, fundamentals and tokenomics, sentiment/liquidity signals, and catalysts like ETF or legal news. Outputs are bull/base/bear ranges with confirmation and invalidation levels.
Our XRP forecasting methodology follows a three-step process:
- Inputs: Gather data from technical analysis, fundamentals, sentiment/liquidity, and catalyst tracking
- Models/Rules: Apply scenario logic to convert inputs into probability-weighted outcomes
- Output: Publish scenario ranges (bull/base/bear) with key levels and invalidation triggers
Method Modules: Technical Analysis | Fundamentals | Sentiment & Liquidity | Catalysts | Scenarios | AI/Modeling
Update Policy: We update forecasts on breakouts/breakdowns, major catalyst changes (ETF/legal/macro), and volatility regime shifts. Scheduled updates occur weekly for short-horizon hubs and monthly for monthly/yearly hubs.
Disclaimer: Scenario-based estimates, not financial advice. Past performance does not guarantee future results. Always conduct your own research.
Method last updated: January 14, 2026
What This Methodology Page Covers (and What It Doesn’t)
This page explains how we build XRP forecasts—the inputs, rules, and outputs. It is not a forecast itself. For actual predictions, visit the XRP price prediction pillar hub.
This page covers:
- How we structure forecast outputs (ranges, levels, invalidation)
- What inputs we use (technical, fundamental, sentiment, catalysts)
- How we convert inputs into scenarios (base, bull, bear)
- When and why we update forecasts
- Known limitations and common misinterpretations
This page does not provide specific price targets or time-bound predictions. Those are found on the relevant forecast hubs (yearly, monthly, targets).
The Forecast Output: Ranges, Key Levels, and Invalidation
Every VTrader XRP forecast follows a standardized output format. This consistency enables readers to compare forecasts across time horizons and track how conditions evolve.
Why We Use Ranges (Not Single Price Points)
Markets are probabilistic. A single price target implies false precision that doesn’t exist. Scenario ranges acknowledge uncertainty and let us:
- Tie outcomes to specific conditions (what must be true)
- Update probabilities as evidence changes
- Provide actionable information for different risk profiles
Key Levels: Support, Resistance, and Liquidity Zones
Key levels are price zones where scenario probabilities shift:
- Support: Zones where buying pressure has historically dominated; breaks increase bear probability
- Resistance: Zones where selling pressure has historically dominated; breaks increase bull probability
- Liquidity zones: Areas with concentrated order book depth that can accelerate or absorb price moves
Invalidation: When the Base Scenario Stops Being True
Every forecast includes an invalidation level—the price or condition that would cause us to reassess the base scenario:
- Weekly closes below major support shift probability toward bear scenarios
- Weekly closes above major resistance shift probability toward bull scenarios
- Catalyst failures (expected ETF denied, adverse legal ruling) trigger immediate reassessment
Our Inputs (Entity-Attribute-Value Model)
We organize forecast inputs using an Entity-Attribute-Value (EAV) framework. This structures data consistently and makes it clear how each input affects scenario probabilities.
| Category | Entity | Attribute | Example Values | Scenario Impact |
| Technical | Price | Trend structure | Uptrend / Range / Downtrend | Uptrend = bull bias; Downtrend = bear bias |
| Technical | Price | Key levels | $2.00 support, $2.35 resistance | Breaks shift scenario probabilities |
| Fundamental | XRP/XRPL | Adoption metrics | ODL volume, partnerships | Growth supports long-term bull scenarios |
| Fundamental | Supply | Circulating/escrow | 57.5B circ / 1B monthly unlock | Affects market cap math and targets |
| Sentiment | Derivatives | Funding rate | Positive / Negative / Neutral | Extreme funding warns of reversals |
| Catalyst | ETF | Approval status | Filed / Approved / Denied | Approvals = scenario switch to bull |
| Catalyst | Regulation | Legal status | Settled / Pending / Adverse | Clarity reduces risk premium |
Technical Structure Inputs (Trend, Levels, Volatility)
Technical inputs form the foundation for short-to-medium term forecasts. We prioritize higher-timeframe structure over lower-timeframe noise. For detailed technical methodology, see the XRP technical analysis hub.
Example: XRP’s ABC Wave Pattern Predicts Potential Price Surge
Fundamental Inputs (Utility, Adoption, Tokenomics)
Fundamentals matter most for multi-year horizons and for judging whether rallies are sustainable. We track:
- Payment corridor usage (ODL volume)
- Institutional partnerships and banking integrations
- XRPL network activity and developer ecosystem
- Supply dynamics (circulating, escrow, burn rate)
For detailed fundamental analysis, see the XRP fundamentals hub.
Sentiment & Liquidity Inputs (OI, Funding, Depth, Flows)
Sentiment and liquidity inputs help explain whether price moves are supported by healthy participation or fragile leverage:
- Open interest and funding rates (derivatives positioning)
- Order book depth and liquidity zones
- ETF flows (creation/redemption activity)
- Market-wide risk sentiment (BTC dominance, volatility indices)
For detailed sentiment analysis, see the XRP sentiment and liquidity hub.
Catalyst Inputs (ETF, Regulation, Macro, Ripple/XRPL News)
Catalysts are events that can rapidly shift scenario probabilities. We track:
- ETF filings, approvals, and flow data
- Regulatory developments (legislation, SEC actions, international approvals)
- Macro events (Fed decisions, risk-on/risk-off shifts, geopolitical)
- Ripple ecosystem news (partnerships, RLUSD, XRPL upgrades)
For catalyst tracking, see the XRP catalysts hub.
How We Convert Inputs Into Scenarios
Inputs are converted into three scenario types. Each scenario has defined conditions, probability range, and triggers that would shift probabilities. For the full scenario framework, see the XRP scenarios hub.
Base Case (Highest Probability) Rules
The base case represents the most probable outcome given current conditions:
- Assumes current trend continues without major catalyst disruption
- Price stays within defined support/resistance range
- Macro environment remains neutral to slightly supportive
Bull Case Triggers + Confirmations
Bull scenarios gain probability when:
- Price breaks above key resistance with volume confirmation
- Positive catalyst materializes (ETF approval, favorable legislation)
- ETF inflows accelerate significantly
- Macro shifts to strong risk-on (Fed cuts, BTC rally)
Bear Case Triggers + Risk Controls
Bear scenarios gain probability when:
- Price breaks below key support (weekly close confirmation)
- Negative catalyst materializes (regulatory setback, ETF denial)
- ETF outflows persist for multiple consecutive days
- Macro shifts to risk-off (recession fears, BTC breakdown)
Example: Ripple SEC excitement dims, XRP slips amid profit-taking
How Often We Update Forecasts (Update Policy)
Scheduled Updates (Weekly/Monthly)
- Today/Tomorrow/Next Week hubs: Updated weekly or more frequently during high volatility
- Monthly hubs: Updated at month start and when material conditions change mid-month
- Yearly hubs: Updated quarterly and after major catalyst events
Event-Driven Updates (ETF/Legal, Macro Shocks, Breakouts)
Immediate updates occur when:
- Price breaks a defined invalidation level (support/resistance)
- Major catalyst materializes (ETF decision, legislative vote, legal ruling)
- Macro regime shifts (Fed surprise, major geopolitical event)
- Volatility regime changes significantly (calm to chaotic or vice versa)
What Changes vs What Stays Stable
- Changes frequently: Short-term price ranges, near-term levels, probability weightings
- Stays relatively stable: Methodology framework, input categories, scenario logic, long-term structural levels
Data Sources and Verification
Transparency about data sources helps readers evaluate forecast quality and verify inputs independently.
On-Chain + Network Metrics Sources
- XRPL transaction data and network metrics
- Exchange balance tracking (centralized exchange holdings)
- Whale wallet monitoring and large transaction alerts
Market Data Sources (Price/Volume/OI)
- Major exchange price feeds (aggregated for accuracy)
- Derivatives data (open interest, funding rates, liquidations)
- ETF flow data (creation/redemption, AUM tracking)
Regulatory/News Sources
- Official regulatory filings (SEC, international regulators)
- Ripple official announcements and partnerships
- Major financial news sources for macro context
Related: Crypto Market Outlook 2025 | Crypto Market Trends
Known Limitations and Common Misinterpretations
Correlation ≠ Causation
Historical patterns may not repeat. Just because XRP rallied after previous ETF news doesn’t mean it will rally after the next ETF news. We use correlations as probability modifiers, not certainties.
Market Cap Math vs Hype (Targets)
Price targets require feasibility analysis. A $100 XRP implies ~$5.7T market cap—larger than the current entire crypto market. Our targets hub shows the math and conditions required for each target level.
Model Risk and Black Swans
No model can predict black swan events (exchange failures, unexpected regulatory actions, geopolitical shocks). Scenarios should be treated as probability ranges, not guarantees. Invalidation levels exist precisely because unexpected events occur.
Related: ChatGPT, Grok, and Claude weigh in: Has the 2025 XRP rally reached its peak?
How to Use This Method on Our XRP Pages (Navigation)
All VTrader XRP forecast pages follow this methodology. Choose based on your planning horizon:
Today/Tomorrow/Next Week Forecasts
For traders and short-term positioning. Focus on immediate levels, order flow, and near-term catalyst calendar: XRP price prediction today | XRP price prediction next week
Monthly (2026 Priority) Forecasts
For swing traders and medium-term planning. Focus on 30-day structure, monthly catalyst windows, and trend confirmation: XRP price prediction by month | XRP price prediction 2026
Yearly Forecasts
For long-term investors. Focus on multi-year cycles, adoption trajectories, and regulatory evolution: XRP price prediction by year
Price Target Feasibility Pages
For understanding “Can XRP reach $X?” questions. Focus on market-cap math, required conditions, and realistic time horizons: XRP price targets hub | Altcoins explained
Frequently Asked Questions
What is the most reliable method for XRP price prediction?
The most reliable approach is multi-input scenario forecasting: combine technical structure (levels and trend), fundamentals (adoption/utility and tokenomics), liquidity/sentiment signals, and catalysts (ETF/legal/macro). Then publish ranges with clear invalidation rules.
Why do you use bullish, base, and bearish scenarios instead of one target price?
Crypto is a probability-driven environment. Scenarios let us tie ranges to conditions and update the forecast as evidence changes. A single number hides uncertainty; scenarios make uncertainty explicit and actionable.
Which indicators do you use for XRP technical analysis forecasts?
We prioritize higher-timeframe structure: trend (higher highs/lows), support/resistance zones, moving averages, RSI, volatility bands, and volume/liquidity context. Indicators are used to support structure, not replace it.
What fundamental metrics matter most for XRP’s long-term outlook?
Utility and adoption signals are key: payment corridor usage, institutional partnerships, XRPL network activity, developer ecosystem growth, and competitive positioning. Fundamentals matter most for multi-year horizons and for judging whether rallies are sustainable.
How do you account for XRP tokenomics and escrow releases in forecasts?
We state supply assumptions and track circulating supply and escrow release schedules as context. Tokenomics shape long-term valuation constraints, while short-term moves are usually dominated by liquidity and catalysts.
How do ETF headlines change your XRP prediction scenarios?
ETF developments can shift accessibility and liquidity expectations, changing probability bands for bull/base/bear scenarios. We treat ETF news as a scenario switch that needs confirmation (trend/flows/liquidity) and invalidation (failed breakouts).
How do legal or regulatory decisions affect XRP forecasts?
Regulatory clarity can lower risk premiums and expand exchange/institutional access, while adverse outcomes can restrict liquidity and increase uncertainty. We map legal events to scenario changes with explicit conditions and key levels.
What sentiment and liquidity signals do you track for XRP?
We watch derivatives positioning (funding/open interest), volume and order-book depth, volatility regimes, and market-wide risk sentiment. These help explain whether price moves are supported by healthy liquidity or fragile leverage.
How often do you update XRP price predictions and why?
We update on a schedule (weekly for short-horizon hubs; monthly for monthly hubs) and immediately after market structure breaks or major catalysts (ETF/legal/macro) that change scenario probabilities.
What would invalidate an XRP price prediction?
Invalidation occurs when key assumptions fail—typically a break of a defined level that flips trend structure, or a catalyst that materially changes risk/participation (e.g., adverse legal outcomes). Forecasts must state the invalidation level and what changes next.
Can AI accurately predict XRP price?
AI can help summarize patterns and probabilities from historical data, but it can’t reliably foresee black swans or sudden regulatory events. We use AI as a support tool within a transparent scenario framework, not as a single-source oracle. See the AI modeling hub for more details.
Where should I start: daily, monthly, yearly, or targets?
Start with your time horizon: traders use Today/Tomorrow/Next Week; swing traders use Monthly; investors use Yearly; and Targets pages are for feasibility and conditions. This methodology hub explains how all of them connect.

Steve Gregory is a lawyer in the United States who specializes in licensing for cryptocurrency companies and products. Steve began his career as an attorney in 2015 but made the switch to working in cryptocurrency full time shortly after joining the original team at Gemini Trust Company, an early cryptocurrency exchange based in New York City. Steve then joined CEX.io and was able to launch their regulated US-based cryptocurrency. Steve then went on to become the CEO at currency.com when he ran for four years and was able to lead currency.com to being fully acquired in 2025.


