Table of Contents
Can XRP Reach $50? Feasibility, Market Cap Math, and Scenarios
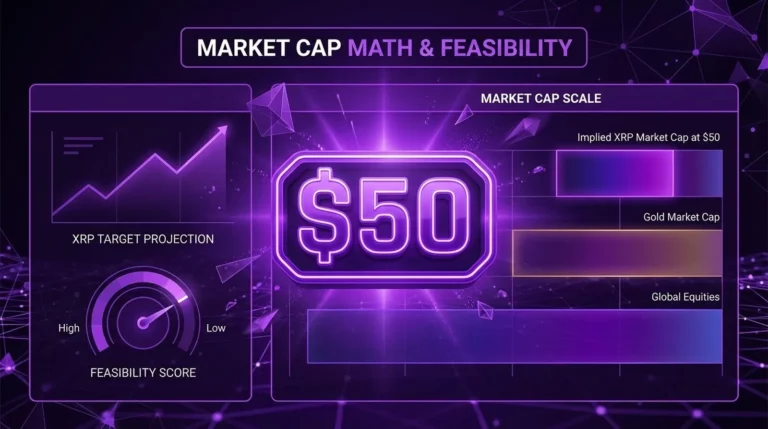
What market cap would XRP need to reach $50?
At $50, XRP’s market cap equals $50 × supply: ~57 billion XRP implies ~$2.85 trillion; 100 billion implies ~$5 trillion. That scale would likely require broad access, deep liquidity, and strong catalysts over multiple cycles—not a short-term move.
Reaching $50 per XRP is a very ambitious target under current market structure. At roughly 57 billion tokens in circulation, $50 implies a market capitalization of approximately $2.85 trillion—larger than any single cryptocurrency has ever achieved. Using the full 100 billion max supply, the implied market cap rises to $5 trillion, a figure that approaches the total market capitalization of gold. While not mathematically impossible, $50 XRP would require a fundamental transformation in access, liquidity, demand structure, and macro conditions—likely unfolding across multiple market cycles rather than a single bull run.
Market Cap Math at a Glance
| Supply Assumption | Implied Market Cap at $50 | Scale Reference |
| ~57B (circulating) | ~$2.85 trillion | Larger than any single crypto to date |
| ~100B (max supply) | ~$5 trillion | Approaches gold market cap territory |
| ~45B (liquid float est.) | ~$2.25 trillion | Still exceeds current total crypto market cap |
Scenario Summary
| Scenario | Description | Assessment |
| Base Case | Current constraints dominate; limited access expansion | $50 is unlikely within a single cycle |
| Bull Case | Strong cycle + broad access + sustained demand catalysts | $50 enters the realm of possibility over multiple cycles |
| Tail Case | Monetary regime shift / nominal price inflation | $50 possible in nominal terms under extraordinary macro change |
Explore the XRP Target Ladder: $10 | $27 | $50 (you are here) | $100 | $400 | $500 | $1,000 | $10,000
Quick Answer — Is $50 XRP Realistic?
Feasibility Summary (Math-First)
The simplest feasibility test for any price target is market cap math: multiply the target price by the number of tokens in existence. For XRP at $50, the numbers are substantial. Using the current circulating supply of approximately 57 billion XRP, the implied market cap would be roughly $2.85 trillion. If you use the maximum supply of 100 billion XRP, the implied market cap rises to $5 trillion.
To put those figures into context, the entire cryptocurrency market capitalization has historically peaked at roughly $3–4 trillion. Gold, the world’s most established store of value, carries a market cap in the range of $17–34 trillion depending on the gold price. A $2.85 trillion XRP would represent a single digital asset holding a market cap that has only ever been achieved by a handful of individual assets in history, including Apple, Microsoft, and Nvidia at their respective peaks.
This does not make $50 impossible—it makes it a high-end, multi-cycle scenario that requires a very specific set of conditions. It is not a baseline expectation, and any framework treating it as such would be analytically unsound.
Top 5 Conditions That Must Be True
1. Broad access expansion. Regulated investment products (such as an XRP ETF), institutional custody solutions, and exchange listings across global markets must expand the pool of potential buyers significantly beyond the current participant base.
2. Durable regulatory and legal clarity. The SEC lawsuit and legal developments must reach a definitive, market-favorable resolution. Regulatory classification and compliance frameworks need to be clear enough that institutional capital can enter without material legal risk.
3. Deep, sustained liquidity. Spot order book depth, derivatives open interest, and cross-exchange arbitrage infrastructure all need to mature to levels capable of supporting a multi-trillion-dollar market cap without extreme volatility or thin-market dynamics. Learn more about XRP sentiment and liquidity metrics.
4. Strong demand catalysts sustained across cycles. A single narrative (payments adoption, ETF approval, or speculative momentum) is unlikely to be sufficient alone. The XRP price drivers and catalysts would need to compound: growing real-world usage, token demand, and capital market integration over multiple years.
5. Favorable macro environment. Prolonged risk-on macro regimes, loose monetary policy, and broad capital allocation toward digital assets would need to persist or recur. A sustained risk-off environment or rising real rates could delay or invalidate the path.
Market Cap Math for XRP at $50
Formula and Definitions
Market cap is a straightforward calculation: Market Cap = Price × Supply. However, which supply figure you use changes the result meaningfully.
Circulating supply refers to the tokens currently available for trading and held in wallets outside escrow—approximately 57 billion XRP as of early 2026. Max supply is the hard cap of 100 billion XRP created at the XRP Ledger’s inception, of which a significant portion remains in Ripple’s escrow (released at up to 1 billion per month, with unused portions re-escrowed). Liquid float is an estimate of supply that is actively available for sale at any given time, often substantially less than circulating supply because many holders are long-term and do not actively trade.
Implied Market Cap Under Different Supply Assumptions
| Supply Assumption | Implied Market Cap at $50 | Scale Comparison Note |
| ~45B (liquid float estimate) | ~$2.25 trillion | Comparable to the peak market cap of the largest individual companies (Apple, Nvidia) |
| ~57B (circulating supply) | ~$2.85 trillion | Larger than Bitcoin’s peak market cap; roughly equivalent to the entire crypto market cap in prior cycle peaks |
| ~75B (mid-range escrow release) | ~$3.75 trillion | Exceeds the total crypto market cap peak; approaching 10–15% of gold’s total market cap |
| ~100B (max supply) | ~$5 trillion | Comparable to the upper range of individual sovereign bond markets; roughly 15–20% of gold’s market cap |
Scale Comparisons: Largest Asset Classes and Crypto Benchmarks
Conceptual scale reference points help illustrate the magnitude of XRP at $50. Gold’s total above-ground market cap is estimated at roughly $30–34 trillion. The total U.S. stock market capitalization is approximately $55–60 trillion. The entire cryptocurrency market cap has oscillated between roughly $1 trillion and $3.5 trillion across cycle peaks and troughs. Even using the most conservative supply assumption (liquid float), XRP at $50 would need to achieve a valuation comparable to the most valuable single companies in the world.
For a detailed breakdown of how our models work, see the XRP price prediction methodology page.
Constraints Beyond Market Cap
Liquidity vs. Market Cap: Depth, Slippage, and Spreads
Market cap is an output—it tells you what the market values an asset at, but not how easy it is to actually trade at that valuation. Liquidity is the functional constraint. An asset with a high market cap but thin order books can experience severe slippage on even moderate-sized trades, meaning the “price” may not reflect what a real buyer or seller can transact at.
For XRP to sustain a $50 price, the order book depth across major exchanges, the bid-ask spreads, and the derivatives infrastructure (futures, options, perpetual swaps) would all need to deepen enormously. Today, even at current price levels, large institutional-sized orders can move the market. At $50, the scale of depth required increases proportionally.
Capital Flows Required (Order-of-Magnitude) and Time Horizon
There is no single “inflow number” that directly translates to a specific price target, because price is determined at the margin—by the last trade—not by the total capital invested. However, rough order-of-magnitude estimates are useful for sense-checking.
If XRP were to move from its current price range to $50 over a period of 10–30+ years, the required net inflow would depend heavily on liquidity conditions, available float, and how much supply is actively for sale. The flow math table below provides sensitivity estimates across different assumptions.
| Time Horizon | Net Inflow Required (Range) | Liquidity Assumption | Commentary |
| 10 years | $500B–$2T+ cumulative | Moderate depth growth | Requires aggressive capital acceleration; very high difficulty |
| 20 years | $300B–$1.5T+ cumulative | Deepening liquidity + compounding | More feasible if sustained access expansion and macro tailwinds persist |
| 30+ years | $200B–$1T+ cumulative | Mature, deep markets | Longest horizon reduces per-year burden; inflation and nominal growth contribute |
Supply Float, Distribution, and the ‘Who Sells’ Problem
Not all circulating supply is actively for sale. Long-term holders, institutional lockups, lost wallets, and strategically held reserves reduce the effective float. As price rises, some holders sell (taking profit), but others hold more tightly (anticipating further gains). This dynamic means that the “who sells” problem becomes increasingly important at higher targets: if too many holders attempt to realize gains simultaneously, selling pressure can cap the price well below theoretical targets.
Ripple’s escrow releases also factor in. Even though unused portions are re-escrowed, the monthly release mechanism creates a predictable source of potential sell pressure. The market’s ability to absorb this supply at higher prices is a key constraint. For more on XRP’s fundamental structure, see the XRP fundamentals analysis.
What Would Need to Happen for XRP to Reach $50
Access Expansion: Regulated Products, Custody, and Institutional Rails
One of the most significant constraints on any cryptocurrency’s price ceiling is who can buy it. Currently, XRP is accessible primarily through cryptocurrency exchanges, with varying regulatory status across jurisdictions. For $50 to be achievable, access would need to expand dramatically.
Regulated investment vehicles—most notably a spot XRP ETF—would open the asset to retirement accounts, institutional mandates, and retail brokerage platforms. Institutional-grade custody solutions (meeting regulatory requirements for asset segregation, insurance, and audit) would reduce risk for large allocators. The expansion of XRP trading pairs, fiat on-ramps, and integration into banking platforms would broaden the potential buyer base.
Regulatory Clarity and Legal Outcomes
Regulatory uncertainty has been a significant headwind for XRP. The outcome of Ripple’s SEC lawsuit and broader legal classification directly affects institutional willingness to allocate. A definitively favorable legal outcome—where XRP is clearly classified and compliant—removes a major barrier. Conversely, adverse rulings or ongoing ambiguity could suppress demand indefinitely.
Sustained Demand Catalysts: Adoption Narratives and Macro Liquidity
Demand for XRP at the scale implied by $50 cannot rely on a single catalyst. Payments adoption via RippleNet or the broader XRP Ledger ecosystem contributes, but the price impact depends on whether that usage requires holding XRP (structural demand) versus transient bridge usage (which has limited price impact). Speculative demand from retail and institutional investors, driven by narrative momentum and macro liquidity cycles, has historically been the primary driver of large crypto price moves.
For $50, you would likely need a compounding effect: growing utility-based demand layered on top of investment demand, reinforced by access expansion and favorable macro conditions. Review the full XRP price drivers and catalysts analysis for a detailed breakdown.
Market Structure Upgrades: Spot Depth, Derivatives Maturity
Market microstructure matters. For XRP to sustain $50, the market would need significantly deeper spot order books, tighter spreads, mature derivatives markets (futures, options, perpetual swaps with sufficient open interest), and robust cross-exchange arbitrage. Thin markets at high prices are fragile—they can produce brief price spikes but not sustained valuations. Learn more about market structure dynamics in our XRP technical analysis hub.
Preconditions Checklist
| Condition | Why It Matters | Observable Proxy Metric | Threshold | Notes |
| Spot XRP ETF approval | Expands buyer base to traditional finance | ETF filing status; AUM post-launch | Approval + $5B+ AUM within 12 months | Watch SEC/CFTC filings; compare to BTC ETF trajectory |
| Definitive legal clarity | Removes institutional risk overhang | Court rulings; regulatory guidance | No pending enforcement actions | Partial clarity still leaves residual risk |
| Deep spot liquidity | Sustains price without extreme slippage | 2% order book depth across top exchanges | 10x–100x current levels | Measured across multiple trading pairs |
| Mature derivatives market | Enables hedging and institutional strategies | Options OI; futures OI; funding rates | Options OI > $10B; stable funding | Derivatives maturity signals institutional participation |
| Sustained usage growth | Creates structural demand beyond speculation | On-ledger transactions; active addresses; partner integrations | Sustained growth over multiple quarters | Transient spikes insufficient; look for trend |
Scenarios for XRP to Reach $50
Base Case: Constraints Dominate
In the base case, current constraints persist: limited access expansion, ongoing regulatory ambiguity, moderate liquidity growth, and cyclical (rather than structural) demand. Under these conditions, XRP may continue to participate in crypto market cycles, potentially reaching higher price levels than its previous all-time high, but $50 remains outside the realistic range. The base case does not imply that XRP cannot appreciate—it implies that the specific scale required for $50 is not achievable without the structural changes described above.
Bull Case: Strong Cycle + Access + Sustained Demand
The bull case requires multiple tailwinds converging: a strong crypto market cycle, successful access expansion (ETF approval, broad institutional custody), favorable legal outcomes, and sustained demand catalysts that persist beyond a single cycle peak. In this scenario, XRP could plausibly achieve a multi-hundred-billion-dollar market cap in a single cycle, and if the structural improvements carry across cycles, $50 enters the outer boundary of possibility over a 10–20+ year horizon. This is not a prediction—it is a description of the conditions under which $50 becomes a non-trivial probability rather than a negligible one.
Tail Case: Monetary Regime Shift / Nominal Price Inflation
In a tail scenario, the path to $50 is driven less by XRP-specific fundamentals and more by macro-level changes: significant currency debasement, a structural shift in the global monetary regime (e.g., accelerated de-dollarization, broad adoption of digital assets as reserve instruments), or sustained high inflation that inflates nominal asset prices across the board. In this context, $50 in nominal terms may represent less purchasing power than it does today, and the “real” value of the target is lower. Tail scenarios are low-probability by definition but should not be dismissed entirely, as macro regime changes have occurred historically.
Unit Bias and Denomination Framing
It is worth noting that $50 per XRP feels intuitively “reasonable” to many retail investors because it is a round number below the price of many large-cap stocks. This is a cognitive bias known as unit bias—the tendency to evaluate price targets based on per-unit price rather than market cap. A $50 XRP is not comparable to a $50 stock, because XRP has approximately 57 billion units in circulation versus the millions or low billions of shares typical of public companies. Always evaluate targets using market cap math, not unit price alone. For a consistent framework across price levels, visit the XRP price targets hub.
Sensitivity Tables (Assumptions)
Supply Sensitivity: Circulating vs. Max vs. Float
| Supply Assumption | Tokens Used | Market Cap at $50 | Feasibility Note |
| Liquid float (conservative) | ~45 billion | $2.25 trillion | Most aggressive bull-case framing; still enormous |
| Circulating supply | ~57 billion | $2.85 trillion | Standard metric; requires multi-cycle catalysts |
| Mid escrow release | ~75 billion | $3.75 trillion | Accounts for partial escrow release over time |
| Max supply | 100 billion | $5 trillion | Full dilution; longest-horizon scenario |
Time Horizon Sensitivity: 10-Year / 20-Year / 30+ Year
| Horizon | Scenario Path | Key Drivers | Assessment |
| 10 years | Aggressive bull case; requires rapid access expansion + strong cycles | ETF + legal clarity + macro tailwinds within 2–3 years; compounding over 2–3 cycles | Very high difficulty; possible only with rapid structural change |
| 20 years | Sustained bull case; allows for setbacks and recovery | Gradual deepening of access + liquidity; multiple complete cycles | Lower per-year growth rate required; more plausible if catalysts materialize |
| 30+ years | Long-term structural change + nominal inflation contributions | Broad digital-asset integration into global finance; potential monetary regime effects | Longest horizon; nominal price inflation may contribute significantly |
What to Watch: Milestones and Metrics
Legal and ETF Milestones
The two most impactful near-term catalysts for XRP’s long-term price trajectory are legal resolution and ETF approval. Monitor the status of Ripple’s SEC case, any new regulatory guidance on digital asset classification, and the progress of XRP ETF applications through the SEC review process. Each milestone has a measurable impact on scenario probabilities: favorable legal resolution upgrades the bull case; ETF approval opens new capital pools. Track developments via our XRP ETF analysis and XRP legal and SEC updates.
Liquidity Metrics: Depth, Spreads, Open Interest, and Funding
Liquidity metrics are leading indicators of market maturity. Watch for changes in order book depth (measured as the total value within 2% of the mid price across major exchanges), bid-ask spreads on large pairs (especially XRP/USD and XRP/USDT), derivatives open interest (futures and options), and funding rates on perpetual swaps. Sustained deepening of these metrics signals that the market infrastructure is growing toward the capacity needed to support higher valuations.
Adoption Proxies: Usage, Partners, and Volume Narratives
Adoption metrics help distinguish between speculative price action and structural demand growth. Monitor on-ledger transaction volume (not just exchange trading volume), the number of active addresses, new partnership announcements and integrations, and the growth of applications built on the XRP Ledger. Adoption alone is unlikely to drive XRP to $50, but growing adoption strengthens the fundamental case and increases the probability that investment demand is sustained across cycles.
Trigger Map
| Trigger | Metric | Threshold | Scenario Weight Change |
| Spot XRP ETF approval | SEC filing status | Approved + launched | Bull case probability increases significantly |
| SEC case full resolution | Court ruling / settlement | No ongoing enforcement risk | Removes overhang; upgrades all scenarios |
| 10x spot liquidity growth | 2% depth across top exchanges | $500M+ within 2% of mid | Reduces slippage constraint; supports higher sustained prices |
| Sustained on-ledger growth | Daily transactions; active addresses | Growing trend over 4+ quarters | Strengthens fundamental case; increases cycle carry-through |
| Adverse legal ruling | Court/regulatory action | Unfavorable classification or penalty | Bull and tail case probability decrease; base case reinforced |
| Prolonged risk-off macro | Global equity drawdown; crypto winter | Multi-year bear market | Delays all scenarios; extends time horizon |
Frequently Asked Questions
What market cap would XRP need to reach $50?
Market cap is price × supply. At $50, approximately 57 billion circulating XRP implies about $2.85 trillion; 100 billion (max supply) implies about $5 trillion. The exact number depends on whether you use circulating supply, max supply, or a smaller liquid-float assumption.
Is $50 XRP possible with the current supply?
It is possible only as a high-end scenario, not a baseline expectation. The implied scale is enormous, so you would need broad access, deep liquidity, strong catalysts, and sustained demand across multiple cycles.
Does XRP price depend more on market cap or liquidity?
Liquidity and marginal buying pressure move price; market cap is an output (price × supply). For high targets, market depth, spreads, and available float matter more than the headline market cap number.
How much money would need to flow into XRP to reach $50?
There is not a single inflow number because it depends on liquidity depth and how much supply is actually for sale. The right approach is a sensitivity table: estimate net inflow over 10–30+ years under different depth and float assumptions.
Could an XRP ETF make $50 XRP more realistic?
An ETF can expand access and participation and may increase liquidity. That can raise bull-case probabilities, but $50 still requires broader conditions: macro liquidity, sustained demand, and a favorable legal and regulatory environment.
Would payments adoption be enough for $50 XRP?
Payments adoption can increase utilization, but price impact depends on value accrual and whether demand requires holding XRP versus transient usage. For $50, adoption would need to be massive and paired with structural demand and deep capital markets access.
What would prevent XRP from reaching $50?
Prolonged risk-off regimes, adverse regulatory or legal outcomes, insufficient liquidity growth, and repeated failures to convert key resistances into support can block the path. Use both catalyst and market-structure invalidation rules when assessing probability.
How long could it take for XRP to reach $50?
Time depends on the scenario path. Cycle-driven upside can occur faster, but targets of this scale typically require multiple cycles plus structural improvements. Provide short, medium, and long horizon ranges rather than a single date.
What milestones would increase the probability of $50 XRP?
Watch for measurable shifts: durable legal clarity, broader investor access (ETF approval), deep spot liquidity, mature derivatives, and sustained usage growth. Map each milestone to proxy metrics and thresholds that upgrade scenario weight.
Which XRP targets are easier or harder than $50?
Easier targets are closer (e.g., $10 or $27) and require less scale; harder targets ($100, $400, $500, $1,000) require dramatically larger market caps and stronger conditions. Use the target ladder module to compare consistently.
Methodology and Assumptions (Disclosure)
This analysis uses a math-first framework: implied market cap calculations based on publicly available supply data, combined with scenario-based reasoning about the conditions required to achieve the target. Supply figures are sourced from CoinMarketCap, CoinGecko, and XRPL data as of early 2026. Scale comparisons reference publicly available market cap estimates for gold, equities, and cryptocurrency markets.
This content is educational and does not constitute financial advice. Price targets are analytical constructs used to evaluate feasibility, not predictions of future outcomes. Always conduct your own research and consult a qualified financial advisor before making investment decisions. For the full methodology, visit the XRP price prediction methodology hub.
Last updated: February 2026. Supply figures, market conditions, and scenario assessments are reviewed and updated periodically.
Continue the Target Ladder
Use the target ladder below to explore how the feasibility math changes at each price level. Every target on the ladder uses the same analytical framework—market cap math, scenario conditions, and sensitivity analysis—so you can compare consistently across levels.
| Target | Implied Market Cap (~57B supply) | Difficulty | Link |
| $10 | ~$570 billion | Moderate — achievable within a strong cycle | Can XRP reach $10? |
| $27 | ~$1.54 trillion | High — requires access expansion + strong catalysts | Can XRP reach $27? |
| $50 | ~$2.85 trillion | Very high — multi-cycle + structural change | You are here |
| $100 | ~$5.7 trillion | Extreme — approaches gold-scale valuation | Can XRP reach $100? |
| $400 | ~$22.8 trillion | Extreme — exceeds most individual asset classes | Can XRP reach $400? |
| $500 | ~$28.5 trillion | Extreme — comparable to gold market cap | Can XRP reach $500? |
| $1,000 | ~$57 trillion | Near-impossible — exceeds U.S. stock market | Can XRP reach $1,000? |
| $10,000 | ~$570 trillion | Theoretical only — exceeds global GDP | Can XRP reach $10,000? |
For the complete price prediction framework, visit the XRP price prediction pillar page.

Steve Gregory is a lawyer in the United States who specializes in licensing for cryptocurrency companies and products. Steve began his career as an attorney in 2015 but made the switch to working in cryptocurrency full time shortly after joining the original team at Gemini Trust Company, an early cryptocurrency exchange based in New York City. Steve then joined CEX.io and was able to launch their regulated US-based cryptocurrency. Steve then went on to become the CEO at currency.com when he ran for four years and was able to lead currency.com to being fully acquired in 2025.