A Doji candlestick is one of the most powerful signals you can find on a chart, and it tells a simple but crucial story: market indecision. It pops up when an asset's opening and closing prices for a session are nearly identical.
Think of it as a perfectly balanced tug-of-war. The buyers and sellers fought hard all session, but in the end, neither side could claim victory. This stalemate is what creates the Doji's unique shape, and for a trader, it’s a sign to pay close attention.
Deciphering the Doji: A Symbol of Indecision
Imagine a wild trading day. Buyers shove the price way up, only for sellers to slam it back down. Despite all that frantic action, the price settles right back where it started. That’s a Doji in a nutshell.
Its most obvious feature is its tiny or nonexistent body, making it look more like a simple cross or a plus sign than a typical candlestick. That distinctive shape tells you everything you need to know. The long vertical lines (the wicks or shadows) show the full price range of the session—the highest high and the lowest low. The tiny horizontal line, which is the body, shows that the open and close were basically the same.
The market simply couldn't make up its mind.
The Doji is a cornerstone pattern in technical analysis because its meaning depends entirely on where it appears:
- After a strong uptrend: A Doji can signal that the bulls are running out of steam and sellers are starting to push back.
- During a downtrend: It might suggest that sellers are losing their grip, and buyers are finally stepping in to stop the bleeding.
- In a sideways market: It often just confirms the obvious—that there's no clear trend and the market is still waiting for a direction.
Let's break down exactly what each part of the Doji candlestick represents.
Quick Guide to Doji Candlestick Anatomy
The table below breaks down the visual components of a Doji and what each part signifies for traders trying to read the market's mood.
| Component | Appearance | Market Implication |
|---|---|---|
| Body | A very thin horizontal line. | Shows the open and close prices were almost identical, signaling indecision. |
| Upper Wick | The vertical line above the body. | Represents the session's high, showing how far buyers managed to push the price up. |
| Lower Wick | The vertical line below the body. | Represents the session's low, showing how far sellers dragged the price down. |
At its core, the Doji’s anatomy paints a picture of a market in perfect, but often temporary, balance.
"The primary meaning of a Doji is an interim pause or equilibrium in the existing battle of supply and demand. A trader may reference a Doji to indicate that buyers (bulls) and sellers (bears) are relatively even in significance to one another."
This pattern isn’t some new-age invention; it has deep roots in the Japanese rice trading techniques developed centuries ago. It has since become a globally recognized symbol of a market at a crossroads. The core idea is timeless: a Doji signals a delicate equilibrium between buying and selling pressure, often acting as a warning that a shift in direction could be just around the corner.
Getting a solid grasp on this concept is your first step toward mastering more advanced charting techniques. Once you start spotting these moments of indecision, you'll be far better equipped to anticipate what the market might do next. To build on this foundation, check out the resources at the vTrader Academy and sharpen your trading skills.
Exploring the Main Types of Doji Patterns
While every Doji signals a market pause, the real story is in the details. Think of it like reading body language—a shrug can mean "I don't know," but a shrug with raised eyebrows tells you a bit more. The same goes for Doji candles. The length and placement of their wicks reveal the subtle power dynamics between buyers and sellers during a trading session.
Learning to spot the differences between the main Doji patterns gives you a much sharper insight into what the market is thinking and where it might be headed next.
This infographic lays out the core idea behind a Doji, showing how that perfect balance between buyers and sellers creates the signature look of market indecision.
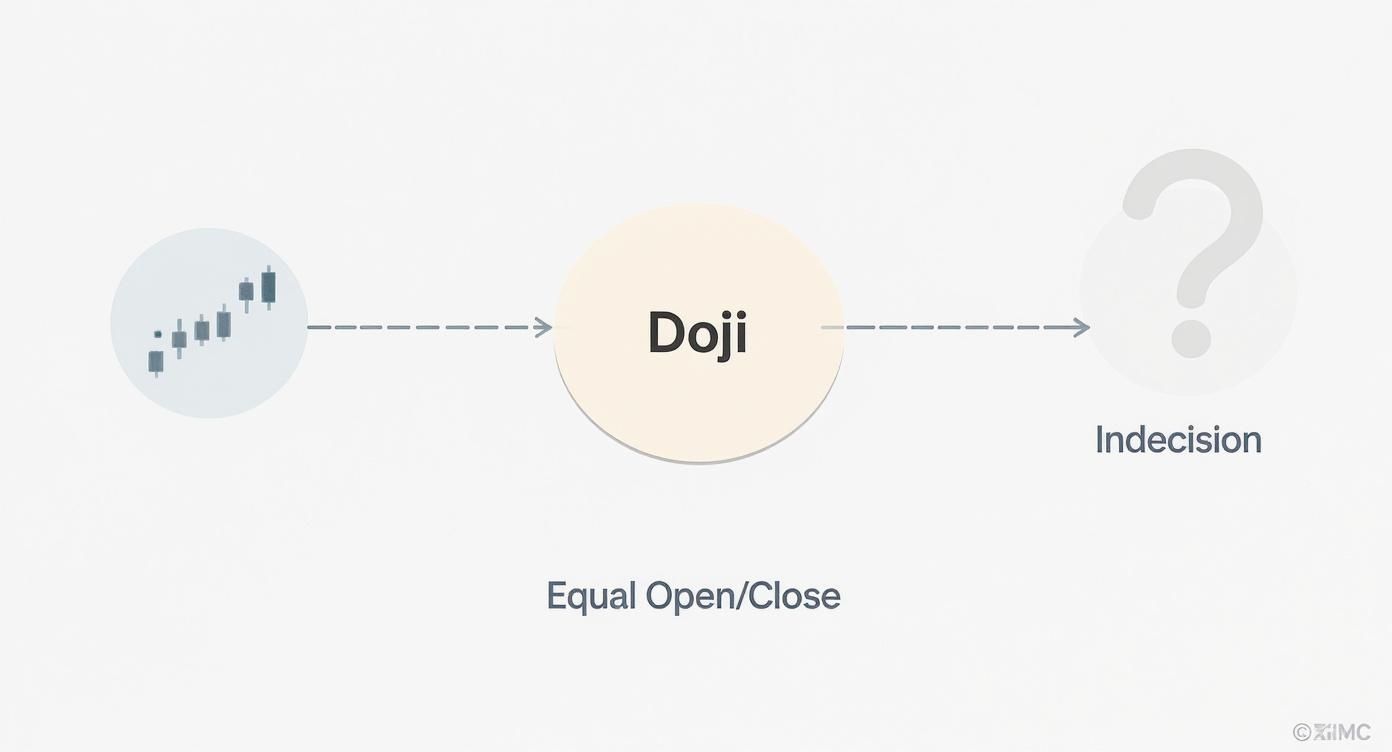
At its heart, a Doji is a visual cue that the market has hit the brakes. The open and close prices are the same because neither side could gain control, which is why traders pay such close attention.
The Standard and Long-Legged Doji
The most common version is the Standard Doji, which looks a lot like a plus sign (+). Its wicks are short, which tells you that volatility was pretty low. The fight between bulls and bears happened, but it was confined to a tight price range.
Then you have the Long-Legged Doji. This one is far more dramatic, with long upper and lower wicks. It shows that both buyers and sellers made aggressive moves—the price shot up, then plunged down—but ultimately, neither side could seal the deal. This is a sign of intense indecision and much higher volatility.
A Long-Legged Doji is a clear warning sign. The market took a wild ride but ended up right back where it started, lacking any real conviction. This kind of heightened uncertainty can often be the calm before a major price storm.
The Dragonfly and Gravestone Doji
These two are the real storytellers of the Doji family and are often seen as powerful reversal signals. They paint a clear picture of a failed takeover attempt by one side of the market.
-
Dragonfly Doji: Shaped like a "T," this pattern has a long lower wick and almost no upper wick. It shows that sellers were in complete control at the start, pushing the price way down. But then, the buyers came roaring back, driving the price all the way up to close right where it opened. It’s a classic sign that the market has strongly rejected lower prices and often signals a bullish reversal at the bottom of a downtrend.
-
Gravestone Doji: This is the mirror opposite—an inverted "T." Here, the buyers made the first move, pushing the price significantly higher. But they couldn't hold that ground. Sellers stepped in and hammered the price all the way back down to the session's low. This is a powerful rejection of higher prices and is widely considered a bearish reversal signal, especially when it appears at the top of an uptrend.
Getting familiar with these variations is crucial. A Dragonfly Doji isn't just indecision; it’s a bullish counter-attack that won. A Gravestone Doji shows a bearish defense holding strong. Recognizing which story the chart is telling you on a platform like vTrader is what separates a good guess from a smart trade.
The Psychology Behind a Doji Formation
To really get what a doji candlestick is showing you, you have to look past the chart itself and into the minds of the traders who created it. A Doji isn't just a pattern; it's a picture of market conflict, a story of a battle with no clear winner.
It’s the market holding its breath, and it’s captured in a single candle.
Imagine a coin is in a strong, confident uptrend. Buyers are firmly in charge, pushing the price higher and higher. Then, a Doji appears. This isn't just a brief pause—it’s a psychological crack in the bullish armor. The Doji tells you that the buyers' unwavering confidence is starting to shake. For the first time, sellers have put up enough of a fight to stop the advance cold.
This stalemate forces everyone to stop and rethink their positions.
The Power Shift in a Downtrend
Now, let's flip that scenario. An asset is stuck in a nasty downtrend. Sellers have been hammering the price lower, and the mood is bleak. When a Doji forms here, it tells a completely different story. It suggests the sellers are finally running out of gas.
Their momentum is fading, and they can no longer drive the price down with the same force.
This is the moment buyers have been waiting for. The Doji is their signal that the selling pressure is easing up, giving them the green light to step in and challenge the trend. It's where you can start to see the balance of power visibly shift.
The key takeaway is that a Doji is a warning light, not a guaranteed stop sign. It signals that the market's current momentum is weakening and tells smart traders to pay close attention to what happens next.
Interpreting the Tug-of-War
Understanding this market tug-of-war is what separates novice traders from experienced ones. A Doji doesn't predict the future, but it gives you a crystal-clear look into the market's current state of mind. It highlights a critical moment of indecision, where the very next candle carries far more weight than usual.
- A Bullish Standoff: In an uptrend, the Doji asks, "Are the bulls really strong enough to keep this going?" Their conviction is now being put to the test.
- A Bearish Pause: In a downtrend, it poses the question, "Have the sellers finally lost their grip?" This opens the door for a potential buyer takeover.
This psychological insight is exactly what makes the Doji so powerful. It's a signal to stop, look, and listen to what the market is telling you. Whether you're analyzing major cryptocurrencies or new altcoins, mastering the psychology behind this simple pattern can seriously sharpen your trading.
As you explore crypto markets on a platform like vTrader, learning to read these moments of hesitation is a key step toward spotting high-probability entry and exit points before everyone else does.
Confirming Doji Signals for Smarter Trades
Spotting a Doji on a chart is like hearing a sudden pause in a piece of music—it grabs your attention, but the real meaning comes from what happens next. Trading on a Doji alone is a high-risk gamble because it only signals indecision, not a guaranteed reversal. To turn this signal into a smart trade, you need to look for confirmation.
Confirmation is the art of gathering more evidence from the chart to back up your theory. It’s the difference between guessing and making a calculated move. Without it, you're pretty much flipping a coin every time you see a cross-shaped candle.
The Power of Context and Location
The first rule of confirmation is context. A Doji that pops up randomly in the middle of a choppy, sideways market doesn't mean much. But a Doji that forms at a critical technical level? That’s a completely different story.
Look for Doji patterns appearing at these key areas on your vTrader charts:
- Support Levels: A Dragonfly Doji hitting a known support zone is a powerful bullish signal. It shows that buyers stepped in and aggressively defended that price level.
- Resistance Levels: A Gravestone Doji at a resistance line signals that sellers slapped down higher prices, increasing the odds of a bearish move.
- Moving Averages: A Doji bouncing off a key moving average (like the 50-day or 200-day) adds a ton of weight to its potential as a reversal signal.
These levels are the battlegrounds where market sentiment is tested. A Doji appearing at one of these points is a huge clue that a major shift could be underway.
Using Volume and Indicators for Added Proof
Beyond location, you can use other tools to validate a Doji signal. Think of these as your backup detectives, each providing another clue to solve the market puzzle. One of the most reliable partners to a Doji is trading volume.
A Doji that forms on a day with unusually high trading volume is far more significant. It shows a massive tug-of-war took place between buyers and sellers, making the indecision a sign of a truly exhausted trend. Low volume, on the other hand, just suggests a weak and less meaningful pause.
The screenshot below shows a bullish Doji appearing at a support level on a vTrader chart, confirmed by a spike in volume and an oversold RSI reading.
This trifecta of signals makes a much stronger case for a potential bullish reversal than the Doji could ever make on its own.
Momentum indicators are also excellent for confirmation.
The Relative Strength Index (RSI) is particularly useful. When a Doji forms in an uptrend while the RSI is in "overbought" territory (typically above 70), it strengthens the case for a bearish reversal. Conversely, a Doji in a downtrend combined with an "oversold" RSI (below 30) is a strong bullish confirmation.
Statistical analysis backs this up. Trading simulations show that price changes following a Doji are more predictable when combined with other indicators. For example, a Dragonfly Doji on a major pair accompanied by oversold RSI conditions often precedes a significant move, highlighting why an integrated strategy is so effective.
Finally, the most direct confirmation comes from the very next candle. A strong bullish candle closing above the Doji's high confirms buyer control, while a bearish candle closing below its low confirms sellers have won. Always wait for that next move before jumping into a trade. Keeping up with market trends through resources like the vTrader news hub can also provide valuable context for your technical analysis.
Practical Trading Strategies Using the Doji
Knowing what a Doji is and why it forms is one thing. But turning that knowledge into a repeatable trading plan? That’s where the real work begins.
A solid strategy built around these patterns helps you sidestep emotional decisions and stop guessing your way through trades. Below, I’ll walk you through two clear frameworks—one for a bullish reversal and one for a bearish one—that you can adapt and use on platforms like vTrader.
Think of these as your playbook for entry points, stop-losses, and profit targets. It’s a solid foundation for trading Doji signals with confidence.
Strategy 1 The Bullish Reversal Plan
This plan is all about using a Dragonfly Doji to catch a potential bottom after a downtrend. The goal is simple: get into a long (buy) position just as the buyers start wrestling back control.
Here’s how you can break it down, step by step:
- Find the Right Context: Look for a clear, established downtrend. The magic happens when a Dragonfly Doji appears at or near a major support level. This isn't just a random candle; it's a signal that buyers are drawing a line in the sand and defending that price.
- Wait for Confirmation: This is crucial. Never jump in on the Doji alone. Patience is your friend here. Wait for the next candle to close. If it’s a strong bullish candle that closes above the Doji's high, that’s your confirmation. The buyers have spoken.
- Time Your Entry: Enter your long position as soon as that bullish confirmation candle closes.
- Set Your Stop-Loss: Place your stop-loss just below the low of the Dragonfly Doji’s long wick. This is your safety net, protecting you if the reversal fizzles out.
By waiting for confirmation at a key support level, you filter out a ton of false signals. The market tried to push lower, got rejected at a historically important price, and the next candle proved the bulls were ready to charge. That’s a powerful setup.
Strategy 2 The Bearish Reversal Plan
On the flip side, we can use a Gravestone Doji to spot a potential market top after a strong run-up. This sets the stage for a short (sell) position.
The approach is a mirror image of the bullish strategy:
- Find the Right Context: Look for a crypto asset in a solid uptrend. Your signal is a Gravestone Doji popping up at or near a significant resistance level. This tells you that sellers are stepping in and putting up a fight.
- Wait for Confirmation: Don't rush it. The confirmation you're looking for is a strong bearish candle that closes below the Doji’s low. This is the market telling you the sellers have taken over from the exhausted bulls.
- Time Your Entry: Go short as soon as that bearish confirmation candle closes.
- Set Your Stop-Loss: Place your stop-loss just above the high of the Gravestone Doji's long upper wick. This protects you from a sudden, unexpected continuation of the uptrend.
Market data actually shows that more than 60% of Doji patterns that form after strong trends lead to a noticeable shift in momentum within the next few trading sessions. This backs up the idea of waiting for confirmation—the price is more likely to follow the direction set by that next candle. You can dig deeper into this by reading expert insights on the power of the Doji candlestick.
To help you put this all together, here’s a quick checklist to run through before placing a trade.
Doji Trading Strategy Checklist
| Checklist Item | Bullish Reversal (e.g., Dragonfly Doji) | Bearish Reversal (e.g., Gravestone Doji) |
|---|---|---|
| Market Trend | Clear downtrend is in place | Clear uptrend is in place |
| Key Level | Doji forms at a known support level | Doji forms at a known resistance level |
| Doji Signal | A Dragonfly Doji appears | A Gravestone Doji appears |
| Confirmation | Next candle is bullish and closes above the Doji's high | Next candle is bearish and closes below the Doji's low |
| Entry Point | Enter a long position on the confirmation candle's close | Enter a short position on the confirmation candle's close |
| Stop-Loss | Place just below the Doji's wick low | Place just above the Doji's wick high |
This checklist is a simple but effective way to ensure all the conditions are met for a high-probability trade.
Applying these frameworks can bring much-needed structure to your trading, especially when dealing with volatile assets. For example, you could use these exact steps to analyze charts and refine your strategy based on our Bitcoin price prediction.
Common Questions About Trading Doji Patterns
Even seasoned traders have questions when a pattern as subtle as the Doji pops up on their charts. Getting these common points of confusion cleared up is key to building the confidence you need to act on the signals you see.
Let's dig into a few of the most frequent questions I hear from other traders.
Is a Doji the Same as a Spinning Top?
One of the most common mix-ups is confusing a Doji with a Spinning Top. At a glance, they look similar, and both point to market indecision. The crucial difference is in the body. A Spinning Top has a small but definite body, while a Doji’s body is just a razor-thin line.
A Doji is a perfect stalemate—the open and close are virtually identical. A Spinning Top shows indecision too, but one side eked out a tiny, meaningless win.
Think of a Doji as a moment of pure, intense equilibrium. The fight was a perfect draw.
Do Timeframes Affect a Doji's Meaning?
Absolutely. A Doji’s significance changes dramatically depending on the timeframe you're looking at. The short answer: bigger timeframes mean bigger signals.
- Higher Timeframes (Daily, Weekly): A Doji on these charts isn't just a pause; it's a major battle between bulls and bears that lasted for a whole day or week. When one appears here, it can signal a much more significant shift in the primary trend.
- Lower Timeframes (Hourly, 15-Minute): You’ll see Doji patterns far more often on shorter timeframes. Usually, they just represent minor breathers or market "noise" instead of major turning points.
This doesn't make them worthless on lower timeframes, but their power as a major reversal signal is much weaker. Always give more weight to Doji patterns that form on daily or weekly charts—those are the ones that tell a more compelling story.
If you have more questions, the vTrader FAQ section on our site is packed with answers on common trading concepts. You can find it at https://www.vtrader.io/en-us/faq.
Ultimately, a Doji is a signal to pay closer attention, not an automatic green light for a trade. It’s a moment of reflection in the market's story. By understanding its context—from the timeframe to how it differs from similar patterns—you can interpret its message far more accurately and filter out the noise.
Ready to put your knowledge into practice on a platform that puts you first? Join vTrader today and enjoy zero-fee trading on Bitcoin, Ethereum, and over 30 other cryptocurrencies. Access advanced tools, real-time data, and an integrated learning academy to sharpen your skills. Sign up now at https://www.vtrader.io and start trading smarter.

Steve Gregory is a lawyer in the United States who specializes in licensing for cryptocurrency companies and products. Steve began his career as an attorney in 2015 but made the switch to working in cryptocurrency full time shortly after joining the original team at Gemini Trust Company, an early cryptocurrency exchange based in New York City. Steve then joined CEX.io and was able to launch their regulated US-based cryptocurrency. Steve then went on to become the CEO at currency.com when he ran for four years and was able to lead currency.com to being fully acquired in 2025.