When you see a powerful bull flag pattern taking shape on a chart, it's often a sign that a strong uptrend is just taking a breather before its next big move. Think of it as the market catching its breath.
This pattern signals that the momentum from a sharp price surge is likely to continue after a brief, orderly pause.
Decoding the Bull Flag Pattern
Ever watch a sprinter in a 100-meter dash? They don't go flat-out for the entire race. There are moments of explosive power followed by brief periods of maintaining pace before that final push. A bull flag works the same way in the markets.
It's not a sign of weakness. It's a healthy pause, telling you that buyers are still in the driver's seat, just gearing up for the next leg higher.
This is a classic continuation pattern that shows up after a strong bullish run. That initial surge, known as the 'flagpole,' is caused by a wave of intense buying pressure. What follows is a consolidation phase—the 'flag'—which is just a temporary lull, not a reversal. If you're looking to dive deeper into chart patterns, you can explore more trading strategies at the vTrader Academy.
The Three Core Components
To really get a feel for a bull flag, you need to spot its three distinct parts. Each one tells a story about what traders are thinking and doing.
- The Flagpole: This is the first thing you'll see—a dramatic, almost vertical price spike. It’s the result of aggressive buying that forms the "pole" of the pattern.
- The Flag: After that big run-up, the price chills out and consolidates. It usually forms a small, downward-sloping rectangle or channel. This is the "flag," and it shows some light profit-taking, but not enough to kill the bullish vibe.
- The Breakout: This is the moment of truth. The price punches decisively through the top of the flag's resistance line, often with a surge in volume. This confirms the pause is over and the uptrend is back on.
A bull flag is basically a visual stamp of market confidence. The flagpole shows conviction, and the shallow pullback shows that sellers just don't have the strength to turn things around before buyers jump back in.
Here's a quick table to break down what each piece of the pattern really means.
Key Components of a Bull Flag Pattern
| Component | Description | Market Indication |
|---|---|---|
| Flagpole | A sudden, sharp price surge. | Strong, initial buying momentum. |
| Flag | A brief, downward-sloping consolidation period. | A healthy pause and profit-taking. |
| Breakout | Price moves above the flag's upper resistance. | Confirmation that the uptrend is likely to continue. |
Spotting these three components together is what gives you the full picture, turning a simple chart formation into a powerful signal for your next trade.
How to Spot a Bull Flag on a Live Chart
Moving from textbook diagrams to live charts is where the real skill comes in. Identifying a bull flag in the heat of the moment isn’t about finding a perfect picture; it’s about learning to see the pattern's DNA, even when it looks a little messy. The process boils down to spotting the structure, watching the volume, and waiting for confirmation.
First, you need to find the flagpole. This isn't some slow, grinding uptrend. It's a sharp, almost vertical price surge—an explosion of buying pressure that happens fast. A strong flagpole is the foundation of the entire setup and screams that there's powerful momentum behind the move.
After that initial burst, the market has to catch its breath. This is where the flag begins to form. You’re looking for a period of consolidation where the price drifts sideways or slightly down inside a tight, rectangular channel. The key is that this pullback is orderly and shallow. It shouldn't retrace more than 50% of the flagpole's height. This controlled pause shows that sellers just don't have the muscle to reverse the trend.
Confirming the Pattern with Volume
Volume is the truth-teller. Without the right volume signature, a potential bull flag loses a ton of its credibility. Think of volume as the market’s conviction—it tells you how much power is behind each price move.
Here’s the classic sequence you want to see:
- High Volume on the Flagpole: That initial price explosion should come with a big spike in trading volume. This confirms there’s real buyer interest driving the move.
- Decreasing Volume on the Flag: As the price consolidates into the flag, volume should dry up. This is a great sign. It suggests the selling pressure is weak and the pause is just temporary profit-taking, not a reversal.
- Explosive Volume on the Breakout: The second the price breaks above the flag's upper trendline, volume needs to surge again. This is your confirmation that buyers are back in charge and ready to push the price higher.
This progression tells a clear story of buyers taking a quick break before resuming their push.
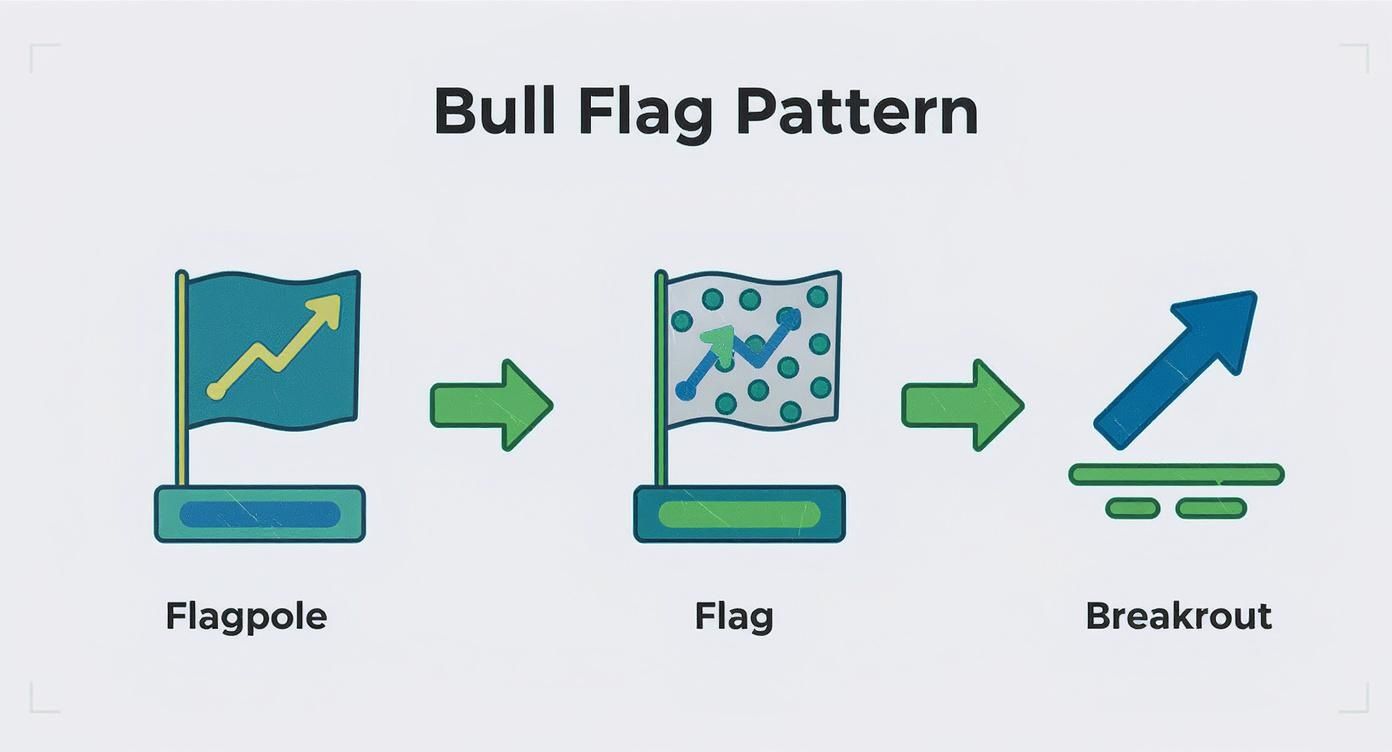
The infographic above breaks it down visually, showing the three key phases—flagpole, flag, and breakout—that make up a valid bull flag.
From Theory to Reality
Textbook patterns are always clean. Real charts? Not so much. You'll see flags that are slightly angled and flagpoles that aren't perfectly straight. Don't get hung up on perfection. Instead, focus on the psychology behind the pattern: a strong impulse move followed by a weak, low-volume consolidation.
It's also interesting to note that trading algorithms often play a role here, adding liquidity around these key levels. It’s not uncommon to see volume jump by 30% or more during the breakout compared to the quiet consolidation phase.
You’ll often find bull flags in high-beta stocks with volatility 20-40% above the market average, making them a common sight in assets with strong momentum. Staying on top of market trends helps you know where to look. You can keep up with what's moving by checking out the latest vTrader market news.
The Market Psychology Driving the Pattern
To really get what a bull flag is, you have to look past the lines on a chart and get inside the heads of the buyers and sellers. The pattern tells a story—a classic tug-of-war where one side has a clear upper hand.
The initial, powerful surge—the flagpole—is all about conviction. This is often kicked off by good news, a blowout earnings report, or just a sudden wave of bullish hype. Buyers pile in, creating a sharp spike in both price and volume. This demand is usually amplified by a healthy dose of FOMO (Fear Of Missing Out), as traders on the sidelines can't resist jumping in.
The Healthy Pause and Consolidation
Then comes the flag. After that explosive move up, some of the early birds decide it’s time to cash in their chips. This creates a bit of selling pressure, causing the price to drift sideways or dip slightly. This little breather is the most revealing part of the whole setup.
What's critical here is that the selling is never aggressive enough to wipe out much of the flagpole's gains. This lack of follow-through from sellers is a huge tell. It shows that the underlying bullish mood is still strong and that the sellers just don't have the muscle to turn the trend around.
The flag consolidation is like a stress test for the uptrend. It shakes out the nervous traders and absorbs the early profit-taking without breaking the market’s bullish structure, setting the stage for the next leg up.
The low trading volume during this phase backs up the story. It’s like the market is just taking a collective breath, with very few people willing to bet against the momentum.
The Breakout and Renewed Conviction
Finally, the breakout happens when the sideline buyers, who were patiently waiting for a small dip, see their opening. They read the consolidation as a sign of strength, not weakness. As they jump back into the market, their buying power easily overpowers the few sellers left.
This fresh wave of interest shoves the price decisively above the flag's upper trendline, usually with a big spike in volume to match. This is the final confirmation that the bulls have defended their turf and are ready to get the uptrend going again. Spotting these psychological shifts is a huge advantage, especially when you explore crypto markets where sentiment can flip on a dime.
A Practical Strategy for Trading Bull Flags

Spotting a bull flag on a chart is great, but that's only half the job. To actually make money from it, you need a concrete, rules-based plan. This means knowing exactly where you’ll get in, where you’ll cut your losses if you're wrong, and where you'll take profits before you even click the buy button.
This is how you turn a simple pattern into a repeatable trading setup. Let’s walk through how to manage a bull flag trade from start to finish.
Pinpointing Your Entry Point
The classic entry signal for a bull flag is the breakout. This is the moment the price pushes through and closes above the upper trendline of the flag. And that word "closes" is critical—don't jump the gun on a price that just pokes its head above the line for a second.
That brief spike could be a "false breakout," a classic trap for impatient traders. Waiting for the candle to actually close above that resistance line is your confirmation that the buyers might have enough steam to keep going.
Another thing to watch for is a significant surge in trading volume right as the breakout happens. Think of it as proof. A breakout on wimpy volume is a huge red flag; it suggests there isn't real conviction behind the move. Strong volume, on the other hand, tells you that a crowd of buyers is rushing in, giving the trade a much better chance of success.
Setting Your Stop-Loss for Risk Management
No pattern works 100% of the time, and bull flags can and do fail. A failed pattern is when the price breaks down below the flag's lower support line instead of popping to the upside. To make sure one bad trade doesn't blow up your account, you absolutely must use a stop-loss order.
A logical spot to place your stop-loss is just below the lowest low of the flag itself. This position does two things perfectly:
- It invalidates the trade idea. If the price drops that far, the bull flag pattern is officially broken. Your reason for entering the trade is gone, so you should be too.
- It defines your exact risk. The distance between your entry and your stop-loss tells you precisely how much money you stand to lose, which is essential for managing your position size correctly.
Setting a stop-loss isn't optional. It's your safety net. It's what keeps a single losing trade from becoming a catastrophic one.
Establishing Clear Profit Targets
So, you're in the trade, and it's moving in your favor. Now what? You need an exit plan. The most common way to set a profit target for a bull flag is using the "measured move" technique, which is tied directly to the size of the flagpole.
Here's the simple breakdown:
- Measure the Flagpole: Calculate the distance in price from the start of the big upward move (the bottom of the flagpole) to its very top.
- Project That Distance: Take that same distance and add it to your breakout entry price.
Let's say the flagpole was a $10 rally, and the price broke out of the flag at $110. You'd add that $10 flagpole measurement to your $110 entry, giving you a profit target of $120. This gives you a logical, data-driven target based on the initial momentum of the move.
Bull Flags Versus Bear Flags
To really get a feel for any chart pattern, you have to understand its opposite. For the bull flag, that’s the bear flag—a classic signal that a downtrend is likely to continue.
Telling these two apart is one of the most important skills a trader can develop. Getting it wrong can be a costly mistake.
A bull flag shows up during a powerful uptrend, while a bear flag forms in the middle of a steep decline. They’re like twins with opposite personalities. One is climbing a mountain, pauses to catch its breath, and then keeps going up. The other is tumbling down a hill, pauses for a moment, and then continues its slide.
The real difference is in their structure and what they’re telling you. The bull flag kicks off with an upward "flagpole" followed by a downward-slanting "flag," which points to an eventual breakout to the upside. In contrast, the bear flag starts with a downward flagpole and has a flag that drifts up, signaling a probable breakdown.
Key Structural Differences
Once you know what to look for, the visual clues separating these two patterns become obvious. The direction of the initial powerful move and the angle of the consolidation that follows are your biggest tells.
A common mistake new traders make is misreading the consolidation. A bull flag’s flag should drift down, against the primary uptrend. A bear flag’s flag drifts up, against the primary downtrend.
This distinction is mission-critical, especially in volatile markets like crypto. When looking at charts for major coins, you’ll see both patterns play out constantly. You can see how these trends affect assets by tracking the live Bitcoin price on vTrader.
To make it even clearer, here’s a quick rundown of how these two continuation patterns stack up against each other.
Bull Flag vs. Bear Flag Comparison
The table below breaks down the key differences to help you quickly tell a bull flag from a bear flag.
| Characteristic | Bull Flag | Bear Flag |
|---|---|---|
| Preceding Trend | A strong uptrend (bullish) | A strong downtrend (bearish) |
| Flagpole | A sharp, explosive price surge upwards | A sharp, sudden price drop downwards |
| Flag Angle | Slopes down or moves sideways | Slopes up or moves sideways |
| Breakout Direction | To the upside, above resistance | To the downside, below support |
| Volume Signature | High on flagpole, low on flag, high on breakout | High on flagpole, low on flag, high on breakdown |
Having these characteristics locked in your memory will help you spot these patterns on a live chart and make a more informed decision instead of just guessing which way the price might go next.
Common Questions About the Bull Flag Pattern
Even when you feel you've got a handle on a pattern, questions always come up when you’re staring at a live chart. Let's run through some of the most common ones to iron out any confusion about the bull flag.
How Reliable Is This Pattern?
The bull flag is one of the more respected continuation patterns out there, with some analysts pointing to success rates north of 70%. This is especially true when a clean breakout is backed by a big spike in trading volume.
But let's be clear: no chart pattern is a magic bullet. Its reliability is directly tied to the bigger market picture. A bull flag forming in a monster uptrend is far more likely to work out than one that appears while the rest of the market looks weak.
For more answers to general trading questions, you can always check out our comprehensive FAQ section.
Key Takeaway: The bull flag has a solid track record, but it's not foolproof. Your best defense is always good risk management. Never, ever trade without a stop-loss.
What Is the Best Timeframe?
One of the great things about the bull flag is its versatility—it shows up on every timeframe imaginable, making it a favorite for all kinds of traders.
- Day Traders hunt for these on the 1-minute, 5-minute, or 15-minute charts, looking to scalp quick profits.
- Swing Traders are more likely to use the 4-hour, daily, or weekly charts to spot setups that could unfold over days or even weeks.
The structure of the flagpole, the consolidating flag, and the breakout are the same no matter what chart you're looking at. Just pick the timeframe that fits your personal trading style.
Can a Bull Flag Fail?
Absolutely. And you need to know what that looks like. A bull flag is considered a "failed pattern" the moment the price breaks down below the flag’s lower trendline instead of breaking out to the upside.
This is a huge red flag. It tells you the bulls have lost control and the sellers are stepping in. This is precisely why a stop-loss order placed just below the flag’s low is an absolute must.
Ready to put your knowledge into action? At vTrader, you can trade crypto with zero commission fees, advanced tools, and the security you need to trade with confidence. Start trading today.

Steve Gregory is a lawyer in the United States who specializes in licensing for cryptocurrency companies and products. Steve began his career as an attorney in 2015 but made the switch to working in cryptocurrency full time shortly after joining the original team at Gemini Trust Company, an early cryptocurrency exchange based in New York City. Steve then joined CEX.io and was able to launch their regulated US-based cryptocurrency. Steve then went on to become the CEO at currency.com when he ran for four years and was able to lead currency.com to being fully acquired in 2025.