Ever wondered how some traders seem to predict crypto price swings with uncanny accuracy? They’re not using a crystal ball. They're likely using technical analysis, a method of forecasting what’s next by looking at what’s already happened.
Instead of getting bogged down in whitepapers or a project's team drama, technical traders dive deep into charts and statistics. Think of it as learning the market's body language—every tick up or down is a piece of a larger story, and your job is to read it before the next chapter begins.
Decoding the Market's Language
At its heart, technical analysis in cryptocurrency works on a powerful, almost shockingly simple idea: the price you see on the screen already reflects everything.
That's right—every news headline, every regulatory whisper, every project update is already baked into the coin's current value. So, instead of asking why the price is moving, a technical analyst focuses only on how it's moving.
This approach is a lifesaver in the wild west of crypto, where solid fundamental data can be hard to come by. It provides a map for navigating a world often driven by pure speculation and social media hype, helping traders cut through the noise of FUD (Fear, Uncertainty, and Doubt).
The Three Pillars of Crypto TA
The entire discipline is built on three core beliefs. Get these down, and you're on your way to reading the charts like a pro.
- The Market Discounts Everything: This is the big one. It means any factor that could possibly move a crypto's price—from a developer’s tweet to a major tech breakthrough—is already reflected in its chart.
- Prices Move in Trends: Price movements aren't just random chaos. Analysts believe that once a trend gets going (whether it's up, down, or sideways), it's more likely to keep going than to suddenly flip. The name of the game is spotting these trends early.
- History Tends to Repeat Itself: Markets are driven by people, and people are driven by psychology—fear, greed, hope. These emotions don't change, which means the chart patterns they create often repeat over time. You can dig into this idea further over at Gemini.com.
By studying these recurring patterns, traders aim to get a statistical edge. They're not predicting the future with 100% certainty; they're anticipating the most likely outcomes based on how the market has behaved in the exact same situations before.
This transforms trading from a pure guessing game into a skill based on probability and managing your risk.
It's a repeatable process for pinpointing potential entry and exit points—an absolutely vital skill for surviving crypto's infamous volatility. If you're new to all this, don't worry. Building a strong foundation is key, and you might want to explore the VTrader Academy to sharpen your skills.
How to Read and Interpret Crypto Charts

Think of a crypto chart as a storybook of market psychology. Learning to read its language is the first real step into the world of technical analysis. Forget those simple line graphs from high school math—the tool of the trade here is the candlestick chart.
Each candlestick is a snapshot of a fierce battle between buyers (bulls) and sellers (bears) over a specific window of time. It’s not just a price point; it’s a detailed report from the trenches.
Anatomy of a Candlestick
A candlestick tells you everything you need to know with just two parts: the body and the wicks. The body is the thick, rectangular part showing where the price opened and closed. The wicks—those thin lines sticking out—reveal the highest and lowest prices hit during that period.
The color of the candle gives you the final verdict. A green candle means the price closed higher than it opened, a win for the bulls. A red candle signals the opposite: the price closed lower, and the bears took control.
A long, solid green body with tiny wicks screams strong buying pressure. It tells you the bulls were in command from start to finish. On the flip side, a long red body with short wicks is a clear sign of a seller’s market.
To truly understand what these charts are telling you, it helps to break down the key components.
Key Chart Components at a Glance
| Chart Component | What It Shows | Trader's Insight |
|---|---|---|
| Candlestick Body | The range between the opening and closing price. | A longer body signifies stronger momentum in that direction. |
| Wicks (Shadows) | The highest and lowest prices reached in the period. | Long wicks can indicate volatility and a potential reversal. |
| Candle Color | Whether the price closed higher (green) or lower (red) than the open. | Instantly shows whether buyers or sellers won the session. |
| Timeframe | The duration each candlestick represents (e.g., 1 minute, 1 day). | Determines the overall perspective, from short-term noise to long-term trends. |
| Volume | The amount of the asset traded during the period. | Confirms the strength of a price move. High volume adds conviction. |
Knowing these five elements is like having a decoder ring for the market's secret language. They are the building blocks for every single trading decision you'll make using technical analysis.
The Power of Timeframes
Technical analysis isn't a one-size-fits-all game. The story a chart tells can change completely depending on the timeframe you're looking at. Each candlestick might represent one minute, one hour, one day, or even a whole week.
- Lower Timeframes (e.g., 1-minute, 15-minute): This is the playground for day traders and scalpers. You get a microscopic view of the action, but it’s often filled with "noise" and false signals that can fake you out.
- Higher Timeframes (e.g., 4-hour, Daily, Weekly): Long-term investors and swing traders live here. These charts filter out the daily noise, revealing major trends and critical support or resistance levels that truly matter.
The right timeframe is all about your strategy. A smart approach is to use a higher timeframe to identify the main trend and then zoom in to a lower one to pinpoint the perfect moment to enter or exit a trade.
Understanding Trading Volume
Look below the main price chart, and you'll see a series of vertical bars. That's the trading volume indicator, and it’s one of the most powerful—and most overlooked—tools in a trader's arsenal. Each bar simply shows how much of a crypto was traded during that candle's time period.
Here’s why it’s a game-changer: volume confirms price action. A big price spike on massive volume is the real deal; it shows conviction and heavy participation. But a price that keeps inching up on dwindling volume? That’s a huge red flag that the trend is running out of steam.
By watching a live Bitcoin price chart, you can see this dance between price and volume play out in real time, giving you a massive edge.
Using Essential Crypto Trading Indicators

If charts tell a story, technical indicators are the special lenses you need to see the tiny details. Let's be clear: they aren't crystal balls. Think of them more like a mechanic's diagnostic tools—they translate raw price and volume data into insights you can actually use.
Indicators help you get answers to the big questions. Is the market trending or just chopping sideways? Is a coin running out of steam? Is volatility about to kick into high gear? By layering these tools onto your charts, you start to see the bigger picture, moving from just watching the price to really understanding market momentum and probabilities.
This is what separates methodical trading from a casino trip. Each indicator has a job to do, and learning how they work together is a cornerstone of effective technical analysis in cryptocurrency.
Identifying the Market's Direction with Trend Indicators
The first thing any trader needs to know is simple: "Which way is the market going?" Trend indicators cut through the chaotic price swings to show you the real underlying direction. The most fundamental tool for this job is the Moving Average (MA).
A Moving Average is just what it sounds like—it calculates the average price of a crypto over a specific period. A 50-day MA, for instance, shows the average closing price over the last 50 days. Plotted as a smooth, continuous line, it filters out the daily noise and makes the primary trend much easier to spot.
- Simple Moving Average (SMA): The basic version. It gives equal weight to all prices in the period, making it solid for identifying long-term trends.
- Exponential Moving Average (EMA): This one is a bit quicker on its feet. It gives more weight to recent prices, so it reacts faster to new information. Traders often favor EMAs to catch trend changes early.
When a coin is consistently trading above a key MA (like the 50-day or 200-day), that’s a big sign of an uptrend. If it's trading below, you're likely in a downtrend. Traders also watch for the "golden cross" (a shorter-term MA crossing above a longer-term one) as a classic bullish signal, while the "death cross" (the opposite) screams bearish sentiment.
Measuring Market Speed with Momentum Indicators
Okay, so you've found the trend. Now what? The next question is about its strength. Is this trend healthy, or is it getting tired and ready to reverse? This is where momentum indicators come in. They’re basically a speedometer for the market.
The king of momentum tools is the Relative Strength Index (RSI). The RSI is an oscillator that bounces between 0 and 100, measuring the speed and change of price movements to identify overbought and oversold conditions.
An RSI reading above 70 suggests a crypto might be overbought—meaning its price went up too far, too fast, and could be due for a pullback. A reading below 30 hints that it may be oversold and potentially a bargain.
But context is everything. In a screaming bull run, an asset can stay "overbought" for a long time. That’s why savvy traders hunt for divergence—when the price hits a new high, but the RSI makes a lower high. This bearish divergence can be a powerful early warning that the trend's momentum is fading, a crucial skill in cryptocurrency technical analysis.
Gauging Market Chop with Volatility Indicators
Volatility isn't just a feature of crypto; it is crypto. Volatility indicators don't tell you the direction, but they excel at showing you how choppy the waters are. One of the best tools for this is Bollinger Bands.
Bollinger Bands are made of three lines: a simple moving average in the middle, with an upper and lower band flanking it. These outer bands are set a standard deviation away from the middle MA line, creating a dynamic channel.
Here’s how to read them:
- Expanding Bands: When the bands get wider, volatility is picking up.
- Contracting Bands: When the bands squeeze together, it signals low volatility. This "squeeze" often happens right before a big price explosion, though it won't tell you which way it's going.
Traders often treat the bands like moving support and resistance levels. A price hitting the upper band might be seen as overextended, while a tap of the lower band could signal a buying opportunity. Just remember that high volatility can send transaction costs soaring; it’s always smart to keep an eye on network fees with a reliable ETH gas tracker during these wild periods.
The accuracy of all these indicators has gotten a massive boost thanks to better data. Institutional-grade platforms now offer deep historical and real-time market info, allowing for much sharper analysis. Since 2010, for instance, CoinDesk Data has tracked trade-level history for over 10,000 cryptocurrencies across more than 300 exchanges. This incredible depth of crypto market data from CoinDesk helps traders backtest their strategies with a much higher degree of confidence.
Recognizing High-Probability Chart Patterns
While indicators give you the hard numbers, chart patterns tell a story. They’re the footprints left behind by the market’s collective psychology—the visual proof of the constant tug-of-war between buyers and sellers. Learning to spot these recurring shapes can give you a massive edge in your crypto trading.
Think of it like a meteorologist recognizing cloud formations before a storm rolls in. Certain shapes pop up time and time again right before a major price move. Identifying them early is a cornerstone of technical analysis in cryptocurrency. We can break these down into two main camps, depending on what they’re signaling about the current trend.
Decoding Trend Reversal Patterns
Reversal patterns are your flashing warning lights. They signal that a trend is running out of gas and might be about to flip. Spotting one of these is like hearing a car’s engine sputter just before it stalls; it’s a clear sign that the market's momentum is fading.
A confirmed reversal can be the perfect time to either cash out of a profitable trade or jump into a new one going the other way.
Here are some of the most reliable ones to look for:
- Head and Shoulders: This classic bearish pattern looks exactly like its name. It forms with a peak (the left shoulder), a higher peak (the head), and then a lower peak (the right shoulder). A "neckline" connects the low points between them. When the price breaks below that neckline, it’s a strong signal the party’s over for the uptrend.
- Inverse Head and Shoulders: This is just the opposite—a bullish pattern that shows up at the bottom of a downtrend. It features three dips, with the middle one being the lowest (the head). A break above the neckline here suggests a new uptrend is just getting started.
- Double Top and Double Bottom: These are simpler but just as powerful. A Double Top looks like the letter "M." It happens when the price smacks into a resistance level twice and fails to break through, signaling a likely move down. A Double Bottom looks like a "W" and forms when the price bounces off a support level twice, hinting at a bullish reversal.
A pattern isn't real until it's confirmed. A common rookie mistake is acting before the price breaks a key level, like the neckline on a Head and Shoulders. Jumping the gun on a false signal is a quick way to lose money.
This infographic breaks down the core risk management concepts you have to nail when trading these patterns, from how much to risk to where you place your stops.
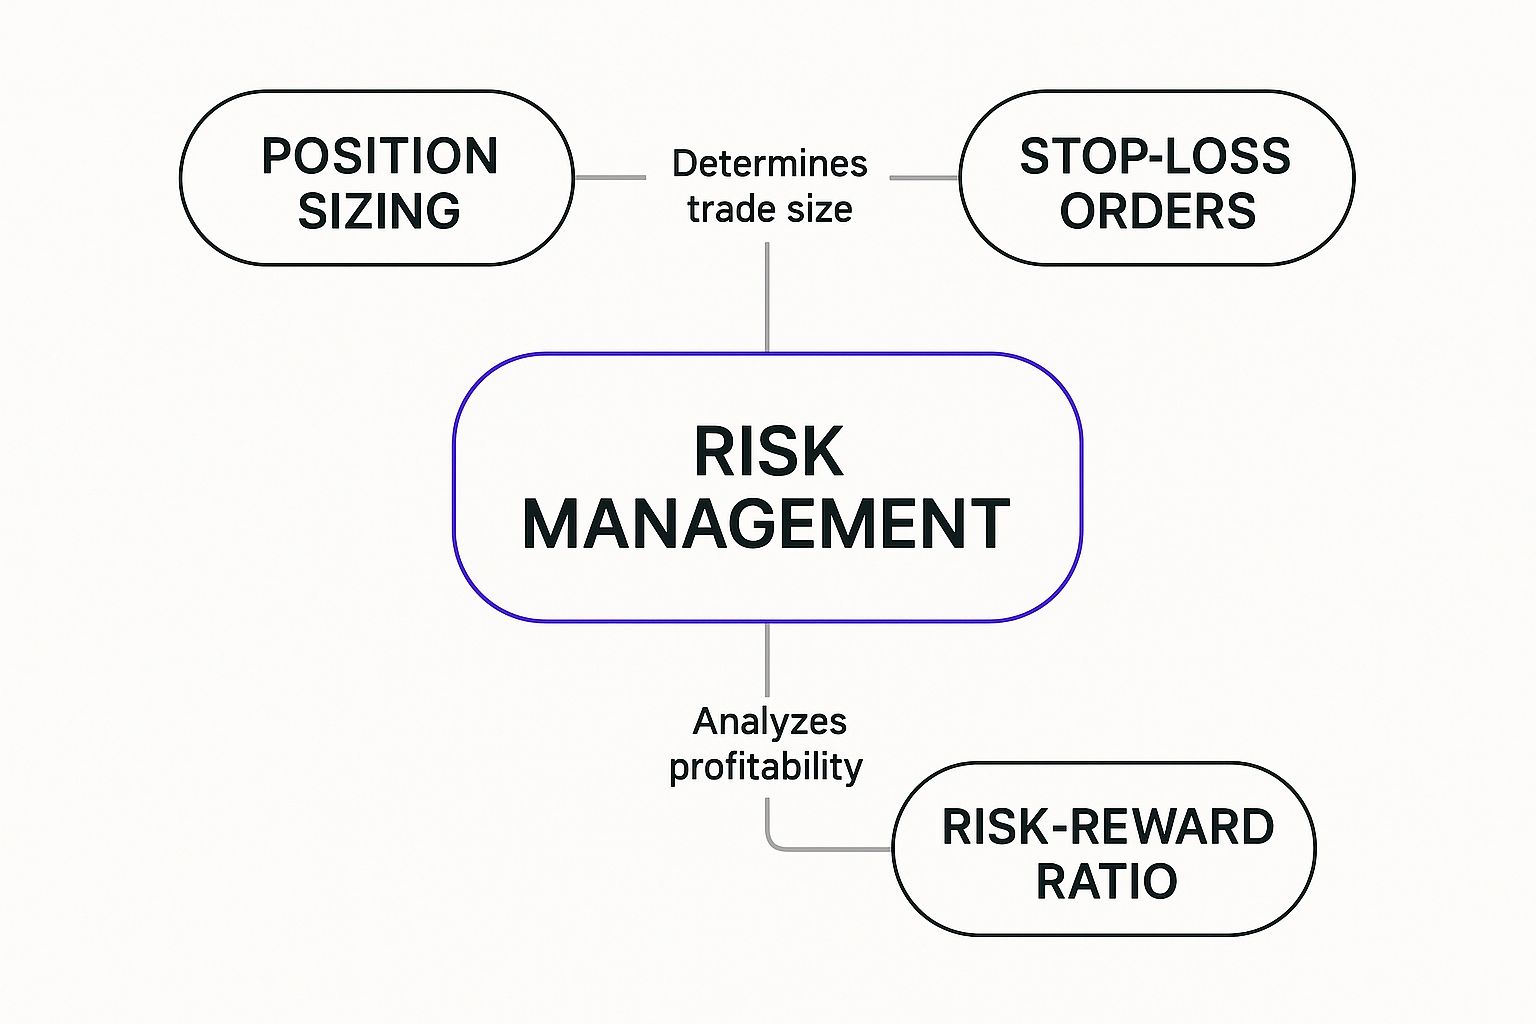
As you can see, a solid strategy ties together your position size, stop-loss, and risk-to-reward ratio. This ensures no single bad trade can wipe you out.
Identifying Trend Continuation Patterns
Not every pause in the action means the trend is over. Sometimes, the market just needs to catch its breath. That's where continuation patterns come in. These formations usually pop up in the middle of a strong trend and signal that the market is just consolidating before its next big move.
Spotting these helps you tell the difference between a temporary breather and a real trend change, stopping you from bailing on a great trade too early. They’re your green light that the original trend is still very much in play.
Keep an eye out for these common continuation patterns:
- Flags and Pennants: These are quick, short-term patterns that show up after a massive, flagpole-like price spike. Flags are little rectangular channels sloping against the trend, while Pennants are small, symmetrical triangles. A breakout from these in the direction of the main trend signals it's about to take off again.
- Triangles (Ascending, Descending, Symmetrical): These patterns form as the price action gets squeezed tighter and tighter. An Ascending Triangle has a flat top and a rising bottom, which usually breaks to the upside. A Descending Triangle has a flat bottom and a falling top, typically breaking downward. A Symmetrical Triangle, where both sides are closing in, can break either way but often continues the prior trend.
By combining the signals from both reversal and continuation patterns, you start to build a much clearer picture of what the market is thinking. This lets you make smarter decisions, whether you’re trying to protect your profits or jump on a brand-new trend.
Building Your First Crypto Trading Strategy

Knowing your way around charts, indicators, and patterns is one thing. But weaving them into a coherent, actionable plan? That’s where real trading begins. A trading strategy is your personal rulebook for the market—it tells you what to buy, when to buy, and when to get out.
Without one, you're just gambling.
This framework is what turns technical analysis from a collection of interesting observations into a systematic process for making decisions. It’s the structure you need to ride the crypto market’s notorious waves with discipline instead of emotion.
Define Your Trading Persona
Before you even glance at a chart, you need to look in the mirror. Are you a day trader chasing quick, small profits throughout the day, or are you a swing trader comfortable holding positions for days or even weeks? Your timeframe and personality will shape your entire approach.
Next up is your risk tolerance. How much of your capital are you truly willing to lose on a single trade? A solid rule of thumb is to never risk more than 1-2% of your total trading account. This single decision is the foundation of your entire risk management plan.
Select Your Technical Toolkit
Now it’s time to pick your tools. The trick is to choose indicators that complement each other, not ones that just tell you the same thing in a different way. Piling ten different momentum oscillators onto your chart is a recipe for confusion, not clarity.
A good, balanced approach often involves combining a few different types of indicators:
- Trend Indicator: Start with something simple like a 50-period Exponential Moving Average (EMA). It gives you a quick, clean read on the market's primary direction.
- Momentum Indicator: Add in an oscillator like the Relative Strength Index (RSI) to gauge the strength of a trend and spot potential overbought or oversold signals.
- Confirmation Tool: Use classic chart patterns or volume analysis to validate what your indicators are telling you. A breakout pattern that happens on a huge spike in volume, for instance, has a lot more weight behind it.
Your goal isn't to find some magical combination of indicators that's never wrong. That doesn't exist. The real objective is to build a system that gives you a statistical edge over the long haul by filtering out the low-probability trades.
This systematic approach gives you a clear advantage. But even the slickest strategies have risks. One study on BTC/USDT pairs found that while winning trades happened more often, the average loss on a losing trade was a staggering 62.5%. This is a brutal reminder of why risk management isn't just important—it's everything.
Establish Your Rules of Engagement
Your strategy needs cold, hard rules for getting in and out of a trade. These rules have to be so specific that there’s no room for hesitation or second-guessing when the pressure is on.
Here’s what a simple, rule-based strategy might look like:
- Entry Condition: The price must be trading above the 50-period EMA (confirming an uptrend), AND the RSI must cross above 50 (showing momentum is building).
- Exit Condition (Profit): Sell the position when the RSI moves above 70, which suggests the asset is getting overbought.
- Exit Condition (Loss): Get out immediately if the price closes below the 50-period EMA. No questions asked.
That third rule is your stop-loss—a pre-set order that automatically sells your position if the price hits a certain point. It is the single most important tool you have for protecting your capital.
Master Risk and Position Sizing
So, how much do you put into a single trade? That’s where position sizing comes in. It's a simple calculation that connects your risk tolerance to your stop-loss.
Let's say you have a $10,000 account and your personal rule is to risk no more than 1% per trade ($100). If your strategy calls for a stop-loss that's 5% below your entry price, your position size would be $2,000 ($100 risk / 5% stop-loss). This math ensures that even if the trade goes completely south, your loss is capped at a level you already decided was acceptable.
Managing your money also means keeping an eye on trading costs. Always know your platform's fee structure, because frequent trading can rack up some serious expenses. For example, understanding the https://www.vtrader.io/en-us/fees can massively influence how you build a high-frequency strategy.
Ultimately, the best strategy is one you can actually stick to, day in and day out. For more ideas on developing your crypto trading plan, it's always worth getting insights from crypto investing experts. And remember: always backtest your rules on historical data and start with small positions until you've proven your system works.
Common Mistakes That Will Wreck Your Crypto TA
Technical analysis is an incredible tool, but it's no crystal ball. For every trader who gets it right, there are a dozen others falling into the same old traps that can bleed an account dry. Knowing what not to do is just as crucial as knowing which indicator to pull up.
One of the biggest blunders traders make is what’s known as analysis paralysis. This is when you plaster your chart with so many indicators it starts to look like a Jackson Pollock painting. You’ve got three moving averages, an RSI, Bollinger Bands, and a MACD all screaming at you. Instead of clarity, you get a mess of conflicting signals that freezes you from making any decision at all.
Another surefire way to lose money is to live entirely inside the charts, ignoring the world around you. That perfect head and shoulders pattern you spotted? It's completely useless if a country is about to announce a crypto ban or a major exchange just got hacked. Real-world events will always, always trump your chart patterns.
Stay Grounded: Best Practices That Actually Work
Getting good at TA is less about finding a "magic" indicator and more about building iron-clad discipline. It’s about creating a systematic, almost professional approach to every single trade. You need a process that saves you from your own worst impulses when the market gets wild.
To forge that discipline, start with these non-negotiable habits:
- Keep a Trading Journal: Seriously, write everything down. Document your entry price, your exit, your stop-loss, and why you took the trade. This log becomes your personal playbook, showing you exactly what’s working, what isn’t, and how your own emotions are secretly sabotaging you.
- Backtest Your Strategies: Never risk real money on a strategy you haven't tested. Run your rules against historical price data to see how they would have performed. This gives you cold, hard proof of whether your system has a real edge or if it's just a coin flip destined to fail.
- Get Your Emotions in Check: The market is a battlefield of fear and greed. The only shield you have is your pre-defined trading plan. Sticking to it—especially your stop-loss—is the only way to avoid those gut-wrenching, emotional decisions that wipe out accounts.
The real goal of technical analysis isn't to be right 100% of the time—that's a fantasy. The goal is to build a system with a proven edge that you can execute over and over again, managing your risk on every trade so you can survive long enough to win.
Frequently Asked Questions
Even after you get the hang of charts, indicators, and patterns, putting technical analysis to work in the real world of crypto trading can bring up a whole new set of questions. Let’s tackle some of the most common ones traders ask.
Think of this as your quick-reference guide to cut through the noise and trade with a bit more clarity.
Is Technical Analysis a Guaranteed Way to Make a Profit?
Not a chance. And that’s probably the biggest myth in all of trading.
Technical analysis is not a crystal ball; it's a tool for managing probabilities. It doesn’t tell you what the market will do. It shows you what it’s most likely to do based on how it has behaved in the past.
The real power of TA is in managing your risk. A good strategy gives you clear signals for when to get in, when to get out, and where to place your stop-loss. It's all about protecting your capital so you can stay in the game. Success comes from playing the odds over hundreds of trades, not from trying to win every single one.
How Does TA Compare to Fundamental Analysis in Crypto?
They’re two totally different beasts, looking at the market from opposite ends of the spectrum.
- Fundamental Analysis (FA) is like being a detective. It digs into a project's core value by asking questions: What problem does this coin actually solve? Who’s on the team? What are the tokenomics?
- Technical Analysis (TA) doesn't care about any of that. It operates on the belief that all that fundamental information—the news, the hype, the utility—is already baked into the price you see on the chart. It focuses only on price and volume.
Plenty of savvy traders actually use a mix of both. They might use FA to find a solid project they believe in for the long haul, then use TA to pinpoint the perfect time to buy, like during a dip to a key support level.
Ultimately, there’s no "better" method. It all comes down to your personality, how much time you have, and what you’re trying to achieve. Day traders live and breathe TA, while long-term investors are almost always leaning on FA.
Can I Use Technical Analysis on Any Cryptocurrency?
In theory, yes. You can slap indicators on any chart that has price history and trading volume. The core ideas behind TA—trends, patterns, support, and resistance—are all reflections of human psychology, which is pretty universal.
However, it works a lot better on the big players like Bitcoin and Ethereum. Why? Because they have tons of liquidity and years of data, making the patterns more reliable.
Newer, low-volume altcoins can be a bit of a wild west. Their prices can be easily manipulated and swing erratically, making TA less dependable. Before you dive into a lesser-known coin, check out our comprehensive list of common crypto questions for more specific insights.
Ready to put what you've learned into practice? vTrader gives you a commission-free trading environment with all the advanced tools you need to apply your technical analysis skills. Sign up today and start trading smarter.
Start Trading with Zero Fees on vTrader

Steve Gregory is a lawyer in the United States who specializes in licensing for cryptocurrency companies and products. Steve began his career as an attorney in 2015 but made the switch to working in cryptocurrency full time shortly after joining the original team at Gemini Trust Company, an early cryptocurrency exchange based in New York City. Steve then joined CEX.io and was able to launch their regulated US-based cryptocurrency. Steve then went on to become the CEO at currency.com when he ran for four years and was able to lead currency.com to being fully acquired in 2025.