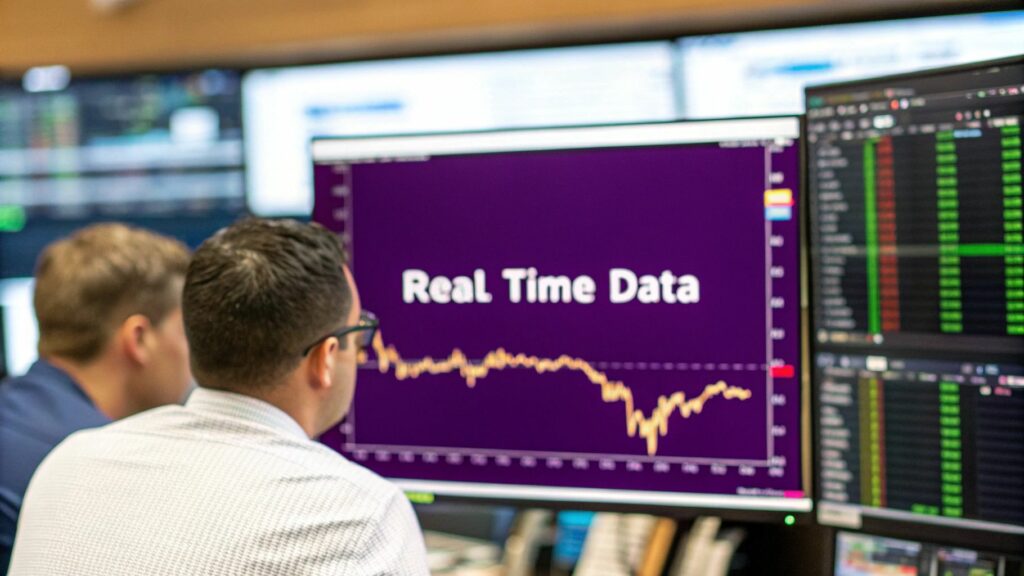
In the crypto world, timing isn't just everything—it's the only thing. That's where real-time market data comes in. It's the constant, live-streamed flow of information on prices, trading volumes, and order books.
Trying to trade without it is like driving down the highway using a five-minute-old map instead of a live GPS. One gives you a massive edge, while the other leaves you driving straight into a traffic jam you could have avoided.
What Is Real Time Market Data
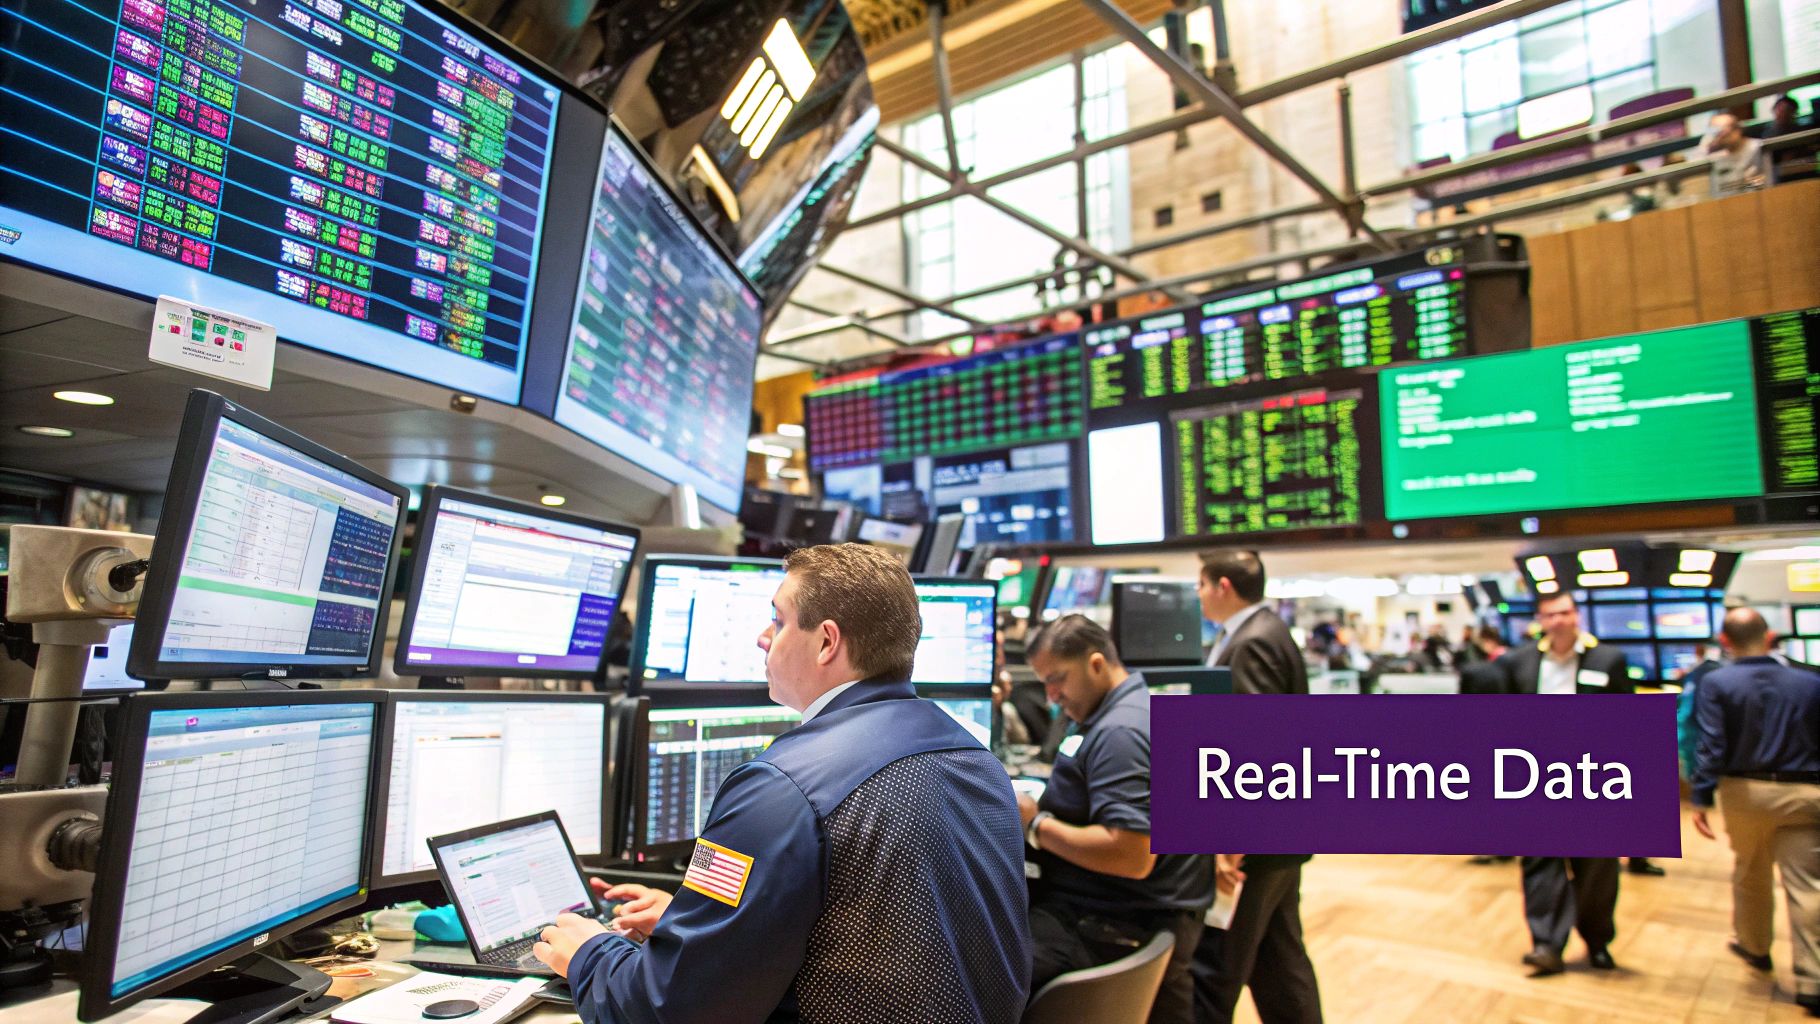
Imagine trying to catch a train by looking at last week's timetable. You might get lucky, but chances are you'll be left standing on the platform. Real time market data is the up-to-the-second feed that tells you what’s happening in the market right now. It's not delayed by 15 minutes or refreshed every so often; it's the market's live pulse.
This firehose of information is the lifeblood for any serious trader, especially in a market as wild as crypto, where prices can swing wildly in just a few seconds. It gives you the raw details you need to make sharp, timely decisions.
Key Information Delivered in Real Time
Platforms like vTrader are built to channel this live feed and deliver critical insights straight to your screen. This data is made up of several core pieces that, together, paint a full picture of the market's health and direction:
- Live Price Quotes: The current bid (buy price) and ask (sell price) as they flicker and change.
- Order Book Depth: A full list of all the buy and sell orders waiting to be filled, giving you a clear view of supply and demand.
- Trade Volumes: A tracker for how many assets are actually being traded, which helps gauge market interest and momentum.
- Last-Traded Price: The exact price of the most recent transaction, confirming where the market just was.
Having this information instantly turns trading from a high-stakes guessing game into a responsive, strategic activity. To really see how powerful this is, it's worth digging into specific applications, like the nuances of real-time options data.
The hunger for instant information isn't just a trading phenomenon. The entire analytics market reflects this, showing a massive global shift toward getting data the second it's created, no matter the industry.
The value of this speed is exploding. The real-time analytics market ballooned by a staggering 22.63% in the past year alone, creating over 13,000 new jobs to keep up with demand. If you want to get a better handle on these market dynamics, check out the guides over at the vTrader Academy.
Why Instant Data Is a Crypto Trading Superpower
In the crypto world, a few seconds can be the difference between a massive win and a painful loss. Trading with delayed information is like trying to surf a wave you can’t see coming—by the time you feel it, it’s already too late. Real time market data is your lookout, spotting that wave the second it starts to form, giving you the precious time you need to get in position.
This isn’t just about being fast; it’s about trading smart. When you have an immediate, unfiltered look at what the market is doing, you're no longer just gambling. You're making strategic moves based on what's happening right now. You stop reacting to yesterday's news and start moving with the market's pulse.
Spotting Opportunities and Managing Risk
The biggest advantage of instant data? The power to execute your trades with pinpoint accuracy. This means catching those tiny arbitrage windows that might only be open for a few seconds or nailing your entry and exit points based on live momentum. You get to act on opportunities the moment they appear, not minutes after they've already passed.
Good luck managing risk without a live feed. When the market suddenly nosedives, real-time alerts let you react instantly to protect your portfolio. This is a massive edge in a market where achieving 98% trade execution success rates often comes down to cutting out every millisecond of delay.
The difference in performance between trading with real-time data versus old, delayed feeds is night and day.

As you can see, the practically non-existent latency and superior accuracy of real-time feeds can lead to wildly better trading outcomes.
Let’s break down exactly what that means for your strategy.
Delayed Data vs Real Time Market Data
| Trading Aspect | Impact of Delayed Data | Advantage of Real Time Data |
|---|---|---|
| Entry/Exit Points | Missed opportunities; you act on prices that no longer exist. | Capitalize on fleeting moments and execute with precision. |
| Risk Management | Slow reaction to downturns, leading to larger potential losses. | Instantly protect your capital by reacting to live market shifts. |
| Trend Confirmation | You might jump into a trend too late, after the real move is over. | Confirm trends with live volume and momentum, catching the move early. |
| Market Sentiment | Reacting to news after it's already priced into the market. | Act on breaking news before the rest of the market catches up. |
Ultimately, relying on delayed data forces you to be reactive, always a step behind. Real-time data, on the other hand, empowers you to be proactive, anticipating and acting on the market as it unfolds.
This is what turns raw market noise into clear, actionable signals. It allows you to confirm trends with live volume data, react to breaking news before it's fully priced in, and manage your positions with confidence.
To see this in action, just look at how some platforms offer real-time copy trade notifications from platforms like Vertex, which lets users mirror the moves of pro traders instantly. For more on how major events shake the market, you can always check for updates on the vTrader crypto news hub. Being able to see and act on live information is what separates the consistently profitable traders from everyone else.
Decoding the Components of Real Time Data
Real-time market data isn't just one number flashing on your screen. It’s a powerful blend of different information streams that, when woven together, paint a complete picture of what the market is doing right now. Think of it like a car's dashboard—you wouldn't drive just by looking at the speedometer. You need the fuel gauge, engine temp, and GPS to get where you're going safely.
This is exactly how seasoned traders on platforms like vTrader operate. They’ve learned to read all these data streams in harmony. Getting a grip on each component is the key to moving past surface-level guesses and into the realm of truly informed decisions. It lets you see not just what the price is, but why it's moving.
The Iceberg of Market Data
One of the best ways to think about market data is to picture an iceberg. Most people only ever see the tip sticking out of the water, but the real mass—the part that tells the true story—is hidden just beneath the surface.
-
Level 1 Data (The Tip of the Iceberg): This is the basic stuff you see everywhere. It’s your quick-glance info, covering the bid (the highest price a buyer is willing to pay), the ask (the lowest price a seller will take), and the last traded price. It’s your snapshot.
-
Level 2 Data (Beneath the Surface): Now we're getting to the good stuff. Level 2 data cracks open the entire order book, which is a ranked list of every single buy and sell order waiting to be executed. It shows you market depth, revealing exactly how much supply and demand is stacked up at different price points. You're no longer just seeing the tip; you're seeing the whole iceberg.
By watching the order book, a trader can spot potential support and resistance levels before they happen. See a massive wall of buy orders at a specific price? That could be a strong support floor that stops the price from dipping any further.
Volume and the Market's Heartbeat
Beyond just price levels, a couple of other elements are vital for understanding the conviction behind any market move. First up is trading volume, which tells you how much of an asset changed hands over a set period. A price jump on high volume is a big deal; a similar jump on low volume might just be noise.
Then there's time and sales data, which traders often call "the tape." This is a granular, tick-by-tick feed of every transaction as it happens, showing the price, size, and time of each trade. Watching the tape gives you a feel for the real-time flow of the market. For other related data streams, you can check out tools like an ETH gas tracker to see how network congestion can affect trading costs.
How vTrader Turns Raw Data Into Actionable Insights
Getting a firehose of real-time market data is one thing, but actually making sense of it is a completely different ballgame. Without the right tools, it’s just a wall of noise. This is where vTrader really shines, by translating that complex, high-speed stream of raw numbers into clear, actionable trading signals right on your screen.
Instead of drowning you in endless data points, vTrader organizes everything into a dynamic, easy-to-read interface. This means raw tick data gets instantly converted into live charts that move with the market, second by second. This kind of immediate visualization helps you spot patterns and trends as they’re actually forming, not five minutes after the fact.
Here’s a look at the vTrader platform, where all this live data comes together in a clean charting and analysis environment.
As you can see, even complex information like order books and price action is laid out clearly, so you can make decisions on the fly.
From Data Points to Trading Decisions
The real magic of vTrader is how it lets you interact with this live data stream. You're not just a spectator; you’re in the driver's seat. A few key features are responsible for putting you in control.
- Customizable Technical Indicators: You can slap indicators like Moving Averages or RSI directly onto live charts. They don't just refresh every few minutes—they react instantly to every single price change, giving you a true read on market momentum.
- Intelligent Alert Systems: Let's be real, you can’t watch the screen 24/7. Set up custom alerts for specific price levels, sudden volume spikes, or indicator crossovers. vTrader becomes your personal market watchdog, pinging you the moment your conditions are met.
Think about it: you’re watching Bitcoin creep up to a major resistance level. You can set an alert that triggers only if the price breaks through that level and trading volume simultaneously surges by 20%. That combination is a powerful confirmation of strong buying pressure, giving you a much more confident entry signal.
Let’s walk through how this plays out. A trader on vTrader spots a potential breakout pattern forming on a chart. They quickly confirm the move by checking the live volume data, seeing a clear spike in buying activity. To lock in their plan, they set an intelligent alert for their target exit price. The whole process—from spotting the opportunity to mapping out an exit—is completely seamless, bridging the gap between an idea and a profitable trade.
Navigating the Challenges of High-Speed Data

While real time market data is a game-changer, its sheer speed and volume can feel like trying to drink from a firehose. This constant flood of information can quickly lead to analysis paralysis, a state where traders are so swamped by market noise they can’t make a decision at all.
The emotional toll is just as real. When every second seems to matter, the urge to make impulsive, gut-driven trades can be overwhelming. It’s all too easy to get swept up in the market’s frantic pace and toss a solid strategy out the window—a common trap that can drain your profits and your confidence.
Filtering the Noise for Clearer Signals
The secret to taming this intensity isn't about trying to absorb more data; it's about filtering it smarter. This is where a rock-solid trading plan becomes your most critical asset. By defining your strategy before you even look at the charts—your entry points, exit targets, and how much risk you're willing to take—you can slice through the noise and zero in on the signals that actually matter to your plan.
Platforms like vTrader are built to help you stay disciplined by handling the heavy lifting on the technical side. To put it in perspective, the world generated a staggering 120 zettabytes of data in 2023 alone, a figure set to blow past 181 zettabytes by 2025. You can get a sense of this data explosion's impact by checking out the latest data generation statistics.
A trader without a plan is just a gambler with a faster internet connection. The purpose of real-time data is not to encourage random clicking but to provide immediate confirmation for a pre-defined strategy.
Platforms like vTrader are designed to process this immense flow of information, freeing you up to focus on your analysis instead of wrestling with data management. Using built-in tools like customizable alerts and technical indicators, you can essentially automate your market watch and let the platform notify you the moment your specific conditions are met.
This kind of setup helps you keep your discipline sharp and dodge the emotional rollercoaster of high-speed trading. It also means you can avoid the high costs that often come with accessing premium data feeds and the infrastructure needed to handle them. You can get a clear picture of how vTrader keeps trading affordable by reviewing the vTrader fee structure.
Answering Your Questions About Real-Time Market Data
Even after you grasp its power, it’s natural to have questions about the finer details of using real-time market data. Let's break down some of the most common ones to build your confidence and show you how it all works on vTrader.
Diving into this high-speed world can feel a bit overwhelming, but the core ideas are actually pretty simple once you pull them apart. By tackling these key areas, you'll be much better prepared to make sharp, timely decisions.
Where Does This Data Actually Come From?
This data doesn't just materialize out of thin air—it’s streamed directly from the cryptocurrency exchanges themselves. Every single time a trader places an order, executes a trade, or cancels a position, the exchange's engine records it. Platforms like vTrader plug directly into these exchanges with special APIs (Application Programming Interfaces) to bring that firehose of information straight to your screen.
And the flow of information is absolutely massive. The global volume of data created hit 149 zettabytes in 2024 and is on track to more than double by 2028. It gives you a sense of the sheer scale of information that platforms have to process in a blink.
Think of it like a live broadcast from the market's center stage. You're not getting a second-hand report; you're watching the action unfold as it happens, giving you the same view as the big institutional players.
This direct line is exactly what guarantees the data is accurate and doesn't suffer from the frustrating delays that plague less sophisticated platforms.
Is Real-Time Data Really Necessary for Beginners?
Absolutely. It might seem like an advanced tool, but you could argue it's even more important for beginners. New traders are often more likely to make emotional decisions, and delayed data just pours fuel on that fire. It can create a false sense of security or, worse, cause panic when the price suddenly lurches to a level you never saw coming.
Using real-time data from day one helps you build solid habits. It trains you to react to what the market is doing right now, not what it was doing five minutes ago. This grounds your learning process in reality and helps you develop a true feel for market dynamics. For more foundational knowledge, our comprehensive FAQ page is a great place to start.
How Different Can Data Feeds Be?
Not all data feeds are created equal—not by a long shot. The main differences come down to their speed and depth. Some basic platforms might only give you Level 1 data (the current bid, ask, and last price), which offers just a surface-level glimpse.
Professional-grade platforms like vTrader, on the other hand, provide much richer streams of information, including:
- Level 2 Data: This shows you the entire order book, revealing the market's true depth and highlighting potential support or resistance zones.
- Tick-by-Tick Updates: You get information on every single trade as it happens, not just bundled-up snapshots every few seconds.
- Low-Latency Delivery: This minimizes the tiny delay between an event happening on the exchange and it appearing on your screen, which is everything when it comes to precision.
The quality of your data feed has a direct impact on the quality of your trading. A faster, deeper feed gives you a serious analytical edge.
Ready to trade with a true competitive advantage? Join vTrader today and get instant access to the real-time data and advanced tools you need to succeed.
Start Trading with Zero Fees on vTrader

Steve Gregory is a lawyer in the United States who specializes in licensing for cryptocurrency companies and products. Steve began his career as an attorney in 2015 but made the switch to working in cryptocurrency full time shortly after joining the original team at Gemini Trust Company, an early cryptocurrency exchange based in New York City. Steve then joined CEX.io and was able to launch their regulated US-based cryptocurrency. Steve then went on to become the CEO at currency.com when he ran for four years and was able to lead currency.com to being fully acquired in 2025.