At its core, using a moving average is about plotting a line on your chart that shows the average price of a crypto asset over a set period. The real magic happens when you watch how the current price interacts with this line.
Is the price above the moving average? That's a classic sign of an uptrend. If it dips below, you're likely looking at a downtrend. This simple visual helps you cut through the noise and make trading decisions with more confidence.
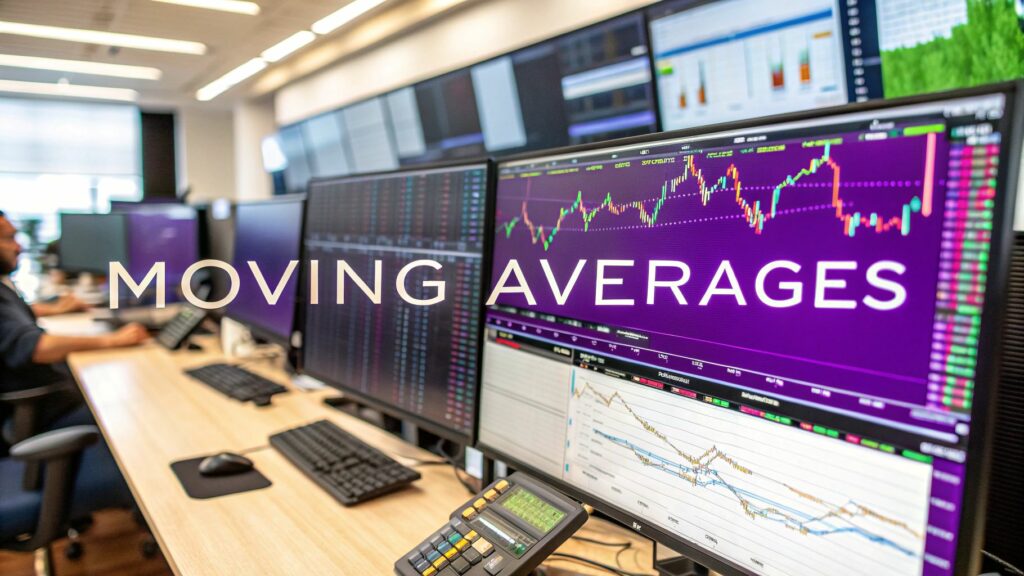
What Moving Averages Reveal About Crypto Trends
Before you jump into a trade, you need to understand what a moving average (MA) is actually telling you. Think of it as a filter. It smooths out the chaotic, day-to-day price swings of assets like Bitcoin or Ethereum to reveal the underlying trend.
A moving average is basically a constantly updating average price. For example, a 20-day moving average on a daily chart calculates the average closing price over the last 20 days. When a new day begins, the oldest day's price is dropped, and the new one is added. This makes the average "move" along with the price action.
This process helps you see the forest for the trees. Instead of getting spooked by a single day's dramatic price candle, the MA line gives you a much clearer, flowing indicator of the general market sentiment. If you're just starting out, learning to use MAs alongside a good guide on candlestick charts is a powerful combo.
Simple vs. Exponential Moving Averages
You'll run into two main types of moving averages in crypto trading: the Simple Moving Average (SMA) and the Exponential Moving Average (EMA). They both track trends, but how they do it is what sets them apart. Getting this distinction right is crucial for picking the best tool for your trading style.
-
Simple Moving Average (SMA): This one is straightforward. It calculates the average price by giving equal importance to every data point in the period. A 50-day SMA, for instance, just adds up the closing prices of the last 50 days and divides by 50. It’s incredibly reliable for confirming long-term, established trends.
-
Exponential Moving Average (EMA): The EMA is built for speed. It gives more mathematical weight to the most recent price action, making it react faster to new information. This extra sensitivity is a huge advantage in the crypto market, where momentum can shift in the blink of an eye.
Choosing Your Moving Average: SMA vs. EMA
This quick comparison will help you decide which moving average best fits your crypto trading style and strategy.
| Indicator | Calculation Focus | Responsiveness | Best For |
|---|---|---|---|
| Simple Moving Average (SMA) | Gives equal weight to all data points in the period. | Slower to react to price changes; provides a smoother line. | Identifying long-term, established trends and avoiding false signals. |
| Exponential Moving Average (EMA) | Gives more weight to recent price data. | Faster to react to price changes; can signal trends earlier. | Short-term trading, capturing quick momentum shifts, and day trading. |
Ultimately, there’s no "best" answer—it all depends on your strategy. The SMA gives you a steady, smoothed-out view perfect for longer-term analysis, while the EMA gives you a quicker pulse on recent market activity. Many experienced traders actually use both to get a more complete picture.
Selecting the Right Moving Average Settings
This is where the rubber meets the road—turning theory into a real, working strategy. Your first big decision is jumping into the classic SMA vs. EMA debate. While both track trends, their responsiveness makes them suited for completely different market personalities.
Let’s be honest, the crypto market moves at lightning speed. It’s volatile, and that’s where the Exponential Moving Average (EMA) really proves its worth. By putting more weight on recent price action, the EMA reacts faster to sudden shifts, often giving you a head start on entries and exits.
On the other hand, the SMA gives you a smoother, more stable view. It’s less likely to get thrown off by random price wicks, making it a rock-solid tool for confirming the direction of major, long-term trends. A trader might use a 200-day SMA to get a bird's-eye view of Bitcoin's overall health while using a punchy 20-period EMA on a 1-hour chart for quick day trades.
Choosing the Right Time Periods
Picking the right time period is just as crucial as the type of MA you use. Your choice here needs to sync up perfectly with your trading style. Short periods are built for speed; long periods are built for stability.
Here are some of the most battle-tested periods in crypto trading and why traders swear by them:
-
Short-Term (9, 12, 20, 26 periods): These are the go-to settings for day traders and scalpers. They hug the price tight, making them great for catching short-term momentum shifts. The 12 and 26-period EMAs are the core components of the famous MACD indicator for a reason.
-
Medium-Term (50 period): The 50-period moving average is a classic for gauging the intermediate trend. When the price stays above the 50 MA, it's generally seen as a sign of a healthy uptrend. Many swing traders treat it as a moving zone of support or resistance.
-
Long-Term (100 & 200 periods): These are the big ones. On daily charts, the 100 and 200-period moving averages are often considered the definitive line in the sand between a bull and a bear market. Institutions and long-term investors are always watching these levels.
Trader's Tip: Forget about finding a single "magic" number. The real goal is to find the periods that the market is actually paying attention to. If you see the price consistently bouncing off a 50 EMA, that’s your cue to add it to your chart.
The bottom line is matching the period to your timeframe. A long-term HODLer probably won't care about a 9-period EMA on a 15-minute chart, but a scalper lives and dies by it.
Layering Moving Averages for Deeper Insight
Using just one moving average gives you a flat, one-dimensional picture. The real magic happens when you start layering multiple MAs on your chart. This approach gives you a much richer perspective on trend strength, momentum, and potential reversals.
A popular and highly effective combo is layering the 20, 50, and 200-period MAs. This setup gives you a snapshot of the short, medium, and long-term trends all in one glance.
- When the MAs are stacked neatly (20 > 50 > 200) and spreading apart, you're looking at a strong, healthy uptrend.
- If they're stacked in reverse (20 < 50 < 200), it’s a clear signal of a powerful downtrend.
- And when they’re all tangled up and moving sideways? That’s the market telling you it’s in a consolidation phase.
Learning how to stack MAs is fundamental if you want to know how to use moving averages like a pro. It helps you size up the market instantly and stay on the right side of the momentum. To see how MAs fit into the bigger picture, check out our guide on how to identify market trends.
Ultimately, the best settings are the ones that fit your strategy and the crypto you’re trading. Don’t hesitate to experiment with different combinations on your vTrader charts. Find what gives you the clearest signals and stick with it.
Trading the Golden Cross and Death Cross
Of all the signals moving averages can give us, few capture the market’s imagination quite like the Golden Cross and its evil twin, the Death Cross. These aren't just technical patterns; they are major market events that can signal the start of powerful, long-term trends.
The reason they're so potent comes down to psychology. When a Golden or Death Cross appears on a chart, it often becomes a self-fulfilling prophecy. Why? Because countless traders, from huge funds to retail investors, are all watching the exact same thing. This shared focus can unleash a massive wave of buying or selling, pushing the market exactly where the cross suggests it will go.
Decoding the Golden Cross Signal
A Golden Cross is a powerful bullish signal that flashes when a shorter-term moving average slices up through a longer-term one. The classic, most-watched combination is the 50-day SMA crossing above the 200-day SMA on the daily chart.
Think of it this way:
- The 200-day SMA is the long-term consensus—the slow, established trend.
- The 50-day SMA is the more recent, faster-moving market sentiment.
When that faster line (recent sentiment) decisively overtakes the slower line (long-term consensus), it tells you a fundamental shift might be happening. This is often the first real sign that a bear market is losing its grip and a new bull market could be starting. You can discover more insights about this widely-followed signal on IG.com.
Key Insight: A real Golden Cross isn’t just about the lines crossing. Smart traders wait for confirmation. Look for a spike in trading volume and for the price to hold firmly above both moving averages after the event.
That confirmation step is your filter. A cross that happens on weak volume or gets immediately smacked back down by sellers is often a fake-out, especially in a messy, sideways market.
Understanding the Death Cross Warning
On the flip side, the Death Cross is the Golden Cross's ominous counterpart. It appears when the 50-day SMA dives below the 200-day SMA, signaling that recent selling pressure has finally broken the back of the long-term uptrend. Traders see this as a major bearish warning, one that could kick off a prolonged downtrend.
The psychology here is pure fear. As the short-term average breaks down, it suggests the bulls have thrown in the towel. Traders who were hoping for a bounce might see the Death Cross as their final cue to sell, which just adds more fuel to the fire.
But just like its bullish twin, the Death Cross isn't foolproof. It's a lagging indicator, which means it’s confirming a downtrend that has already started. By the time it appears, a big chunk of the drop might have already occurred.
A Practical Strategy for Trading Crossovers
Just blindly buying a Golden Cross or shorting a Death Cross is a rookie mistake that can get you chopped up by false signals. A more professional approach uses the cross as a confirmation within a broader trend-following strategy, not as a standalone trigger.
Here’s a smarter way to play these signals:
- Wait for the Cross: Don't jump the gun. Let the 50-day and 200-day MAs officially cross on the daily chart. Patience is key.
- Look for a Retest: After a Golden Cross, the price often pulls back to test one of the moving averages (usually the 50-day) as new support. This dip is a much better place to enter than chasing the initial excitement.
- Confirm with Other Indicators: Don't trade in a vacuum. Does the Relative Strength Index (RSI) also show bullish momentum? Is trading volume picking up, proving there's real conviction behind the move?
- Set Your Stop-Loss: This is non-negotiable. For a Golden Cross trade, placing a stop-loss just below the 200-day moving average makes sense. That line is now your ultimate line in the sand for the new uptrend.
By waiting for a pullback and getting confirmation, you avoid many of the traps that snare new traders. This disciplined method also improves your entry price, which is essential for building a solid trading plan. To really nail this down, it's crucial to learn about the risk-reward ratio in trading. A good strategy isn't about chasing signals; it's about making calculated decisions.
Finding Entries and Exits with Moving Averages
Crossover signals like the Golden Cross and Death Cross are fantastic for spotting major, long-term trend shifts. The thing is, they're lagging indicators. For the day-to-day grind of trading, you need something that gets you in and out of the market with more precision.
This is where you learn how to use moving averages as dynamic zones of support and resistance—and it's a total game-changer.
Forget static horizontal lines. Moving averages flow and adapt with the price, giving you constantly updating levels where buyers or sellers are likely to show up. In a strong uptrend, an EMA like the 20-period or 50-period often acts as a floor, catching pullbacks and creating solid entry points. In a downtrend, it becomes a ceiling, stopping rallies in their tracks and offering a chance to go short.
Using MAs for High-Probability Entries
The core idea here is simple: trade with the trend, not against it. The first job is always to identify which way the market is moving. A quick glance to see if the 20 EMA is above the 50 EMA usually does the trick.
Once the trend is confirmed, you don't chase pumps. You wait for the price to come back to you.
A pullback to a key moving average is your cue to start paying close attention. This little dip is just some profit-taking or a brief pause within the larger move. When the price action touches that MA and bounces, it’s a sign that other trend-following traders are stepping in to "buy the dip," reinforcing the trend's strength.
Here’s what a typical long trade setup looks like:
- Spot the Uptrend: You're looking at the 1-hour ETH/USD chart. The 20 EMA is cruising above the 50 EMA, and both are pointing up.
- Wait for the Pullback: Price rips higher, then cools off and dips right back to the 20 EMA.
- Get Confirmation: A bullish candlestick—like a hammer or a bullish engulfing pattern—forms right on the moving average. That’s your trigger.
- Pull the Trigger: Enter a long position as the price starts moving away from the MA.
This patient approach stops you from FOMO-ing in at the top of a rally and gives you a much better entry, which seriously improves your risk-to-reward ratio.
Using MAs as Clear Exit Signals
Knowing when to get out is just as important as knowing when to get in. Moving averages give you a clean, objective rule for closing your positions, taking the emotion out of the equation.
If you're in a long trade, a decisive candle close below the moving average you used for entry is a solid signal. It tells you that dynamic support has failed and it's time to either take profits or cut your losses. That small pullback might be turning into a full-blown reversal.
The same logic applies to short trades, just in reverse. If you shorted a rally that bounced off the 50 EMA in a downtrend, a clean price close above that same MA is your signal to get out. This discipline is what protects your capital when the market turns against you.
This chart visualizes how those major trend changes—the Golden and Death Cross—set the stage for these entry and exit opportunities.
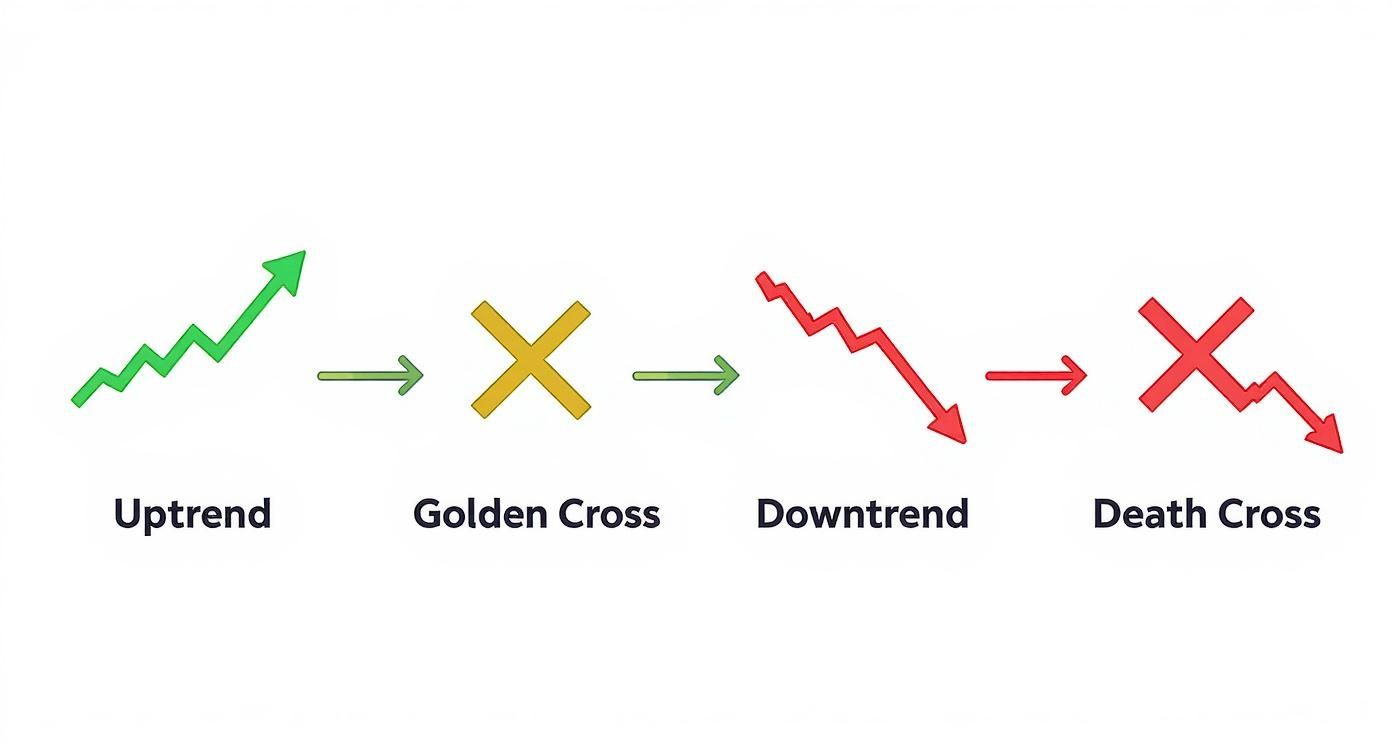
You can see how a Golden Cross kicks off a potential uptrend where pullbacks are buying opportunities. On the flip side, a Death Cross signals a downtrend where you'd be looking to sell the rallies.
Integrating Risk Management with MAs
Maybe the most vital role moving averages play is in your risk management. They give you a perfectly logical place to set your stop-loss, which is your safety net on every single trade you take.
By placing your stop-loss on the other side of a key moving average, you are defining your risk based on the market's structure. You are essentially saying, "I am bullish on this trade as long as the price remains above this key trend indicator."
For instance, if you go long on a bounce from the 50-period EMA, a smart place for your stop-loss is just below it. This gives the trade enough room to breathe without getting stopped out on random noise. But if that critical support level breaks, your stop will get you out automatically, confirming your trade idea was wrong and saving you from a bigger loss.
This simple technique is a professional habit that protects your trading account from catastrophe. You can dive deeper into this in our guide to setting effective stop-loss and take-profit levels.
Setting Up Moving Averages in vTrader
Theory is great, but profits are made on the charts. Let's get practical and move your new knowledge about moving averages into the vTrader platform. This walkthrough will show you exactly how to add your first indicator, save your setup for quick access, and even automate your signals.
Putting SMAs and EMAs on a vTrader chart is easy. The real goal is to build a clean, functional workspace that tells you the market's story at a glance—no clutter, just clarity.
Adding Indicators and Customizing Your Chart
First, open up any chart in your vTrader account. You'll see an "Indicators" button somewhere near the top of the chart window. Give that a click, and a library will pop up where you can search for and add "Moving Average" or "Moving Average Exponential."
Once you select one, it’ll appear on your chart with its default settings. Now comes the important part: tailoring it to fit the strategies we’ve talked about.
- Tweak the Period: Hover your mouse over the indicator's name on your chart and find the settings icon (it usually looks like a little gear). The main input you'll change is "Length" or "Period." This is where you punch in numbers like 20, 50, or 200.
- Check the Source: Most moving averages are calculated using the "close" price of each candle, and that’s the standard for almost every strategy. But if you have a specific method that requires it, vTrader lets you base the calculation on the open, high, or low price instead.
- Nail the Style: This isn't just about making your chart look good; it’s about making it readable in a split second. Give each moving average a unique color and line thickness. A common setup is making short-term MAs (like a 20 EMA) thin and bright, while long-term MAs (like a 200 SMA) are thicker and darker. This visual trick helps your brain instantly know which line is which.
Here’s a quick look at a vTrader chart set up with a 20 EMA (blue), 50 EMA (orange), and 200 SMA (red).
This configuration gives you a complete picture: the blue line shows short-term momentum, the orange line tracks the medium-term trend, and the thick red line defines the overall market bias.
Building and Saving Your Template
Nobody has time to add and customize three or four indicators every time they look at a new crypto pair. Once you have a combination of moving averages you love, vTrader lets you save it as an indicator template.
Find the "Templates" icon, usually right next to the "Indicators" button. From there, you can hit "Save Indicator Template" and give your setup a name you'll remember, like "MA Trend System." The next time you open a fresh chart, you can apply your entire custom setup with just one click. It’s a huge time-saver and keeps your analysis consistent.
Pro Tip: Don't stop at one template. I have different templates for different purposes. One might be for scalping on the 5-minute chart with fast EMAs (like a 9 and 21), and another for swing trading on the daily chart with slower SMAs (like a 50 and 200).
Setting Up Automated Trading Alerts
This is where vTrader really starts working for you. You don't have to stare at the screen all day waiting for a crossover. You can set up automated alerts to notify you when key events happen.
Head over to the alerts menu and create a new alert with specific conditions. For example, you could set up alerts for:
- Price Crossing an MA: Tell vTrader to alert you when the "Price" of "BTC/USD" crosses "above" the "50 EMA" on the 4-hour chart. You’ll get a notification the moment a potential buy signal appears.
- Golden/Death Cross Alerts: Create a condition where the "50 SMA" crosses "above" the "200 SMA" on the daily chart. This ensures you’re always aware of major, long-term shifts in the market trend.
You can get these alerts sent right to your phone or email, letting you act on opportunities as they happen, even when you're away from your desk. This kind of automation is a game-changer for trading a 24/7 market like crypto. While this guide is focused on vTrader, you can practice these same concepts on other charting platforms, like this TradingView demo application, to get a feel for how it all works.
Common Questions About Trading with Moving Averages
Once you move from theory to live charts, you’ll inevitably run into some practical questions. That’s perfectly normal. Let's walk through a few of the most common hurdles traders face so you can navigate them with confidence.
First up, the big one: Which moving average is truly the best?
The honest answer? There isn't one. The right MA for you—whether it's an SMA or an EMA, a 20-period or a 200-period—boils down to your trading style and goals. In the fast-paced crypto world, many traders lean toward the EMA for its quick reaction time. But if you're mapping out a longer-term position, the smoother, more stable SMA might be your best friend.
Which Timeframe Is Most Reliable?
Another question I hear all the time is about chart timeframes. Do these indicators work better on a daily chart or a 15-minute chart?
While MAs are useful everywhere, they generally become more reliable on higher timeframes. A 50-day moving average holding as support on a daily chart is a much stronger signal than a 50-period MA on a 5-minute chart, which can get whipsawed by market noise.
Trader's Takeaway: Think of it like this—higher timeframes reveal the ocean's tide, while lower timeframes show the individual waves. Use the 4-hour, daily, and weekly charts to lock in the primary trend. Then, zoom into the 1-hour or 15-minute charts to pinpoint your entry and exit points.
This brings up another classic scenario: What do you do when different timeframes give you conflicting signals? Say the daily chart is screaming "uptrend" with the price way above the 50-day MA, but the 1-hour chart shows the price just broke below its own 50-period MA.
In these cases, the higher timeframe signal almost always wins. That dip on the 1-hour chart? It’s likely just a minor pullback in a much larger, healthier trend. This is where combining MAs with other indicators can give you the confirmation you need. It's one of the most effective crypto trading strategies for filtering out the noise.
Ultimately, getting comfortable with moving averages comes from practice. Start with the standard settings, watch how different crypto pairs react, and don't be afraid to tweak the numbers until the trend becomes crystal clear to you.
Ready to put these strategies into action on a platform built for clarity and performance? vTrader offers zero-fee trading, advanced charting tools, and automated alerts to help you trade smarter. Open your free account and start trading today.

Steve Gregory is a lawyer in the United States who specializes in licensing for cryptocurrency companies and products. Steve began his career as an attorney in 2015 but made the switch to working in cryptocurrency full time shortly after joining the original team at Gemini Trust Company, an early cryptocurrency exchange based in New York City. Steve then joined CEX.io and was able to launch their regulated US-based cryptocurrency. Steve then went on to become the CEO at currency.com when he ran for four years and was able to lead currency.com to being fully acquired in 2025.