Spotting a trend in crypto is about more than just watching prices pump or dump. You have to look deeper and understand the fundamental forces at play—the economic data, investor sentiment, and critical technical signals that are really moving the market. Getting that bigger picture is what separates a reactive trader from a strategic one.
Your Foundation for Spotting Crypto Market Trends
Before you can start calling out trends, you need a solid way to make sense of the constant flood of data. Don't think of the market as one chaotic line. Instead, see it as a blend of distinct movements, each telling its own part of the story. Nailing this concept is the first real step toward seeing past the daily noise.
At its core, trend analysis comes down to telling three types of market movements apart:
- Primary Trends: This is the big one—the market's long-term direction, often lasting a year or even more. Think of it as the main current of a river; it dictates the overall flow, whether we're in a bull or bear market.
- Secondary Trends: These are the shorter-term corrections that push against the primary trend. If the primary trend is the river, these are the eddies and counter-currents that can pop up for a few weeks or several months.
- Minor Fluctuations: This is the day-to-day or week-to-week price action that creates most of the market chatter. It's tempting to get sucked in, but these small swings rarely signal the broader market's true direction.
Putting Theory into Practice
Recognizing these different layers is everything. Let's say prices drop for a week straight (a minor fluctuation). It might look scary and trigger some panic selling. But if it’s happening inside a powerful, year-long uptrend (the primary trend), it's more likely just a temporary pullback—a secondary trend.
The chart below shows historical economic data, which is often the engine driving those long-term primary trends in financial markets.
This kind of big-picture data reveals the long-term growth and recession cycles that define primary bull and bear markets. It gives you the context you need to interpret shorter-term crypto price action. This is foundational knowledge, and you can build on it by digging into the resources over at the vTrader Academy, which has a ton of guides on market analysis.
https://www.vtrader.io/en-us/academy
One of the biggest mistakes I see is traders treating every price move the same. A successful trader learns to tell the difference between a ripple and a tide, focusing their energy on the forces that actually matter for long-term success.
This mental model—separating primary, secondary, and minor movements—is your starting point. It takes a firehose of complex information and organizes it into a clear, usable framework. Of course, as you get better at analyzing crypto trends, it’s just as important to stay on top of practical matters like understanding your crypto tax obligations. After all, a solid strategy combines sharp market analysis with smart financial diligence.
To wrap up this foundational concept, here’s a quick-glance table breaking down the core ideas we've covered. Think of these as the three pillars you'll build your entire trend analysis strategy on.
The Three Pillars of Trend Identification
| Pillar | What It Reveals | Key Signals to Monitor |
|---|---|---|
| Primary Trend | The market's main, long-term direction (over a year) | Macroeconomic data, major market cycles, long-term moving averages |
| Secondary Trend | A temporary correction against the primary trend (weeks to months) | Significant pullbacks, periods of consolidation, chart patterns (flags, pennants) |
| Minor Fluctuations | Short-term noise and daily volatility (days to weeks) | Daily price swings, news-driven spikes/dips, intraday chart patterns |
With these three pillars in mind, you're ready to move beyond just watching prices and start truly analyzing the market.
Decoding the Macroeconomic Landscape
The crypto market might feel like its own little universe, but it's absolutely tethered to the gravitational pull of the global economy. If you ignore macroeconomic data, you're essentially trying to sail the ocean by only looking at the tiny waves hitting your boat. You'll completely miss the massive currents and winds that are actually setting your course.
To really get a grip on how to identify market trends in crypto, you have to learn how to read these powerful, external forces.
These forces show up as key economic reports. Think of them as the vital signs of the global economy. When these numbers drop, they can send shockwaves through every financial market out there, and crypto is no exception.
Take inflation data, for example. When the Consumer Price Index (CPI) comes in hot, it can be a huge driver for Bitcoin. As traditional currencies lose their buying power, investors start scrambling for assets with a fixed supply to protect their wealth. A rising CPI often signals a coming bullish trend for assets like Bitcoin, as more people look for a store of value outside the old system.
Key Economic Indicators to Watch
You don't need a Ph.D. in economics, but keeping a few key reports on your radar is non-negotiable. These indicators give you a snapshot of economic health and can often predict where investor sentiment is heading before it ever shows up on the charts.
- Inflation Reports (CPI): As we covered, high inflation can supercharge the narrative for scarce digital assets. On the flip side, when inflation starts to cool off, the urgency to hedge can fade, which might soften demand.
- Employment Figures: Strong job numbers usually mean the economy is humming along, which gives central banks the green light to raise interest rates to fight inflation. Higher rates can make holding something that doesn't pay a yield, like Bitcoin, a little less appealing compared to interest-bearing investments.
- Gross Domestic Product (GDP) Growth: GDP is the big one—it measures the total value of everything a country produces. Strong GDP growth usually signals a "risk-on" environment where investors are more than willing to pour capital into more speculative plays like altcoins.
My personal rule is to always know the dates for the next major economic releases. Market volatility often goes crazy around these announcements. Being prepared means you're not caught flat-footed by a sudden, violent price swing.
The link between these macro events and crypto price action gets clearer every single year. A surprise interest rate hike from the Federal Reserve can trigger an instant sell-off across both stocks and crypto. Staying on top of these developments isn't optional anymore; it's a core part of any solid trading strategy. You can stay ahead of the curve by following a reliable source for market updates, and our vTrader news hub is built to give you exactly that kind of timely information.
Reading the Historical Context
Looking at today's data is only half the battle. The real edge comes from putting those numbers into a historical context. One of the most powerful ways to spot market trends is by analyzing historical economic data to find recurring patterns and long-term cycles.
For instance, looking back at historical United States Gross Domestic Product (GDP) data reveals undeniable long-term trends in economic growth and recessions—powerful signals of major market shifts. Between 1929 and 1933, the U.S. economy saw its GDP collapse by nearly 30% during the Great Depression, a devastating bear market. This was followed by long stretches of expansion that fueled bull markets, broken up by shorter recessions that brought the bears back out. You can discover more insights about historical economic data on Statista.com to see these cycles for yourself.
Recognizing these massive, cyclical patterns helps you figure out where we might be in the bigger economic story. It’s the difference between seeing a temporary market dip versus the beginning of a brutal, prolonged downturn.
Building a Forward-Looking View
Once you combine your knowledge of key economic indicators with an appreciation for historical cycles, you can start building a forward-looking perspective. This isn't about gazing into a crystal ball. It’s about making educated guesses based on the flow of capital and the health of the economy.
Let's walk through a scenario: inflation is running hot, but employment numbers are starting to look weak and GDP growth is slowing down. This toxic mix might suggest the economy is heading for a downturn, or even "stagflation." In that kind of environment, central banks might be forced to slam the brakes on raising interest rates or even start cutting them to kickstart growth.
That kind of policy shift could be incredibly bullish for crypto. A pivot from tightening to easing monetary policy often floods the financial system with liquidity, and a good chunk of that new capital frequently finds its way into riskier assets. By tracking these macroeconomic clues, you can anticipate this potential shift and get positioned accordingly, long before the trend is obvious to everyone else. This is how you stop reacting to the market and start anticipating its next big move.
Using Technical Analysis To Pinpoint Opportunities
If macroeconomic data tells you the why behind a potential trend, technical analysis tells you when it’s actually starting to gain traction. This is where you roll up your sleeves and dive into the charts. It's about decoding the raw language of price and volume to find solid entry and exit points, leaving the global economic theories behind for pure market mechanics.
Honestly, learning to read charts is a non-negotiable skill if you're serious about figuring out how to identify market trends. You're basically looking for patterns in market psychology—the fingerprints that fear, greed, and indecision leave all over a price chart.
Moving Averages: The Trend Spotter's Compass
One of the simplest yet most effective tools you'll use is the moving average (MA). It smooths out the chaotic day-to-day price action, giving you a much cleaner view of the underlying trend. Think of it as your compass in the choppy crypto seas.
For spotting longer-term trends, two MAs are absolutely essential:
- The 50-Day Moving Average: This gives you a great read on the medium-term trend and current market momentum.
- The 200-Day Moving Average: This is the big one. It represents the long-term trend, and an asset’s position relative to its 200-day MA is often what defines whether we’re in a bull or bear market.
When the shorter-term 50-day MA pushes up and crosses above the 200-day MA, traders call it a "golden cross." This is a classic bullish signal suggesting a new upward trend is building steam. The opposite, a "death cross" (50-day crossing below the 200-day), is a powerful warning that a bear market could be setting in.
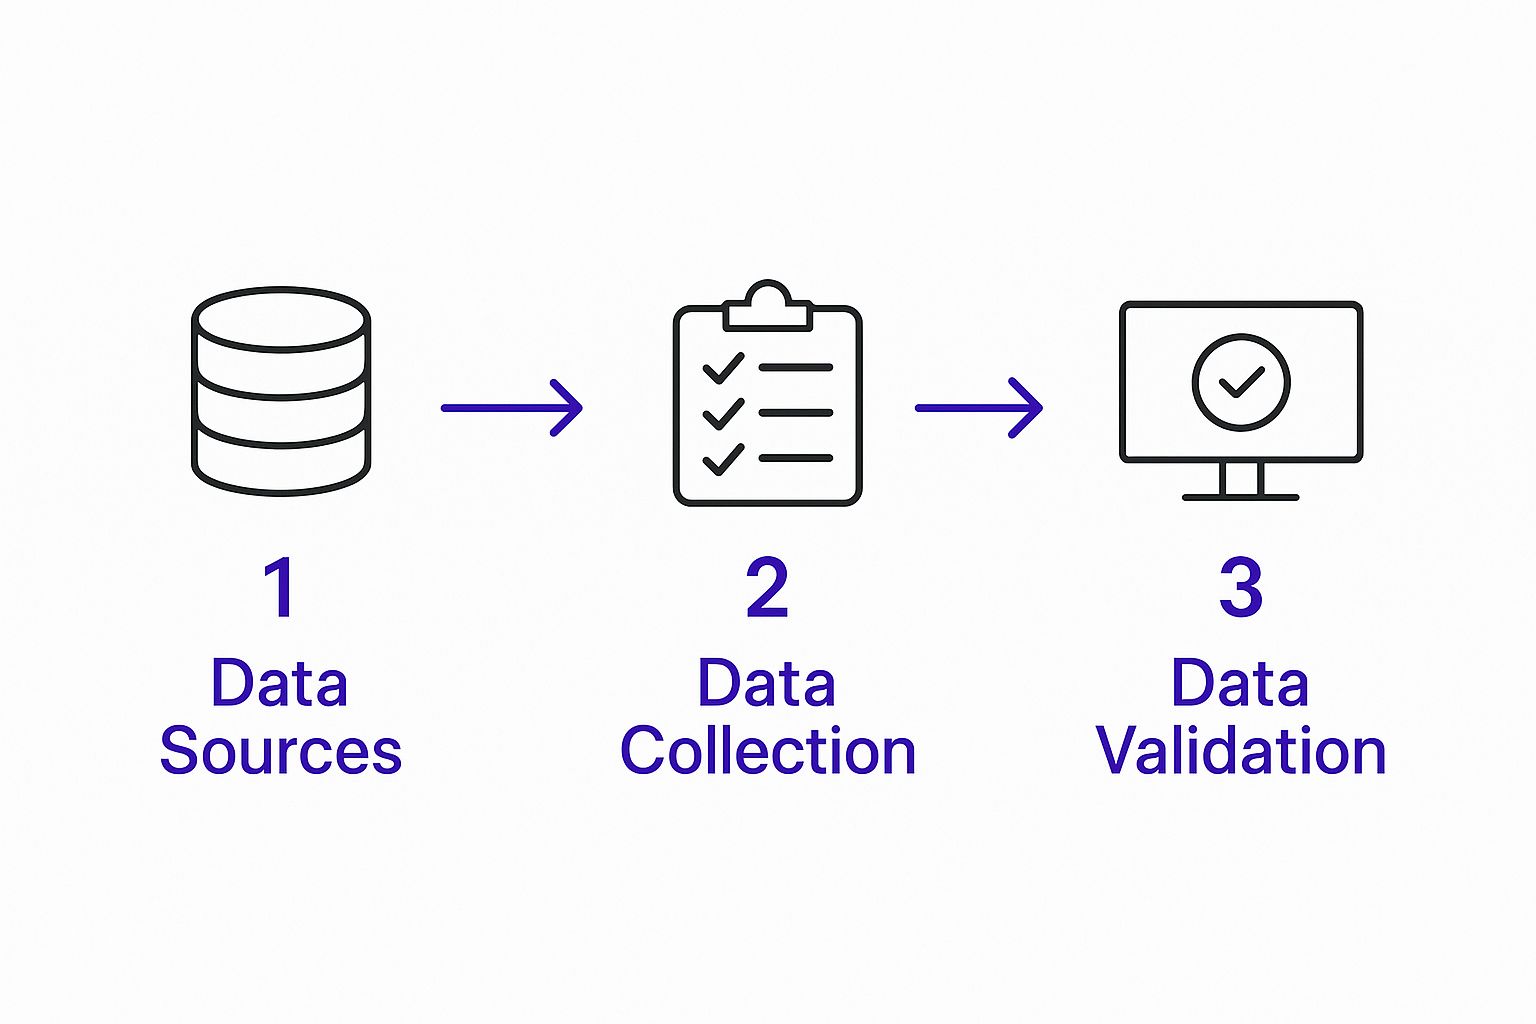
This process—sourcing data, analyzing it, and then validating your findings—is the bedrock of any solid trading strategy. It ensures you're acting on real signals, not just noise.
Gauging Momentum With RSI And MACD
Knowing the trend's direction is half the battle; knowing its strength is the other half. Is that rally about to run out of gas, or does it have room to run? That's where momentum oscillators like the Relative Strength Index (RSI) and the Moving Average Convergence Divergence (MACD) come in handy.
The RSI measures the speed and magnitude of price changes, giving you a score from 0 to 100.
A common rule of thumb is that an RSI reading over 70 means an asset is "overbought" and might pull back, while a reading under 30 suggests it's "oversold" and could be due for a bounce.
But the real trick with RSI is spotting divergence. If the price is hitting a new high but the RSI is making a lower high, that’s a bearish divergence—a huge red flag that the trend's momentum is fading. It’s a classic signal that a reversal might be right around the corner.
The MACD is another go-to indicator that shows the relationship between two different moving averages. When the main MACD line crosses above its signal line, it’s bullish. When it crosses below, it's bearish. I find it’s an excellent tool for confirming the signals I’m already seeing from my moving averages. To see how these play out in real-time, our guide on Bitcoin price prediction tools has some great working examples.
The Undeniable Importance Of Volume
Price and indicators are crucial, but they don't tell the whole story. The missing piece is trading volume. Volume confirms the conviction behind a price move. A huge price jump on barely any volume? That's suspicious and could easily be a trap. But a steady climb in price backed by rising volume? That shows genuine buying pressure and belief in the trend.
A spike in trading volume during an uptrend is a strong sign that the bulls are in control. On the flip side, if you see a price rally happening on declining volume, it’s often a sign of exhaustion—a warning that the trend is weak and might not last.
By layering these tools—moving averages for direction, oscillators for momentum, and volume for confirmation—you build a much more complete picture. You stop guessing and start building a data-driven case for every trade you make. This is what separates hopeful speculators from confident analysts.
Gauging Market Sentiment and Social Narratives
If you think you can master crypto with just charts and macroeconomic data, you're missing half the picture. Sure, technical indicators give you a solid framework, but this market runs on pure emotion, hype, and powerful stories. Trying to trade crypto without understanding crowd psychology is like trying to sail by only looking at a map—you’ll completely miss the hurricane brewing right in front of you.
Honestly, knowing how to identify market trends often boils down to something simple: figuring out what everyone else is thinking and feeling. Market sentiment is just the collective mood of traders, and it can be the single most powerful force behind those insane short-term price swings.
Listening to the Digital Town Square
Platforms like X (formerly Twitter) and Reddit have become the unfiltered, real-time pulse of the crypto world. It's where the seeds of the next big narrative are planted, where projects catch fire, and where fortunes are made and lost in a flurry of memes and hot takes. If you’re not paying attention to these conversations, you’re flying blind.
But you're not just looking for a coin's ticker symbol. You need to dig deeper and understand the story everyone is telling about it.
- Is the chatter all about a groundbreaking tech update or a huge partnership announcement? That’s the sign of a narrative with strong legs.
- Or is it just endless "wen 100x?" and rocket emojis? That usually signals unsustainable hype that’s bound to fizzle out.
- Are the core developers and big names in that ecosystem actually in the trenches, answering the tough questions? That’s what builds real trust and conviction.
This is how you learn to separate a project with genuine momentum from one that’s just being propped up by temporary excitement or, even worse, a coordinated FUD (Fear, Uncertainty, and Doubt) campaign.
I’ve learned over the years that the real alpha isn’t coming from the loudest accounts with a million followers. It’s buried in niche subreddits or deep in specific X threads where the actual builders and early believers are hashing things out. That’s where you hear about what matters, long before it ever hits the mainstream news.
Trying to track all this manually is a recipe for burnout. Luckily, specialized sentiment analysis tools can do the heavy lifting. They scan social media, track how often a coin is mentioned, and even assign a sentiment score—positive, negative, or neutral. It gives you a clean, data-driven overview of how the collective mood is shifting.
Using Google Trends as a Leading Indicator
While social media gives you the crypto-native perspective, Google Trends shows you what the rest of the world is getting curious about. When search interest for "how to buy Bitcoin" or a specific altcoin starts to climb, it’s often a warning sign that a new wave of retail money is about to flood in. It’s a fantastic leading indicator.
Think about it: a slow, steady rise in search volume for a new layer-1 blockchain suggests that genuine, organic interest is building. Compare that to a sudden, vertical spike that appears out of nowhere—that often lines up perfectly with a classic pump-and-dump scheme. By laying search trend data over a price chart, you get a much clearer picture of whether a trend is the real deal or just fleeting hype.
Turning Sentiment into Actionable Strategy
Mastering sentiment is really about spotting the extremes. The famous Fear & Greed Index is a perfect example, rolling multiple data points (including social sentiment) into a single, easy-to-read score of the market's emotional state.
- Extreme Fear: This is often a signal that investors are panicking, which can present a great buying opportunity for those who keep a cool head.
- Extreme Greed: This suggests the market is getting way too euphoric and might be heading for a sharp correction.
By truly understanding the herd, you can learn to do the opposite—be cautious when everyone else is greedy, and start looking for bargains when others are terrified. This psychological edge is what separates traders who just react from those who think strategically.
Beyond crypto, a similar logic applies to broader markets. Macro signals like the Consumer Price Index (CPI) are used to track inflation trends that influence everything. In the digital world, even social media usage itself tells a story. For example, YouTube's explosive growth in India, where top channels now have over 300 million subscribers, shows a clear trend in content consumption that smart businesses are watching closely. You can find more insights like this on Statista.com.
Bringing it back to crypto, high on-chain activity is a fantastic proxy for strong sentiment and network health. A perfect example is Ethereum's transaction fees, or "gas." When gas prices spike, it’s often because demand for the network is surging during a hot NFT mint or a new DeFi token launch. That’s a real-time indicator of a hot trend. Keeping an eye on an ETH gas tracker can give you an invaluable edge, showing you exactly where the market's attention—and money—is flowing at any given moment.
Using vTrader To Automate Your Trend Analysis
Let's be real: trying to manually track dozens of indicators across multiple assets is a surefire way to burn out. Critical patterns and sudden shifts in market sentiment get lost in a sea of spreadsheets and browser tabs. It’s just too much noise for one person to handle.
This is where a tool like vTrader becomes your new best friend. It does the heavy lifting for you, scanning price, volume, and social signals 24/7. This frees you up to actually focus on high-level strategy and managing your positions, not mind-numbing data entry.
Put Your Pattern Detection on Autopilot
Instead of staring at charts waiting for something to happen, vTrader’s algorithms automatically flag classic chart patterns and indicator setups for you. Think moving average crossovers or critical RSI divergences on your favorite coins. You’ll get pinged the moment a bullish golden cross or a bearish death cross materializes.
- Get real-time alerts for 50-day/200-day crossovers across any market you're watching.
- See what the crowd is saying with a sentiment dashboard that pulls in data from X, Reddit, and Telegram.
- Instantly spot unusual activity with volume spike detection.
- Get a heads-up when momentum is fading with RSI divergence notifications.
Build Custom Alerts That Matter to You
You can fine-tune notifications for your specific watchlist with a few simple clicks. Set up filters for volume surges, key moving average crossovers, or sudden spikes in volatility—whatever fits your trading style.
I had a great real-world example of this recently. An ETH volume spike alert I’d set up went off, saving me at least three hours of digging around to figure out why. A massive whale wallet was on the move. That instant heads-up turned a vague gut feeling into a well-timed entry.
Real-time alerts can easily cut your research time by 50% or more, letting you act with confidence instead of hesitation.
| Task | Manual Hours | vTrader Time |
|---|---|---|
| Monitoring moving averages | 4 | < 5 minutes |
| Tracking social sentiment | 3 | < 3 minutes |
| Spotting volume anomalies | 2 | Instant |
Weave Sentiment Analysis Into Your Strategy
Good analysis goes beyond the charts. vTrader gives you a live sentiment feed that takes the pulse of the crypto community. When a big influencer starts tweeting or a Reddit thread catches fire, the platform quantifies that buzz so you can see if it’s real or just noise.
Just last month, this feature helped a client get in early on a new token launch. The tool detected a sudden, massive surge in positive mentions before the pump really took off. They were able to buy ahead of the wave instead of chasing it.
- Track how mention volume is changing over different timeframes.
- Visualize sentiment shifts with simple, easy-to-read bar graphs.
- See which accounts are driving the positive or negative conversations.
A Single Dashboard to Track Everything
All your alerts, key metrics, and charts live in one clean, unified panel. No more jumping between a dozen different apps. You can filter everything by asset, timeframe, or signal type to stay completely focused on what’s important.
It also supports custom watchlists and even lets you draw your trendlines directly on the charts. Your entire workflow—from spotting a signal to analyzing it—happens in one place.
To get a feel for the full suite of tools, it’s worth checking out the official vTrader exchange page.
Customize Your Workflow for Any Market
From my own experience, having ready-made templates for different market conditions is a game-changer. vTrader lets you save your alert presets for bull markets, bear markets, and those choppy sideways periods, all accessible with a single click.
- Save filter presets for things like RSI dips, moving average breaks, or volume surges.
- Quickly backtest your signal ideas against historical data to see how they would have performed.
- Export your alert history to a CSV file for more detailed post-trade analysis.
Quick Case Study
Back in March 2024, a client was using vTrader to find confirmation for an altcoin breakout he was eyeing. The platform flagged a crucial moving average crossover and, within hours, a 120% spike in positive sentiment.
Putting those two signals together gave him the confidence to enter at 0.00025 BTC right before the coin shot up 35%. Afterward, he used the exported logs from the trade to tweak his alert settings for the next one.
Using concrete data from automated alerts is how you turn a gut feeling into a repeatable, winning strategy.
Best Practices to Get the Most Out of It
To avoid getting overwhelmed, always make sure your alerts are aligned with your personal risk tolerance and how long you plan to hold a position. Every so often, it’s a good idea to review your alerts and turn off the ones that aren’t performing well to cut down on the noise.
- Check your alert performance weekly and prune any that are giving you false positives.
- Always look for multiple confirmations before pulling the trigger on a trade.
- Keep your watchlists tight and focused to avoid alert fatigue.
- Get vTrader notifications sent straight to your phone for instant updates.
At the end of the day, remember that automation is a tool to support your judgment, not replace it. By letting vTrader handle the grunt work, you gain a massive edge in identifying market trends without drowning in data.
How to Integrate Alerts Into Your Daily Routine
These automated signals are most powerful when they’re a core part of your trading process. Create a simple checklist that you run through every single time an alert fires. This builds discipline.
- First, review the context. What does the chart look like? Is there any breaking news?
- Next, confirm the signal with at least one other indicator you trust.
- Finally, make sure you log your entry and exit points to track your performance.
Building this simple process helps you stay disciplined and avoid making impulsive mistakes. Over time, merging smart automation with a clear plan is what will sharpen your edge and show you how to identify market trends consistently.
Common Questions About Market Trend Analysis
Even with a solid game plan, jumping into market analysis can stir up a lot of questions. Figuring out how to identify market trends is a skill you build over time, and it's totally normal to hit some confusing spots along the way. Let's break down some of the most common hurdles traders run into when they're getting their feet wet.
How Much Data Do I Need to Confirm a Trend?
This is the classic question, and the honest answer is, it really depends on the trend you’re trying to catch. If you’re hunting for a long-term primary trend, you should be looking at several months, if not a full year's worth of price action. That’s the only way to get the context you need to see if you’re in a real bull or bear market.
For shorter-term secondary trends, like a correction that lasts a few weeks, you might only need a couple of months of data to see the pattern form. A good rule of thumb is to pull up enough data to see at least two or three previous swings—this gives you a feel for how that particular asset usually behaves.
The single biggest mistake I see is traders trying to call a major, long-term trend based on just a few days of data. Patience is everything here. Let the trend actually prove itself over a meaningful amount of time before you go all in.
Technical or Fundamental Analysis: Which Is Better?
The sharpest traders I know don't pick sides—they use both. Think of it this way:
- Fundamental analysis (including all that macro data) tells you why a trend might be happening in the first place. It’s all about the big-picture stuff, like an asset's real value and the overall health of the economy.
- Technical analysis tells you when that trend is actually picking up steam. It helps you nail down your entry and exit points by looking at price and volume.
If you rely on just one, you’re trading with a massive blind spot. An asset with rock-solid fundamentals but a terrible-looking chart is a huge red flag. The same goes for a beautiful chart pattern on a project with zero actual utility—that’s a classic trap. The real magic happens when you find a setup where both sides of the coin are telling you the same story.
What if Different Indicators Give Me Conflicting Signals?
This happens constantly, and it's usually a sign that the market has no idea what it wants to do. You might see your moving averages screaming "uptrend!" while the RSI is flashing a major bearish divergence, hinting that all the momentum is fizzling out.
When you start seeing mixed signals, the smartest move is often to just sit on your hands. Wait for things to become clearer. A confused market is a choppy market, and that’s a quick way to get your account chopped to pieces. Don't try to force a trade when the charts aren't giving you a clean, unified message.
How Do I Know if a Trend Is Losing Steam?
Spotting the end of a trend is just as crucial as spotting the beginning. One of the most reliable signs that a trend is getting tired is divergence. This is when the price is still grinding out new highs, but a momentum indicator like the RSI or MACD is making lower highs. It’s a dead giveaway that the energy driving the move is running out.
Another massive red flag is declining volume. If the price is creeping higher but fewer and fewer traders are participating (which you’ll see as lower trading volume), that’s a sign of pure exhaustion. The trend is basically running on fumes and is incredibly vulnerable to a sharp reversal as soon as the last few buyers are done.
Ready to stop guessing and start using a data-driven approach to spot your next big trade? vTrader gives you the automated tools you need to analyze trends, set custom alerts, and make confident decisions without the manual work. Explore the vTrader platform today!

Steve Gregory is a lawyer in the United States who specializes in licensing for cryptocurrency companies and products. Steve began his career as an attorney in 2015 but made the switch to working in cryptocurrency full time shortly after joining the original team at Gemini Trust Company, an early cryptocurrency exchange based in New York City. Steve then joined CEX.io and was able to launch their regulated US-based cryptocurrency. Steve then went on to become the CEO at currency.com when he ran for four years and was able to lead currency.com to being fully acquired in 2025.