Ever heard someone on the news mention a “bull” or “bear” market and wondered what they were talking about? It's simpler than it sounds. Think of it this way: a bull market is when prices are on an upward charge, like a bull thrusting its horns up. On the flip side, a bear market is when prices are swiping downward, just like a bear's paw.
These two phases are the heartbeat of every financial market, from traditional stocks all the way to crypto.
What Are Bull and Bear Markets Explained Simply

Technically speaking, traders have a specific rule of thumb. A market is usually called a bull market after it climbs 20% from a recent bottom. In contrast, a bear market is declared when it drops 20% from a recent peak.
But those numbers are just a guideline. The real force driving these massive swings is human psychology.
Bull markets are fueled by confidence. Positive economic news, growing company profits, and a general sense of optimism create a feedback loop where everyone wants to buy, pushing prices even higher. It’s a classic case of FOMO (Fear Of Missing Out).
Bear markets are the exact opposite. They’re driven by fear and uncertainty. Bad news, economic slowdowns, and general pessimism cause investors to get defensive. They start selling to protect their capital, which creates a domino effect of falling prices.
Key Takeaway: While the 20% rule gives us a number to watch, the true driver is market sentiment. Bull markets run on collective optimism and greed. Bear markets are defined by widespread fear and a rush for the exits.
Bull vs Bear Market At a Glance
To really get a handle on this, it helps to see the core differences side-by-side. This table breaks down the defining characteristics of each market environment.
| Characteristic | Bull Market | Bear Market |
|---|---|---|
| Price Trend | Sustained upward movement | Sustained downward movement |
| Investor Psychology | Optimism, confidence, greed | Fear, pessimism, caution |
| Economic Outlook | Strong, growing economy | Weak, contracting economy |
| Trading Volume | Tends to be high on upswings | Tends to be high on downswings |
| Investor Action | Eager to buy, high demand | Rushing to sell, high supply |
This quick comparison makes it easy to see how these two market phases are polar opposites.
Understanding this fundamental push-and-pull is the first step toward trading intelligently instead of reacting emotionally. Recognizing which market you're in helps you adjust your strategy, manage risk, and spot opportunities others might miss.
For a deeper look into the specific signals traders use, our guide on how to identify market trends is a great next step. Once you nail these basics, you’ll be in a much better position to navigate whatever the market throws at you.
Understanding the Psychology Behind Market Cycles
So, what really makes markets swing from wild highs to crushing lows? While economic data and charts give us the "what," human psychology tells us the "why." Markets aren't just tickers and numbers; they're giant arenas where human emotions like fear and greed are constantly at war.
This emotional tug-of-war is the engine behind bull and bear markets. If you really want to explain bull and bear market behavior, you have to look past the charts and into the minds of traders and investors.
The Bull Market Fueled by Optimism
In a bull market, good vibes create a powerful feedback loop. It usually starts with some good news—strong economic reports or a breakthrough technology. Prices start ticking up.
This catches people's attention, and the fear of missing out, or FOMO, kicks in hard. Suddenly, everyone wants a piece of the action. This creates a herd mentality where people jump in not because of solid research, but simply because everyone else is. Logic gets tossed aside for irrational exuberance, a dangerous belief that prices will only ever go up.
Investor Insight: During a bull run, you'll hear the phrase "this time is different" a lot. Investors start ignoring obvious warning signs, convincing themselves the old rules don't apply. This mindset is what makes the eventual fall so much more painful.
This wave of collective greed is a measurable force. If you're curious about tracking this, the Crypto Fear and Greed Index is a fantastic tool for seeing how sentiment swings from one extreme to the other.
The Bear Market Driven by Fear
On the flip side, bear markets are powered by a sudden and violent shift from optimism to pure fear. All it takes is one negative event—an unexpected interest rate hike or a major company going under—to pop the bubble.
As prices begin to fall, the mood flips instantly. Fear, uncertainty, and doubt—what traders call FUD—spread like wildfire. The same herd mentality that drove prices to the moon now sends them crashing back to earth as waves of panic selling begin. People who bought at the top scramble to get out and cut their losses, pushing prices down even faster.
This emotional spiral often pushes prices far below what they’re actually worth. Just like greed inflates assets beyond their real value in a bull run, fear can drag them way below it in a bear market. It’s this human overreaction at both ends that creates the dramatic cycles we see time and time again. Getting a grip on this is key to surviving both the climb and the inevitable fall.
How to Identify a Bull Market in Action
Spotting a bull market before everyone else jumps on board is about more than just seeing green on your screen. Sure, the official definition is often a 20% rise from a market bottom, but a real, sustainable uptrend leaves a trail of clues for traders who know what to look for.
These signals aren't just about price action; they combine technical chart patterns with the health of the real-world economy. Learning to read them helps you tell the difference between a fleeting relief rally and the genuine start of a powerful, long-term bull run.
Technical Signals to Watch
Technical analysis is your lens for seeing shifts in market momentum. As a bull market starts to take shape, certain patterns emerge on the charts that scream growing strength and buyer conviction.
Here are a couple of the big ones:
- The Golden Cross: This is a classic bullish signal that gets a lot of traders excited. It happens when a shorter-term moving average (like the 50-day) punches up through a longer-term one (like the 200-day). This crossover suggests that recent momentum is finally overpowering the old, long-term trend, often signaling that a major price surge is on the way.
- Higher Highs and Higher Lows: A healthy uptrend never moves in a straight line—it climbs like a staircase. You'll see it form a pattern of rising peaks and troughs, which shows that buyers are consistently stepping in to buy the dips, refusing to let the price fall back to its old lows.
Learning to spot these visual cues is a core trading skill. To go a bit deeper, check out our guide on the differences between a bearish flag vs bullish flag pattern to really understand how these momentum patterns build up.
Trader's Tip: Volume is your confirmation tool. A price breakout that happens on high trading volume is far more convincing than one on low volume. It tells you there's real money and belief behind the move.
Fundamental and Economic Indicators
Charts tell one part of the story, but the real economy provides the fuel for any lasting bull market. A strong economic backdrop gives companies room to grow and boosts investor confidence, creating a positive feedback loop.
If you want an edge, you need to understand what are considered the leading economic indicators for the stock market. These are the real-world signs that things are heading in the right direction:
- Strong Corporate Earnings: When companies are consistently crushing their earnings reports and giving optimistic forecasts, it’s a clear sign the economy is humming along.
- Rising Employment: Low unemployment and steady job growth mean people have more money in their pockets. That extra cash drives consumer spending and powers the whole economic engine.
- High Consumer Confidence: When people feel good about their financial future, they’re more willing to spend and invest. This optimism is like pouring gasoline on a fire.
And history shows that bull markets are the market’s default state. Looking at the S&P 500, bull markets last an average of 3.7 years and deliver an average gain of 150%. One legendary run between 1947 and 1957 saw the market surge an incredible 495%.
Recognizing the Warning Signs of a Bear Market

Bear markets don't just appear overnight. Much like a storm brewing on the horizon, they send out warning flares long before they make landfall. Learning to spot these signals is what separates proactive traders from those caught off guard by the downturn.
The clues aren't just buried in price charts; they're tied to the health of the entire economy. While the official definition of a bear market is a decline of 20% or more from a recent high, the writing is usually on the wall much sooner. Spotting these signs early helps you figure out if you're looking at a temporary dip or the start of a long, cold crypto winter.
Key Technical Indicators of a Downturn
Technical analysis is your early warning system. When the market’s bullish energy starts to run out of steam, specific patterns emerge on the charts that act as a clear heads-up for anyone paying attention.
Here are two of the most important signals to watch for:
- The Death Cross: It sounds dramatic for a reason. This pattern is the polar opposite of the golden cross and shows up when a short-term moving average (like the 50-day) slices down through a long-term one (like the 200-day). This crossover is a powerful signal that recent selling has finally broken the back of the long-term uptrend, often leading to a much steeper decline.
- Lower Highs and Lower Lows: A healthy uptrend consistently prints higher highs and higher lows. But when the market starts to weaken, you'll see it fail to break previous peaks and begin carving out new, lower bottoms. This "staircase down" pattern is a textbook sign of a trend losing its strength, showing that sellers are now in control.
These chart patterns are your confirmation that the tide is turning. For a closer look at specific candle formations, our guide on trading the bearish pin bar can give you an edge in spotting short-term reversals.
Macroeconomic Warning Signs
Charts tell you what is happening, but the economy tells you why. Bear markets are almost always rooted in real-world economic trouble.
Investor Alert: A steady drumbeat of negative economic news is the fuel that powers a bear market. When the fundamentals sour, investor confidence evaporates, leading to the kind of sustained selling that chart patterns alone can't fully explain.
Keep an eye on these fundamental red flags:
- Rising Inflation and Interest Rates: When central banks start hiking interest rates to combat inflation, it chokes off growth by making money more expensive for everyone. This can easily slam the brakes on the economy and trigger a recession.
- Declining Corporate Profits: Watch company earnings reports. If major companies are consistently reporting lower profits and warning about tough times ahead, it’s a massive red flag. This directly hits stock valuations and sends investors running for the exits.
Historically, bear markets are shorter and more vicious than bull runs. The S&P 500 has weathered 27 bear markets since 1928, lasting an average of just 9.6 months but wiping out an average of 31% in value. For a deeper historical perspective, you can find more data on bear market history from hartfordfunds.com.
Practical Strategies for Trading in Any Market
Knowing how to explain bull and bear markets is one thing. Knowing how to act is something else entirely. Your game plan has to shift with the market’s mood, helping you build wealth when things are hot and protect your capital when they turn cold.
Honestly, emotional discipline is your greatest asset. It's what keeps you from piling in at the top out of greed or panic-selling at the bottom. A clear, pre-defined plan is what separates successful traders from the rest—it keeps you grounded, no matter the market weather.
Strategies for a Bull Market
When optimism is high and prices are on a steady climb, the goal is simple: maximize your growth without getting swept up in the hype.
- Dollar-Cost Averaging (DCA): This is a classic for a reason. You invest a set amount of money at regular intervals—say, weekly or monthly. It smooths out your average entry price and stops you from making the dreaded mistake of going "all-in" right at the peak.
- Buy the Dips: In a healthy uptrend, pullbacks are normal and usually present fantastic buying opportunities. Instead of chasing a coin that's gone vertical, wait for those temporary dips to either enter a new position or add to an existing one.
Strategies for a Bear Market
During a bear market, the mission changes. It’s no longer about aggressive growth; it’s about protecting your capital and strategically accumulating assets for the next cycle. This is where future fortunes are often built.
For anyone trying to navigate a downturn, exploring proven bear market investing strategies can be a game-changer, helping you defend your portfolio while spotting new opportunities.
A few key defensive moves include:
- Build a Cash Reserve: Holding a good chunk of your portfolio in cash or stablecoins isn't boring—it's smart. It gives you the ammunition to buy quality assets at a massive discount when sentiment finally starts to shift.
- Shift to Lower-Risk Assets: This could mean reallocating funds into less volatile assets or established, "blue-chip" cryptocurrencies that have a proven track record of surviving market storms.
- Hedge Your Positions: More advanced traders might use strategies like short selling to profit from falling prices, which can help offset losses in their long-term holdings.
Trader's Takeaway: A bear market isn't a signal to run away; it's a time to get strategic. The assets you patiently accumulate when prices are beaten down become the foundation of your portfolio for the next bull run.
Ultimately, every single trade boils down to how well you manage risk. When you define your entry and exit points ahead of time and actually stick to them, you take emotion out of the equation. Understanding the risk-reward ratio in trading is absolutely essential for long-term success, as it forces you to ask if the potential gains are truly worth the risks you're taking.
Bull and Bear Cycles in Stocks and Crypto
Theory is one thing, but to really get a feel for bull and bear markets, you have to look at how they’ve played out in the real world. History is packed with examples of these cycles, showing how a potent mix of economic conditions and raw human emotion can create spectacular booms and crushing busts.
Whether you're looking at traditional stocks or the wild world of crypto, the patterns are surprisingly similar. The euphoria, the greed, the panic, the despair—it all repeats, just with different assets and on different timelines.
Lessons From Stock Market History
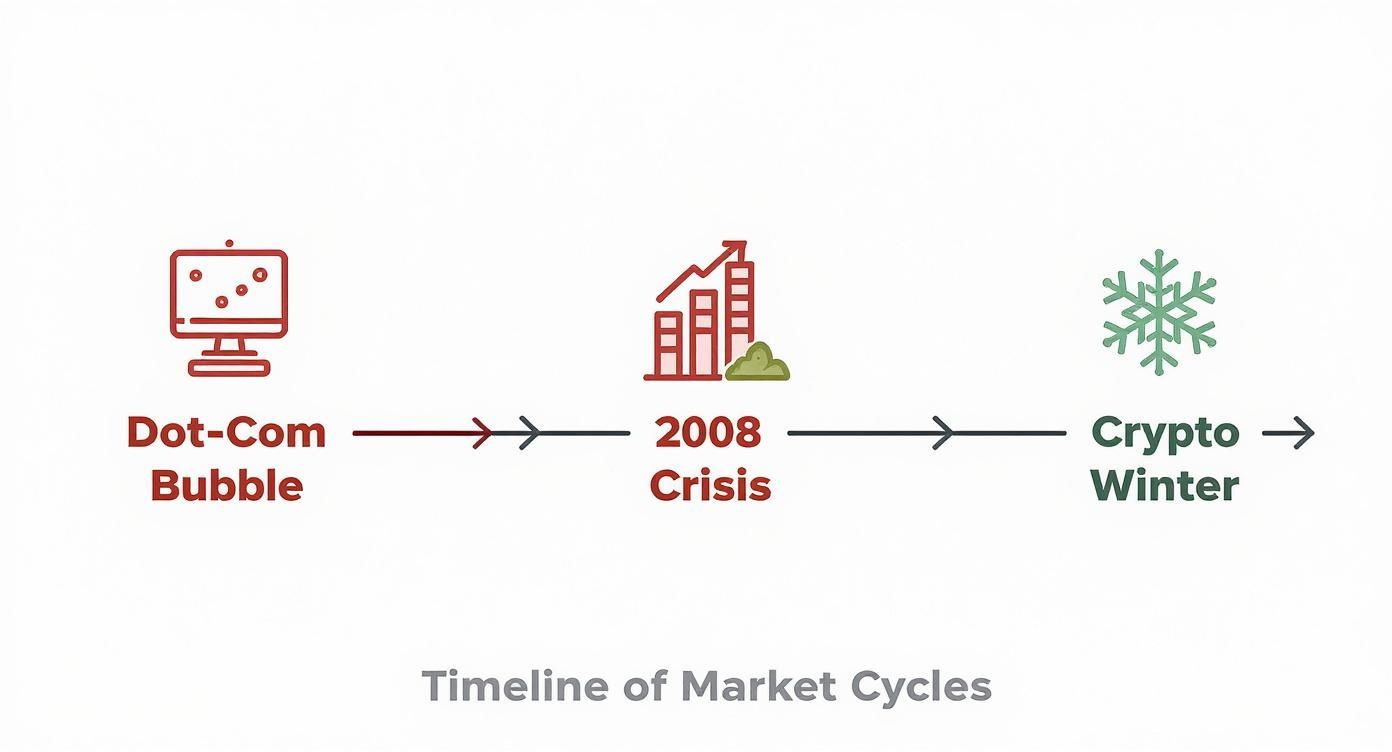
The stock market is our best history book for these cycles. Take the dot-com bubble of the late 1990s. It was a classic bull market, driven by pure, unadulterated hype over the new internet age. When that bubble popped, it was devastating.
On the flip side, look at the incredible bull market that climbed out of the rubble of the 2008 financial crisis. It was born from peak pessimism but grew into one of the longest bull runs in history, thanks to low interest rates and a slow, steady economic recovery.
You can see how these major cycles, including crypto’s own downturns, have unfolded over time.
The chart makes it clear: markets are cyclical. Periods of sharp, painful decline have always been followed by recovery and sustained growth. It's a rhythm that has repeated for decades.
Crypto's Hyper-Accelerated Cycles
The crypto market follows the same script—bulls charge, and bears maul—but everything happens faster and with way more volatility.
The 2017 Bitcoin bull run is the perfect case study. Pure FOMO drove BTC from under $1,000 to nearly $20,000 in just one year. What followed was the infamous 2018 "crypto winter," a brutal, drawn-out bear market that saw prices collapse by over 80%. It was a washout that tested the conviction of even the most dedicated believers.
Key Insight: Whether it's stocks or crypto, the core drivers are the same: human psychology and economic fundamentals. Crypto cycles are just the same story on steroids, offering both greater risk and the potential for much bigger rewards.
The data backs this up. Over the past 92 years, we've seen 33 bull and bear cycles in the stock market. The average bull market has lasted nearly 51 months, delivering a 175% gain. In contrast, the average bear market was over in about 15 months with a 31% decline. You can dig deeper into these historical trends over on the Russell Investments' blog.
Common Questions About Market Cycles
If you’ve spent any time in the markets, you know the same questions pop up again and again. Getting a handle on these key concepts is crucial for building the confidence to trade, whether the market is roaring ahead or pulling back.
Let's clear up some of the most common points of confusion around bull and bear markets.
How Long Do Bull and Bear Markets Typically Last?
This is the million-dollar question for anyone trying to plan ahead. History gives us a pretty clear picture: bull markets have way more stamina.
- On average, a bull market can run for several years, with some legendary runs lasting over a decade.
- Bear markets, on the other hand, tend to be nasty but short-lived, typically lasting around 9 to 10 months.
Of course, these are just averages. The real driver behind any market cycle is the underlying economic story, and that’s what determines how long the trend will stick around.
What Is the Difference Between a Correction and a Bear Market?
It’s all about the intensity. Both involve red on the screen, but one is a brief storm while the other is a full-blown ice age. Think of a correction as a healthy rinse-out, while a bear market signals a deep, painful freeze.
A market correction is a drop of 10% to 20% from a recent high. They’re often quick, shaking out the nervous hands before the bigger uptrend continues. A bear market is a much deeper, more punishing downturn of 20% or more, telling you that the fundamental economic outlook has soured.
Can a Bull Market Occur During a Recession?
It sounds completely backward, right? But yes, it happens more than you’d think. You have to remember that the stock market is a forward-looking machine. It doesn't trade on today’s news; it trades on where investors think the economy will be six to twelve months from now.
A new bull run can kick off while the economy is still officially in a recession because smart money is already betting on a recovery. This is exactly what traders mean when they say the market is "climbing a wall of worry."
Which Strategy Is Best for a Beginner?
For anyone just starting, trying to perfectly time the market tops and bottoms is a fast track to stress and losses. A much saner and more effective approach is dollar-cost averaging (DCA).
The strategy is simple: you invest a fixed amount of money at regular intervals—say, every week or month—no matter what the price is doing. This takes the emotion out of buying, smooths out your average entry price, and builds the kind of disciplined habits that lead to long-term success.
Ready to apply these strategies with zero trading fees? vTrader provides the real-time data, instant alerts, and advanced tools you need to trade confidently in any market cycle. Start building your portfolio with vTrader today.

Steve Gregory is a lawyer in the United States who specializes in licensing for cryptocurrency companies and products. Steve began his career as an attorney in 2015 but made the switch to working in cryptocurrency full time shortly after joining the original team at Gemini Trust Company, an early cryptocurrency exchange based in New York City. Steve then joined CEX.io and was able to launch their regulated US-based cryptocurrency. Steve then went on to become the CEO at currency.com when he ran for four years and was able to lead currency.com to being fully acquired in 2025.