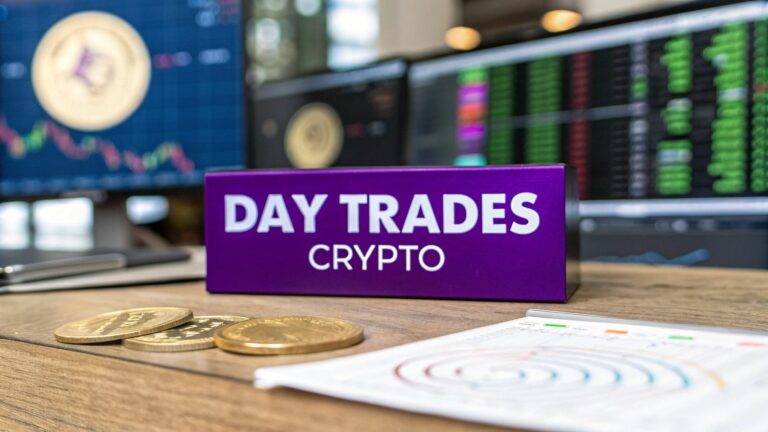
Day trading in the crypto world is all about speed. You're buying and selling digital assets within the same day, aiming to pocket profits from those tiny, fleeting price jumps. It’s a game of capitalizing on market volatility, and while the opportunities are massive, jumping in without a solid game plan is a recipe for disaster. Success here isn't about luck—it's about preparation.
Building Your Foundation for Day Trading Crypto
Before you even think about placing your first trade, you need to get a firm grip on the two forces that dictate everything in the crypto market: liquidity and volatility. These aren't just fancy terms; they're the very currents you'll be navigating. Understand them, and you can ride the waves. Ignore them, and you'll get swept away.
Understanding Liquidity and Volatility
Liquidity is simply how easily you can buy or sell a crypto asset without tanking its price. For a day trader, high liquidity is everything. It means there are tons of buyers and sellers ready to go, which translates to tighter spreads—that little gap between the buy and sell price. More importantly, it ensures you can get in and out of your trades instantly at the price you expect.
Volatility, on the other hand, measures how wildly a crypto's price swings. This is the double-edged sword of day trading. High volatility is what creates the profit opportunities we're all chasing, but it's the same force that can lead to lightning-fast losses. The goal isn't to find the most volatile coin, but to find one with predictable movement that aligns with your trading strategy.
Key Takeaway: The sweet spot for day trading is finding assets with both high liquidity and manageable volatility. This combo lets you execute trades smoothly while giving you enough price action to actually make a profit.
Why Choosing the Right Trading Pair Matters
Picking a trading pair just because it's trending is a classic rookie mistake. A pro's selection process always starts with analyzing an asset's trading volume, which is a direct signal of its liquidity. The numbers don't lie. With global crypto trading volume now blowing past $2.8 trillion a month, there's plenty of action to go around.
Bitcoin, for example, is a perennial favorite for a reason. Its 24-hour trading volume often hovers around a staggering $38.9 billion, as noted by platforms like CoinLaw.io. That’s the kind of deep liquidity that allows for effective, large-scale day trading.
Before you start trading, it’s crucial to understand a few core concepts that will directly impact your success.
Key Trading Concepts At a Glance
| Concept | Why It Matters for Day Traders | vTrader Tool to Use |
|---|---|---|
| Trading Volume | Indicates high liquidity and interest. The higher the volume, the easier it is to enter and exit trades without major price slippage. | Real-Time Volume Indicators |
| Market Depth | Shows the current supply and demand for an asset. It helps you see how large orders might impact the price. | Market Depth Charts |
| Bid-Ask Spread | The difference between the highest price a buyer will pay and the lowest price a seller will accept. A tight spread means lower trading costs. | Live Order Book |
| Slippage | When you get a different price than you expected on an order. This happens in low-liquidity markets and can eat into your profits. | Limit Order Functionality |
Mastering these ideas is non-negotiable for anyone serious about day trading.
This is where having the right toolkit makes all the difference. vTrader’s platform gives you an immediate edge with its real-time volume indicators and market depth charts, letting you spot assets with enough liquidity to support your strategy. You can stop guessing and start making data-backed decisions on which pairs, like BTC/USDT or SOL/USDT, have the best conditions for your trades.
To get a deeper understanding of these foundational principles, be sure to check out the resources over at the vTrader Academy.
https://www.vtrader.io/en-us/academy
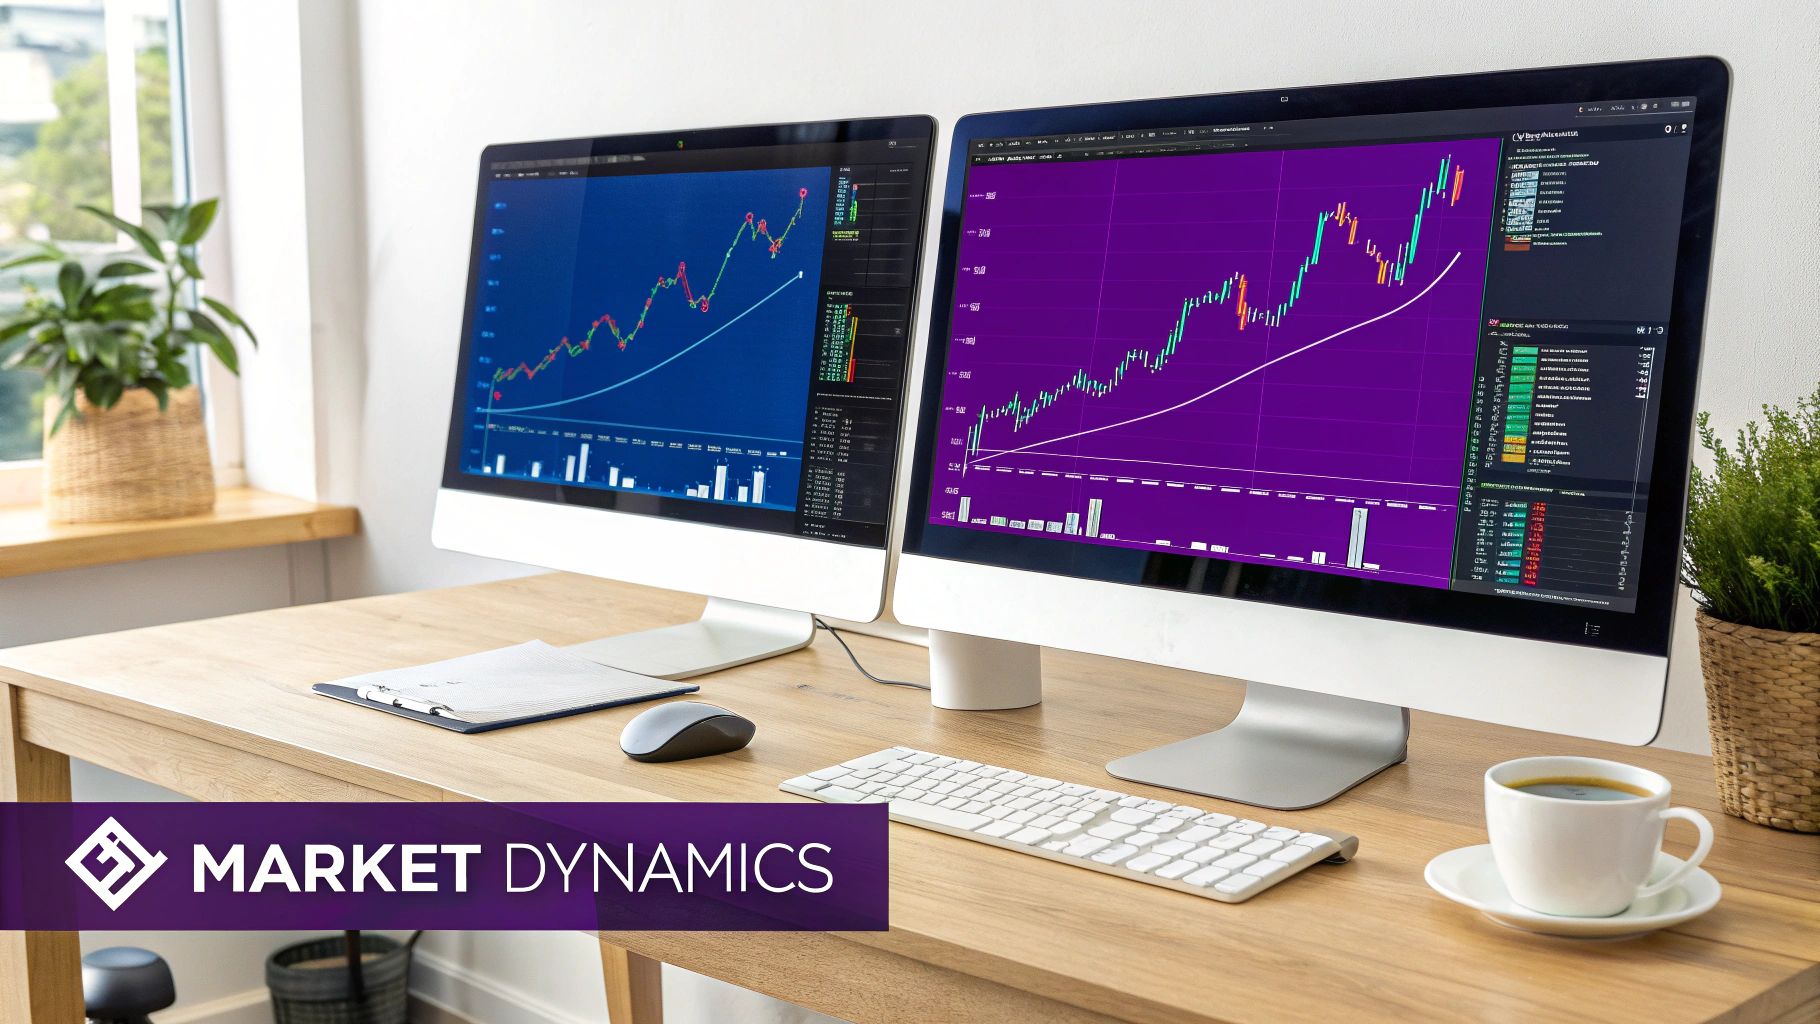
Designing Your vTrader Dashboard for Peak Performance
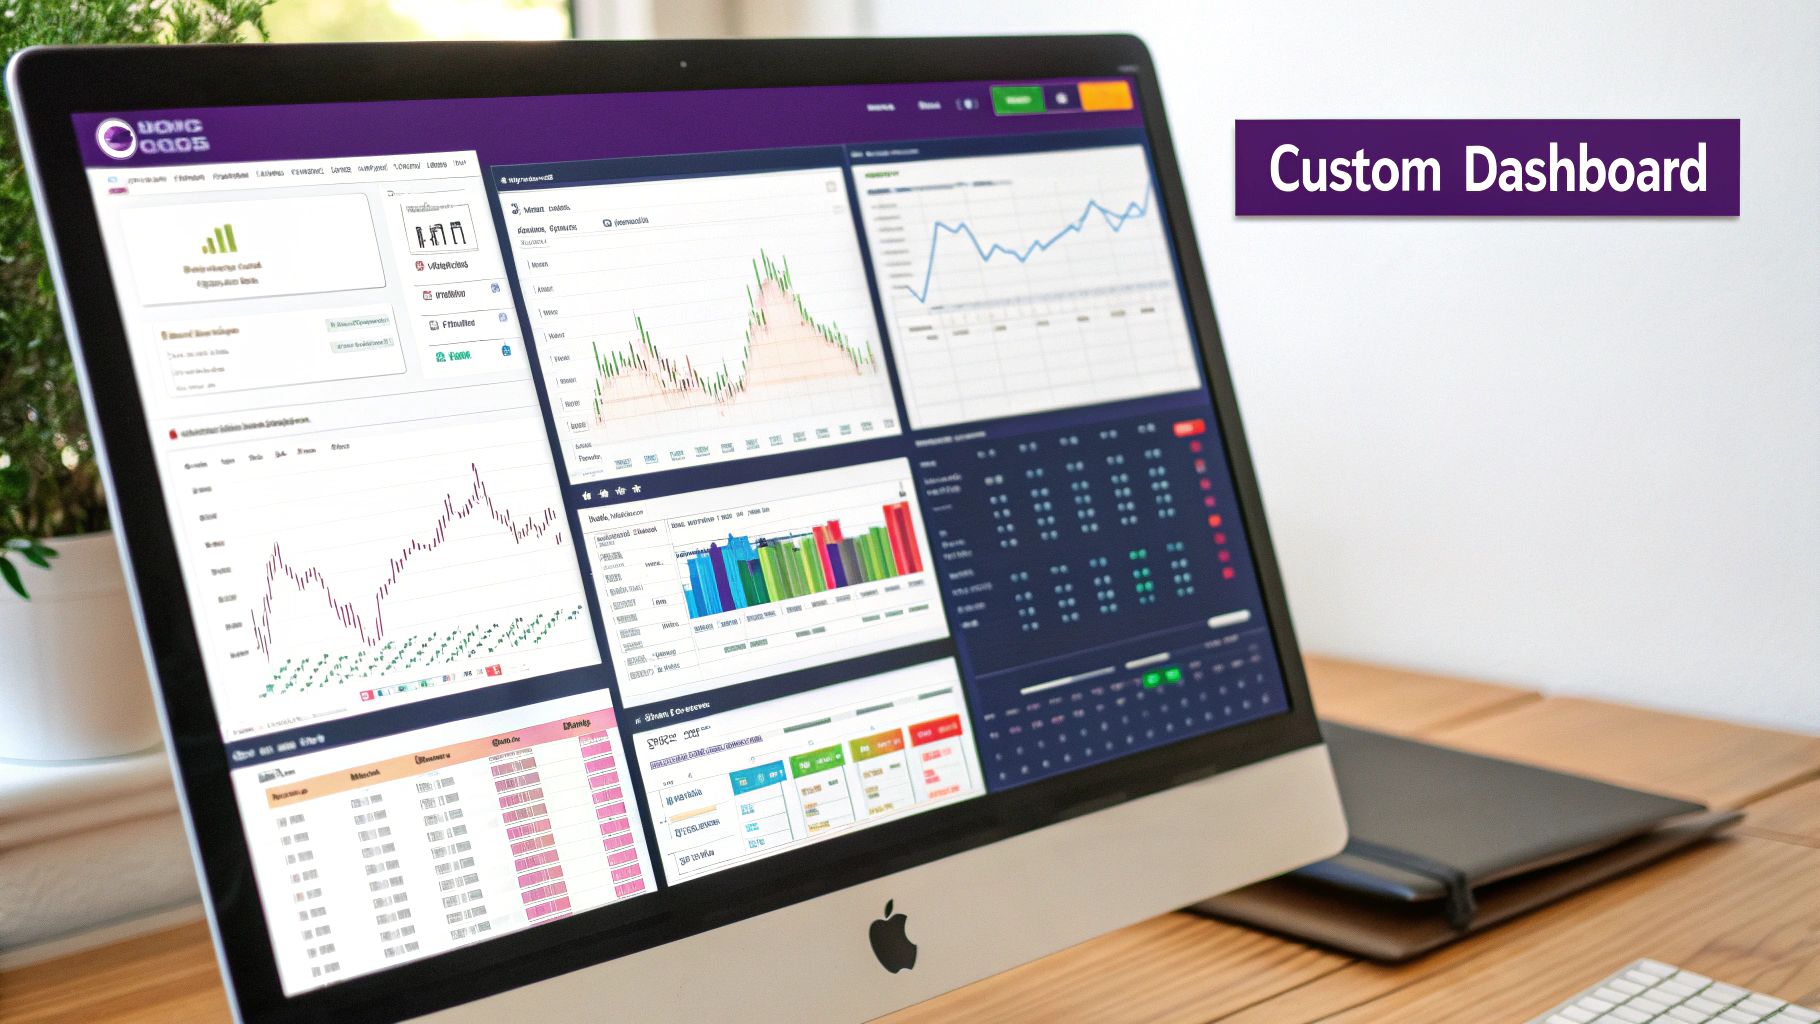
When you’re day trading crypto, your dashboard is more than just a screen—it's your command center. Trusting the default layout is a rookie mistake. It's like taking a family sedan to a Formula 1 race; you'll get around the track, but you won't be winning any prizes. To get a real edge, you have to customize your vTrader workspace until every single piece of information serves a purpose and is right where you need it.
A cluttered screen packed with a dozen flashy indicators is a one-way ticket to analysis paralysis. The real goal is a clean, hyper-efficient setup that lets you pull the trigger on a trade without a moment's hesitation. That means stripping away the noise and focusing only on the charts and data that matter to your strategy.
Building Your Multi-Timeframe View
First things first, get out of the single-chart mindset. Any seasoned trader will tell you they’re constantly watching multiple timeframes. This gives you the full story—the broad market context and the microscopic entry points. vTrader makes setting up a multi-chart layout dead simple.
For a popular pair like SOL/USDT, a classic and incredibly effective setup is a three-chart view:
- The 1-hour (1H) chart: This is your compass. It shows you the dominant intraday trend. Is the market grinding up, sliding down, or just chopping sideways? This high-level view keeps you from fighting the current.
- The 15-minute (15M) chart: Now we’re zooming in. On this timeframe, you can spot more immediate patterns, consolidation zones, and potential breakout levels as they form.
- The 1-minute (1M) or 5-minute (5M) chart: This is where the action happens. Once your higher timeframes give you the green light, you use this chart to nail your entry and exit with precision.
This layered approach gives you a complete narrative of the price action, dramatically cutting the odds of getting blindsided by a sudden reversal.
Adding Essential Indicators and Alerts
With your charts in place, it’s time to layer on a few key indicators. And I mean few. For the fast-paced crypto market, you really only need a couple of solid tools—a momentum oscillator and a trend-following indicator will do the trick for most strategies.
A well-designed workspace eliminates noise and puts critical decision-making data front and center. Your dashboard should serve your strategy, not distract from it.
A great starting point is adding the Relative Strength Index (RSI) to spot overbought or oversold conditions and the Moving Average Convergence Divergence (MACD) to gauge shifts in momentum. The beauty of vTrader is you can tweak the settings on these, making them more sensitive to crypto’s notorious volatility.
Finally, put smart alerts to work for you. Don't just sit there staring at the screen. Set up alerts in vTrader to ping you when a price hits a key support or resistance level, or when the RSI dips into an extreme zone. Think of these alerts as your personal trading assistant, freeing you up to scan the market without being chained to your desk.
Executing Your First Crypto Day Trades in vTrader
You’ve got your dashboard set up and you’re ready to go. Now it’s time to jump in and put your analysis to the test. This is where all that prep work pays off, turning those lines on a chart into real, decisive action.
Making your first few day trades crypto can feel like a high-wire act, but with a solid process, it becomes less about guts and more about skill.
Let’s walk through a classic scenario that plays out all the time: trading a breakout on a fast-moving pair like SOL/USDT after it’s been stuck in a tight range. This setup gives a clear signal to act, making it a go-to strategy for countless day traders.
Nailing the Entry with Pattern Recognition
It all starts with spotting the setup. In our example, imagine SOL/USDT has been chopping sideways for the past hour, unable to push higher or lower. This is consolidation. Luckily, vTrader’s pattern recognition tool can flag these formations for you, often labeling them as a "rectangle" or "flag."
That’s your cue to zoom in. A breakout is what happens when the price finally punches through the top (resistance) or drops below the bottom (support) of that range. Let's say the price suddenly rips higher on a surge of volume. That alert you set earlier goes off—it’s go time.
Placing Orders with Purpose
You've got the signal, but how do you get in? You have two main choices: a market order or a limit order.
- Market Order: This is your "get me in now" button. It fills your trade instantly at the best available price. For a sharp breakout, this is often the right move because every second counts. The only catch is potential slippage, where the price you get is slightly different from what you saw on screen.
- Limit Order: This lets you name your price. You could set a buy-limit order just a hair above the old resistance level. This ensures you don’t chase the price and overpay if it spikes too aggressively.
For our SOL/USDT breakout, a market order is probably the best bet. You need to get in the trade while the momentum is hot.
A trade isn’t finished once you’re in. Your stop-loss and take-profit orders are the most important part of the entire process. They define your risk and your reward before your emotions can get in the way.
Setting Your Stop-Loss and Take-Profit
This is non-negotiable. It’s what keeps you in the game. The second your trade is live, set your exit points. This is pure discipline.
- Stop-Loss: Tuck this just below the consolidation range you were just watching. If the breakout turns out to be fake and the price collapses back into the range, this order gets you out automatically and contains the damage.
- Take-Profit: A solid rule of thumb is to aim for a profit that's 1.5x to 2x your potential loss (the distance from your entry to your stop-loss). You can use vTrader's risk/reward tool to map this out visually right on your chart.
This kind of structured risk management is what separates traders who stick around from the ones who blow up their accounts. The stats on new traders aren't pretty—many sources show that a huge percentage quit within a few months, with only a small handful finding real success. As Cryptomus.com points out, understanding these odds forces you to be disciplined.
By applying this structured approach to every single trade—whether it's on a giant like BTC or a volatile altcoin—you start building the habits that lead to consistency. For a deeper dive into trading specific assets, check out our guide on how to trade Bitcoin (BTC) on vTrader.
Mastering Risk in Volatile Crypto Markets
Let's be real: profitability in day trading crypto isn't about how many trades you nail. It’s about how well you handle the ones that go against you. This is the single biggest thing that separates the pros from the amateurs—building a defensive strategy to shield your capital from the market’s wild swings.
The absolute bedrock of any smart risk plan is the 1% rule. The concept is brilliantly simple: never risk more than 1% of your total account balance on a single trade. If you're working with a $2,000 account, that means your maximum loss on any one position is just $20. This stops a couple of bad calls from blowing up your account, making sure you live to trade another day.
Calculating Your Position Size
Once you've defined your risk, you can figure out the right position size. This isn't guesswork; it's a specific calculation based on your entry point and where you place your stop-loss. For example, if you decide your stop-loss on a Bitcoin trade needs to be $100 below where you get in, and your 1% risk is $20, you can calculate the precise amount of BTC to buy.
This kind of discipline forces you to think systematically and keeps emotion out of your decision-making. It also connects directly to the fees you pay, which are part of your overall risk. Knowing the fee structure is critical, and you can learn more about how vTrader’s fee model at https://www.vtrader.io/en-us/fees can impact your trades.
The infographic below breaks down two crucial stop-loss strategies, showing how they differ in protecting your capital and locking in profits.
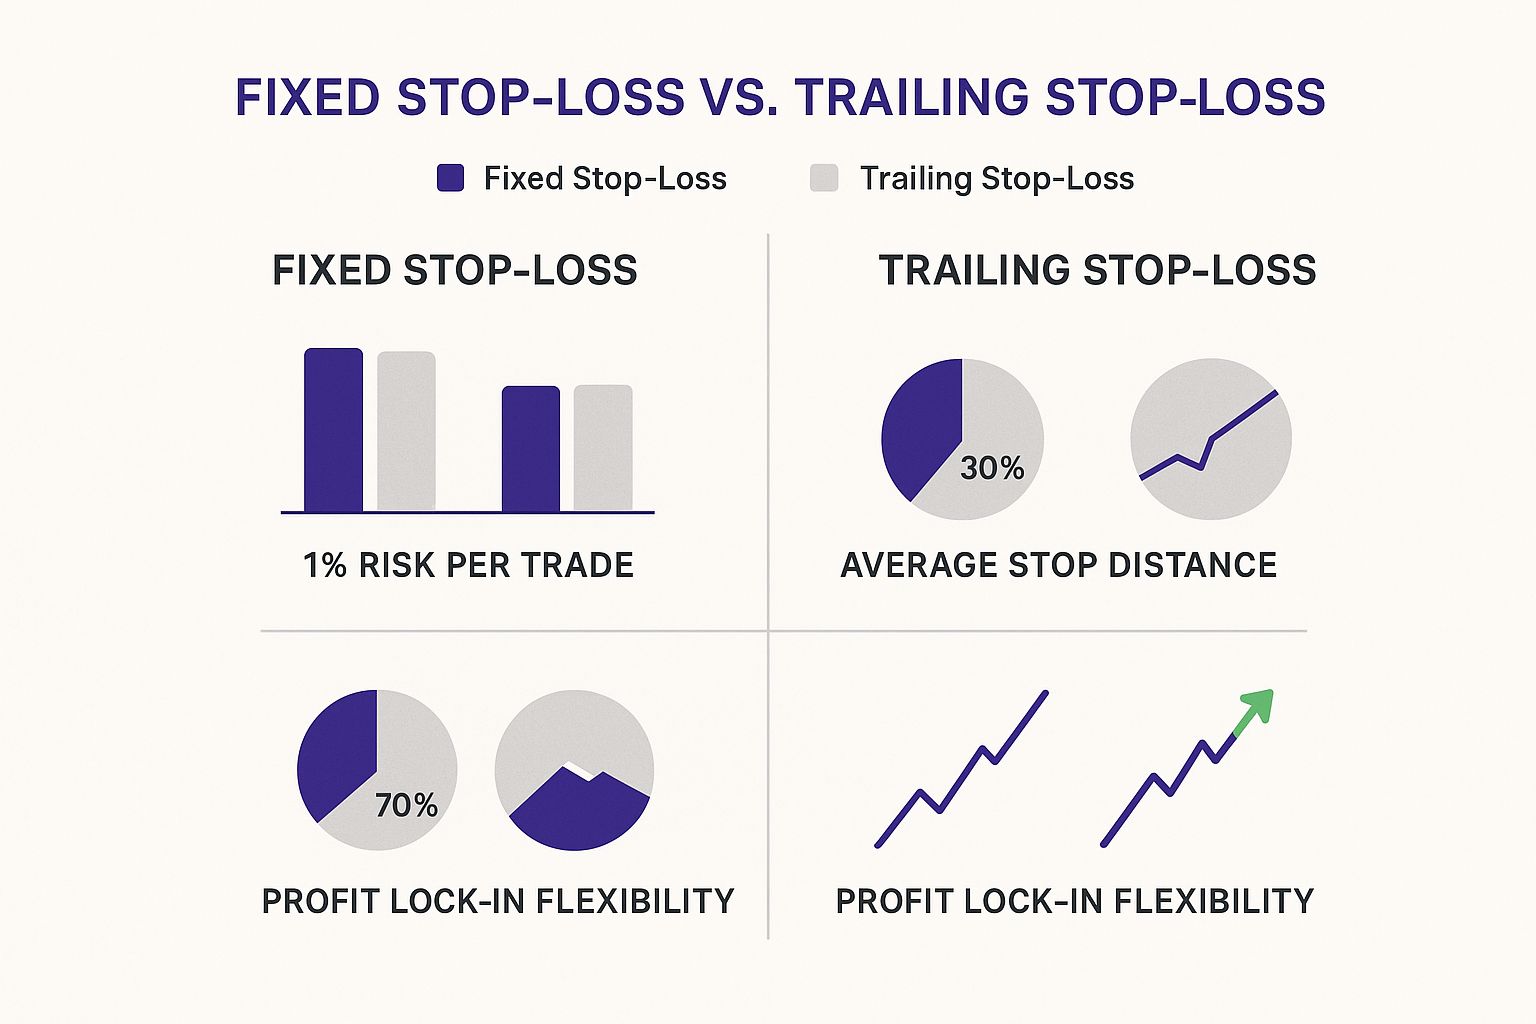
As you can see, a fixed stop-loss is straightforward, but a trailing stop gives you a dynamic way to secure gains as a trade moves in your favor.
Using Trailing Stop-Losses to Lock in Profits
This is where vTrader’s tools really shine. A trailing stop-loss is designed to automatically follow the price as it moves up, staying a set distance away that you define (like 2% or $50). If your ETH trade suddenly rips higher, your stop-loss follows it up, protecting your unrealized gains. If the price then reverses, the stop triggers, automatically locking in your profit.
Risk management is not about being right all the time. It's about ensuring that when you're wrong, the damage is small enough to be insignificant.
This technique is a lifesaver. It fights the urge to get greedy and hold on for too long—a classic psychological trap for traders. It basically automates the discipline that so many of us struggle to maintain on our own.
Of course, the market isn't the only risk. Regulatory shifts can throw a wrench in the works. For instance, North American monthly crypto transfer volumes recently shot past $2 trillion, but new licensing rules in certain areas caused trading volumes to dip by 10-25%. These external factors can mess with volatility and liquidity out of nowhere.
To really round out your strategy, it’s worth learning how to conduct a thorough risk assessment on a broader level. Building these skills is what ultimately turns a hopeful trader into a consistently profitable one.
Risk Management Techniques Comparison
Choosing the right risk management tool often depends on your personal trading style and how much risk you're comfortable with. Below is a quick comparison to help you decide which approach fits best with your strategy.
| Strategy | Best For | How to Implement in vTrader |
|---|---|---|
| Fixed Stop-Loss | Traders who prefer a clear, predefined exit point based on technical analysis. | Set a specific price level in the "Stop-Loss" field when placing your order. |
| Trailing Stop-Loss | Traders looking to maximize profits on trending assets while protecting gains. | Select "Trailing Stop-Loss" and define a percentage or price distance to trail the market. |
| The 1% Rule | All traders, especially beginners, to ensure long-term capital preservation. | Manually calculate your position size before every trade so your stop-loss equals 1% of your account. |
Ultimately, the best traders use a combination of these techniques, adapting their approach to fit the specific conditions of each trade. Experiment with them in a demo account to see what feels most natural for you.
Analyzing Your Trades to Refine Your Strategy
Getting a trade across the finish line is only half the job. Where the real learning happens—the kind that turns a breakeven trader into a consistently profitable one—is in the moments after a position is closed. This is where you dig in, review the tape, and turn raw experience into a sharper crypto day trading strategy.
This post-trade analysis isn't about celebrating wins or dwelling on losses. It’s about being a detective, digging through your own performance data to find the patterns that are either padding your account or slowly draining it. Skip this step, and you’re just guessing, doomed to make the same expensive mistakes again and again.
Turning Data into Actionable Insights
Your trading journal is your single source of truth, especially when you pair it with the analytics built right into vTrader. Don't just give your P&L a passing glance. You need to get under the hood and look at the metrics that tell the real story.
Start by tracking these key performance indicators (KPIs) every single week:
- Win/Loss Ratio: This is simply the percentage of your trades that ended up in the green. A ratio over 50% feels great, but it’s pretty meaningless on its own.
- Average Profit vs. Average Loss: This one is huge. It reveals the reality of your risk-to-reward. A high win rate gets you nowhere if your average losing trade is double the size of your average winner.
- Maximum Drawdown: This shows you the biggest drop your account has taken from a peak. It's a gut check, a crucial measure of how much risk you’re actually taking on, whether you realize it or not.
Once you start logging this data, you can ask the hard questions. Are most of your losses coming from trying to short a market that’s clearly in a screaming uptrend? Are you getting stopped out constantly because your stops are too tight for an asset’s typical volatility? The answers are sitting right there in your trade history.
For instance, if your data shows you’re consistently losing on Bitcoin trades, it might be time to check out our Bitcoin price prediction tools to see if you’re trading against the broader market sentiment.
Your trading data is a feedback loop. Use it to find your weaknesses and systematically fix them. This objective review process is what builds discipline and, ultimately, long-term consistency.
Establishing a Weekly Review Framework
You have to make this a non-negotiable ritual. Pick a time each week—maybe Sunday evening before the markets get moving—to do a full post-mortem. Pull up your vTrader trade history and go through every single position.
For each trade, you need to be brutally honest and ask yourself:
- Was the setup legit? Did it tick all the boxes of my strategy, or was I just bored and chasing a trade out of FOMO?
- Did I stick to my risk rules? Was my position size on point? Did I set my stop-loss the moment I entered the trade?
- How was my trade management? Did I get out where my plan said to, or did I let fear or greed push me to close too early or hold on for too long?
This structured review takes the emotion out of it. It forces you to look at your actions objectively, making it so much easier to spot the bad habits that are holding you back. Over time, this data-driven approach is what lets you make those small, precise tweaks—like widening your stops or only taking A+ setups—that make a massive difference to your bottom line.
Common Questions About Day Trading Crypto
Jumping into the world of crypto day trading always kicks up a lot of questions, whether you're just getting your feet wet or you've been around the block a few times. Getting straight, no-nonsense answers is key to building the confidence you need to trade well.
Let's cut through the noise and tackle some of the most common questions we hear from traders.
How Much Capital Do I Need to Start?
This is a big one. Unlike the traditional stock market with its restrictive pattern day trader rules, crypto is wide open. You can technically get started on many exchanges with as little as $10 or $20.
But let's be realistic. A more practical starting point is somewhere between $500 and $1,000. That amount is big enough to let you open meaningful positions while still being disciplined about risk management—like the 1% rule we covered. If you start with too little capital, you're almost forced to take on way too much risk just to chase decent profits, which is a classic—and costly—rookie mistake.
Your starting capital isn't just for trading; it's for learning and surviving. A modest but sufficient bankroll gives you the runway to make mistakes, see what works, and fine-tune your strategy without blowing up your account.
What Are the Best Times to Trade?
The crypto market is famous for being open 24/7, but that doesn't mean every hour is a good time to trade. The best action almost always happens when the market is busiest.
You'll find the most liquidity and volatility when the major traditional market sessions overlap. Specifically, during London and New York business hours (that’s roughly 8:00 AM to 5:00 PM EST), trading volume just explodes.
During these peak hours, you get:
- Tighter Spreads: This means you're paying less in transaction costs and getting less slippage on your trades.
- Cleaner Price Action: With high volume, you often see more defined trends and clearer patterns, making your technical analysis much more reliable.
- More Opportunity: Volatility is what creates the price swings you need to actually make money on a day trade.
Trying to trade during off-peak hours, like late at night or on weekends, can feel like navigating choppy, unpredictable waters with wider spreads. It’s a much tougher game to win.
Can I Succeed with Only Technical Analysis?
Absolutely. A huge number of successful traders who day trade crypto lean almost entirely on technical analysis (TA). Since you're focused on tiny, short-term price movements, analyzing charts, patterns, and indicators like RSI and MACD is a powerful way to nail down your entries and exits.
That said, it’s a big mistake to trade in a total bubble. While TA should be your main weapon, you have to keep an eye on major news. A surprise regulatory announcement or a major exchange hack can blow up even the most perfect technical setup in an instant.
The best approach is a balanced one: use TA to execute your game plan, but keep the news feed open to make sure you don't get blindsided by a major market-moving event. For more detailed answers to other common questions, you can always check out the great info in our vTrader FAQ section.
Ready to apply these insights with a platform built for performance? Join vTrader today to access zero-fee trading, advanced analytical tools, and a seamless experience designed to give you an edge in the crypto markets. Start trading with vTrader now!

Steve Gregory is a lawyer in the United States who specializes in licensing for cryptocurrency companies and products. Steve began his career as an attorney in 2015 but made the switch to working in cryptocurrency full time shortly after joining the original team at Gemini Trust Company, an early cryptocurrency exchange based in New York City. Steve then joined CEX.io and was able to launch their regulated US-based cryptocurrency. Steve then went on to become the CEO at currency.com when he ran for four years and was able to lead currency.com to being fully acquired in 2025.