When you hear "fundamental analysis," you might think of stuffy Wall Street analysts poring over spreadsheets. But in the wild world of crypto, it's about something much more exciting: becoming a detective to uncover a digital asset's true intrinsic value, far from the noise of market hype and fleeting price charts.
What Is Crypto Fundamental Analysis Really?
Think about buying a used car. You wouldn't just look at its price tag and call it a day, right? Of course not. You’d pop the hood, check the engine, see who made it, and maybe even find some owner reviews. That's exactly what fundamental analysis (FA) is for crypto—a deep dive under the hood of a project.
It’s all about asking the one question that truly matters: Does this project have real, sustainable value that will last?
The Focus Is On Long-Term Health
This is where FA really separates itself from its counterpart, technical analysis (TA). While TA is busy looking at charts to predict short-term price moves, FA is focused on the long-term health and potential of a project. It’s less about “when to sell” and more about “what to buy” and hold for the future.
With thousands of cryptocurrencies out there, this approach is your best filter. It helps you cut through the hype and zero in on projects built on a solid foundation. To really get a feel for this, it’s helpful to understand the basic differences between traditional fiat currency vs cryptocurrency.
As blockchain technology barrels forward, FA has to keep up, pulling in new kinds of data and insights to stay sharp. It examines a crypto’s place in the market, its economic model, and who its competitors are. This is how you spot a hidden gem before everyone else does—or get a warning sign about a project that's all sizzle and no steak.
A great starting point for any analysis is looking at the big picture, like the global crypto market cap.
This chart gives you a bird's-eye view. Is money flowing into the crypto space or heading for the exits? It’s a vital piece of context before you start digging into individual projects.
Fundamental Analysis vs. Technical Analysis at a Glance
The clearest way to grasp what fundamental analysis is all about is to see it side-by-side with technical analysis. They aren't rivals; they're two different tools for two different jobs, each answering a completely different set of questions for a trader.
Here’s a quick comparison to make the distinction crystal clear.
| Aspect | Fundamental Analysis (FA) | Technical Analysis (TA) |
|---|---|---|
| Main Goal | Determine a crypto's intrinsic value and long-term potential. | Predict future price movements based on past market data. |
| Time Horizon | Long-term (months to years). | Short-term (hours, days, or weeks). |
| Tools Used | Whitepapers, team credentials, tokenomics, community activity. | Price charts, trading volume, and statistical indicators. |
| Key Question | "Is this a good project to invest in for the long haul?" | "Is now a good time to buy or sell this asset?" |
By getting a handle on both, you can build a much smarter and more complete trading strategy. FA helps you decide what to buy, while TA can help you figure out when to buy or sell it.
To learn more about these and other essential trading concepts, be sure to explore the resources at the vTrader Academy.
Why You Must Analyze the Broader Crypto Market First

Before you even think about diving deep into a single crypto project, you have to look up and check the weather across the entire market. It's like planning a day at the beach. You can pick the absolute perfect spot on the sand, but if a hurricane is brewing offshore, your prime real estate won't mean a thing. A storm hits everyone.
It’s the same story in crypto. Even the most groundbreaking project with a brilliant team can get dragged down if the whole market is in a freefall. As the old saying goes, a rising tide lifts all boats—but a falling tide can sink them, too. Getting this big-picture view is the non-negotiable first step in any real cryptocurrency fundamental analysis. It’s the context you need to make smarter moves.
Reading the Market Weather
So, how do you actually check this "market weather"? You start by looking at macro-level indicators that tell you about the overall health and mood of the crypto world. These metrics reveal whether money is pouring in or draining out, helping you figure out which part of the market cycle we're in.
You'll generally find the market in one of three conditions:
- Bull Market: This is when things are booming. Prices are climbing, investors are confident, and the general vibe is overwhelmingly positive. In a bull run, even mediocre projects can pump.
- Bear Market: The exact opposite. It's a long, painful period of decline where prices are dropping and fear is the dominant emotion. In a bear market, even the strongest, most legitimate projects can see their valuations get crushed.
- Sideways Market: The market is basically treading water, stuck trading in a relatively tight range with no clear direction. This often signals a cool-down or consolidation period before the next big move up or down.
Key Takeaway: You have to know which way the wind is blowing. Your deep dive into a specific coin becomes ten times more effective when you know if you're sailing with a powerful tailwind (a bull market) or fighting a nasty headwind (a bear market).
Key Indicators for Market Analysis
Two of the most telling indicators for judging the broader market are Total Market Capitalization and Bitcoin Dominance.
Total Market Capitalization (Total Market Cap) is simply the combined value of every single cryptocurrency out there. Think of it as a barometer for the industry's overall size and health. When the total market cap is climbing, it's a bullish sign that new money is entering the space. When it's shrinking, money is leaving—a classic bearish signal.
For a bit of perspective, the global crypto market cap hit around $3.41 trillion in mid-2025. That figure represents nearly 17,000 different cryptos trading across more than 1,300 exchanges. This gives you a solid quantitative baseline to start from. You can track this yourself with tools like the global crypto market charts on CoinGecko.
Bitcoin Dominance (BTC.D) is another crucial metric. It measures what percentage of the total crypto market cap belongs to Bitcoin alone. Since Bitcoin is the OG—the largest and most established crypto—its gravity pulls on the entire market.
- When Bitcoin Dominance is rising, it often signals a "flight to safety," where investors dump their riskier altcoins and move funds back into the relative stability of Bitcoin.
- When it's falling, it suggests investor confidence is growing. Capital flows out of Bitcoin and into altcoins in search of explosive gains, which can trigger a full-blown "altcoin season."
By starting your cryptocurrency fundamental analysis here, with the macro view, you’re building your strategy on a solid foundation. Only after you understand the market's overall climate can you effectively zoom in to find the real winners.
The Three Pillars of Project Analysis
Now that we have a feel for the market's overall climate, it's time to zoom in and start dissecting individual crypto projects. This is the real meat and potatoes of cryptocurrency fundamental analysis. With thousands of projects all shouting that they’re the next big thing, the task can feel overwhelming.
To cut through all that noise, we can lean on a simple but incredibly effective framework: The Three Pillars of Project Analysis.
Think of yourself as a venture capitalist sizing up a new startup. You wouldn't just glance at their bank balance, right? You'd dig into their business plan, meet the founding team, and check if they actually have any customers. We're going to apply that same sharp-eyed logic here, breaking down our investigation into three core areas.
This structured approach turns what could be a messy, confusing investigation into a clear, step-by-step process. It’s an actionable checklist you can use to really gauge a crypto project's health and its potential to stick around for the long haul.
Pillar 1: On-Chain Metrics
Our first pillar is all about what’s happening on the blockchain itself. This is kind of like checking a company’s real-time customer activity. Are people actually using the product? The beauty of on-chain data is its transparency—it offers an unfiltered look at a network’s health and how engaged its users are.
Here are the key metrics you’ll want to watch:
- Active Addresses: This tells you how many unique wallets are sending or receiving tokens over a certain time. A steady climb in active addresses is a great sign, suggesting growing adoption and a network that’s alive and kicking.
- Transaction Volume: This measures the total dollar value of all transactions on the network. A higher volume can point to serious economic activity and real demand for the crypto asset.
- Transaction Count: This is the raw number of transactions. While a huge volume might just be a few "whales" moving massive sums around, a high transaction count often signals broader, everyday use by a much larger group of people.
These numbers give you a direct window into what users are actually doing. If a project has a fantastic story but its network is a ghost town, that's a massive red flag.
Pillar 2: Project Metrics
The second pillar shifts our focus from raw data to the more qualitative side of things—the project's "business plan" and the people steering the ship. This is where you put on your detective hat and assess the team's vision, credibility, and ability to deliver. A project might have flashy on-chain stats, but if its foundation is weak, it’s not built to last.
Crucial Insight: Great tech alone doesn't guarantee a win. The quality of the team, the clarity of their vision, and the passion of the community are just as vital in shaping a project's future.
Start your sleuthing by digging into these core elements:
- The Whitepaper: This is the project’s manifesto, laying out its goals, tech, and roadmap. A solid whitepaper doesn't just make vague promises; it presents a clear solution to a real-world problem.
- The Team: Who’s actually building this thing? You want to see a team with a proven track record in tech, business, or cryptography. Anonymous teams are a huge risk you probably don't want to take.
- The Community: A passionate and active community is a project's secret weapon. Jump into their Discord, Telegram, and Twitter. Is the conversation smart and supportive, or is it just a bunch of "wen moon" hype?
Another vital project metric is development activity. A project that isn't being actively coded is a project that's slowly dying.
The infographic below highlights three key areas to check when you're trying to take a project's development pulse.
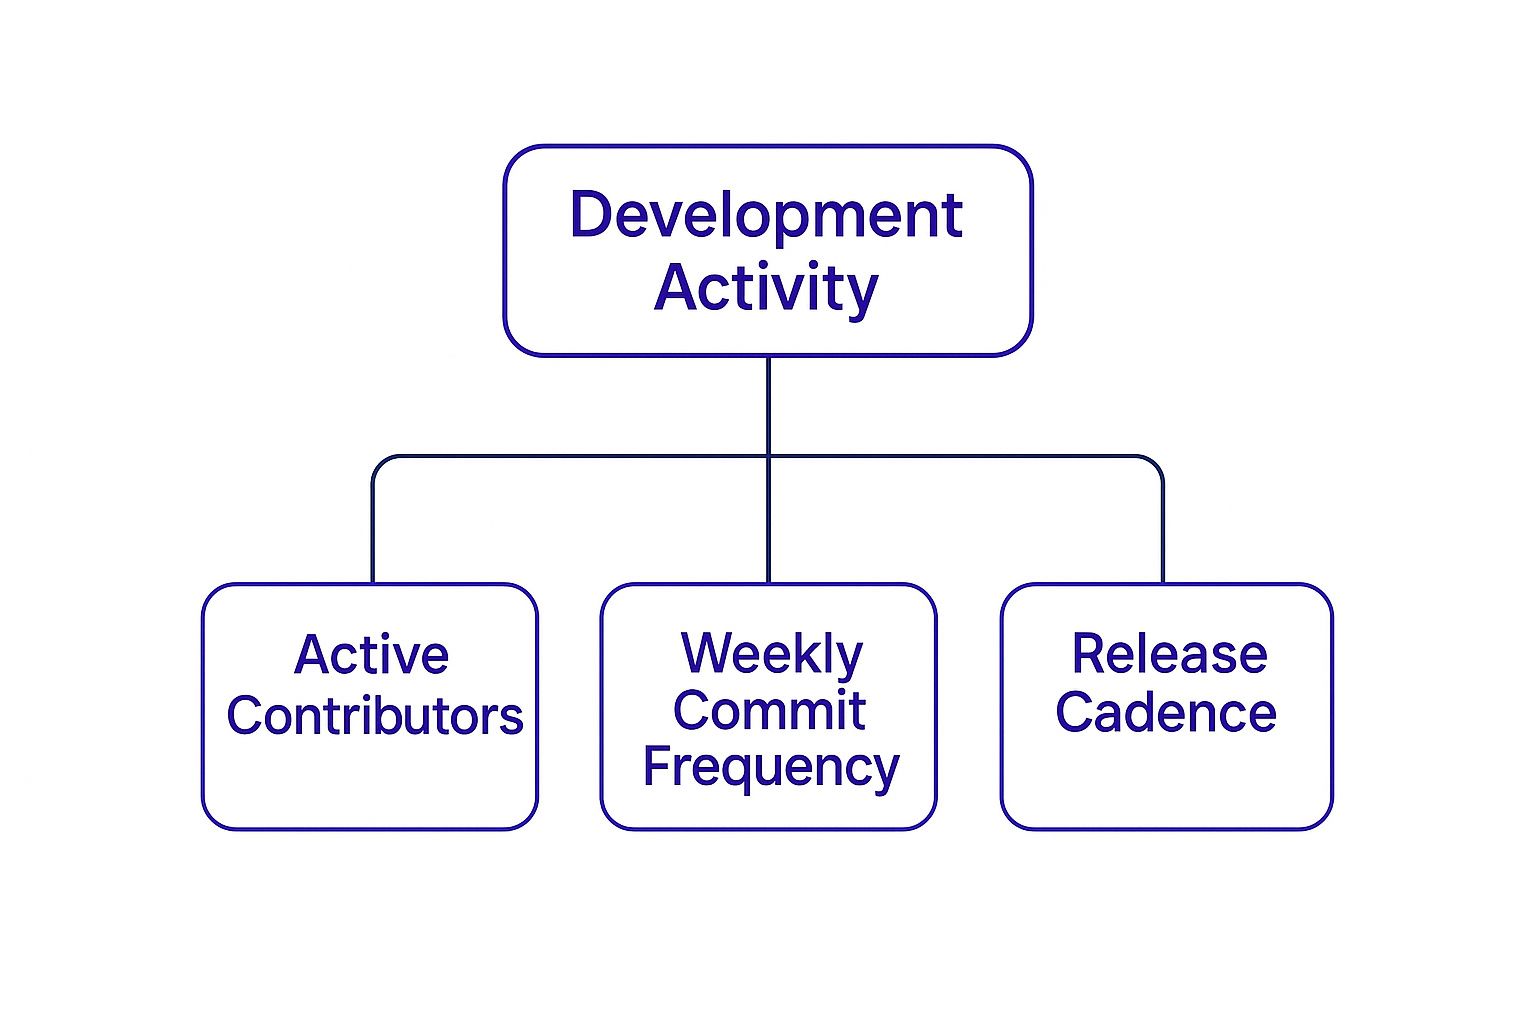
This kind of data, which you can often find on platforms like GitHub, tells you if the developers are consistently shipping code and hitting their roadmap targets.
Pillar 3: Financial Metrics
Our final pillar is all about the money. Here, we analyze the project's financials by examining its tokenomics—the economic engine that drives its token. For an investor, this is arguably the most critical piece of the puzzle, because terrible tokenomics can sink even the most promising project.
Tokenomics answers the big questions about a token's supply, how it’s distributed, and what you can actually do with it. Getting a handle on these factors is essential for figuring out if a token is designed to grow in value or if it’s just headed for a death spiral of inflation.
Here’s a quick breakdown of what to analyze:
- Total Supply and Circulating Supply: Is there a hard cap on the number of tokens, like Bitcoin's 21 million? Or is it inflationary with no limit? A fixed supply is often a bullish signal for the long term.
- Token Distribution: How were the initial tokens handed out? If the team and a few early investors are sitting on a massive chunk, they could dump their bags on the market later and crash the price. You want to see a fair and wide distribution.
- Vesting Schedules: When tokens are given to the team and investors, a vesting schedule locks up their holdings for a specific time. This stops them from cashing out immediately and shows they’re committed to the project’s success.
By carefully working through these three pillars—On-Chain, Project, and Financial— you build a complete, balanced picture of a project. This is the core of effective cryptocurrency fundamental analysis and the foundation for making genuinely informed investment decisions.
Using Crypto History to Identify Future Winners

In the crypto world, there's a saying that history doesn't repeat itself, but it often rhymes. While you can't predict the future based on the past, understanding the major market cycles gives you a massive edge. Think of it less as a history lesson and more as a core part of cryptocurrency fundamental analysis. It’s how you learn to spot the all-too-human patterns of greed and fear that drive the market.
This is a lot like a veteran storm chaser who has seen dozens of weather patterns. They know what the sky looks like right before a big one hits. By studying crypto’s pivotal moments, you build that same kind of intuition. It helps you see the difference between a real technological leap and another flash in the pan.
Honestly, this historical perspective is one of your best defenses against making emotional, knee-jerk decisions. Once you’ve seen how hype cycles play out, you're far less likely to get caught up in the madness or panic-sell during a dip.
Learning from the Great ICO Boom and Bust
The 2017 bull run and the brutal 2018 crash that followed are the perfect case study. That whole era was defined by the Initial Coin Offering (ICO) craze. New projects were raising millions overnight, sometimes with nothing more than a flashy website and a whitepaper that was thrown together in a week. The excitement was off the charts, and it felt like every new token was a guaranteed moonshot.
That period taught us some hard lessons that are still relevant for fundamental analysis today:
- Hype Can Outpace Reality: The overwhelming majority of projects from the 2017 boom failed and went to zero. They had incredible marketing and hype but no real-world use case, no credible team, and terrible tokenomics.
- Technology Matters: The projects that actually survived and are now giants, like Ethereum, were the ones with game-changing tech that opened up new doors (in its case, smart contracts and DApps).
- Market Corrections Are Brutal: When the music stopped, the market corrected with unbelievable speed. Projects with no substance were completely wiped out. Even the strongest projects saw their prices tank.
Key Insight: History shows that during a bull run, a good story can easily cover up bad fundamentals. A smart analyst learns to look past the hype and ask tough questions about a project’s long-term value, even when everyone else is drinking the Kool-Aid.
Recognizing Market Cycles in Data
When you look at the historical data, these cycles of boom and bust are painted in vivid detail. The ICO craze, for example, fueled an insane surge. Bitcoin’s price shot up from around $800 in late 2016 to nearly $20,000 by December 2017. During that same time, Ethereum exploded from about $7 to $700.
Then came the hangover. After that peak, the market slumped into a long "crypto winter," with Bitcoin bottoming out around $3,100 just a year later. You can see these cycles for yourself by digging through historical crypto market snapshots on CoinMarketCap.
Understanding these dramatic swings drives home a core principle of cryptocurrency fundamental analysis: a project’s true value has to be based on more than just speculation. By studying these past cycles, you get much better at figuring out how the market might react to the next big thing.
Of course, when you do decide to act on your analysis, you have to be mindful of transaction costs. This is why it’s so important to use a platform with clear and low costs. Take a moment to check out the fee structure on vTrader. This ensures more of your money is actually invested in your strategy, not eaten up by fees.
Conducting Your First Fundamental Analysis on vTrader
Alright, enough theory. It’s time to get your hands dirty and see how this all works in the real world. This is the part where we connect the dots between knowing what cryptocurrency fundamental analysis is and actually doing it. The great thing about the vTrader platform is that it pulls all the critical data you need into one place, making what used to be a messy research process feel clear and straightforward.
Let's walk through your first analysis, step-by-step, using vTrader. The idea is to build a reliable checklist you can bring to any project that catches your interest. You're about to go from just reading about this stuff to becoming a confident analyst.
Step 1: Locate the Project Overview
Your first port of call on vTrader is always the main page for whatever crypto you’re digging into. Think of it as the project’s command center. Here, you get a snapshot of the most important top-level metrics, giving you an immediate vibe for where the asset stands in the market.
This screen is your first filter. It’s designed to give you a quick, digestible summary so you can spot any obvious red flags or encouraging green lights before you commit more time.
The vTrader dashboard lays this all out for you, letting you quickly size up metrics like market cap and recent price movements.

Just from this one screenshot, you can immediately grasp the project's market cap, circulating supply, and 24-hour trading volume. That’s a solid starting point for any analysis.
Step 2: Dissect the Financials and Tokenomics
Once you’ve got the bird’s-eye view, it’s time to get into the weeds of the project's financial DNA. On any vTrader asset page, you'll find a section dedicated to tokenomics. This is where you find the answers to the make-or-break financial questions that form the backbone of any solid cryptocurrency fundamental analysis.
Here’s what you should be hunting for:
- Total and Max Supply: Is the supply fixed like Bitcoin's, which creates built-in scarcity? Or is it inflationary with no end in sight? vTrader shows you this clearly, which is crucial for understanding the token's long-term potential for value.
- Circulating Supply: This tells you exactly how many tokens are actually out there in the market. A huge gap between the circulating and total supply can be a warning sign of future sell-offs as more tokens are released.
- Token Distribution and Vesting: A legit project is transparent about who gets the tokens. If the team and early backers are holding a massive chunk with no lock-up periods, that's a huge red flag. vTrader often links directly to official sources so you can check this for yourself.
Many projects now include staking, which can throw a wrench in supply dynamics by locking up tokens and taking them off the market. If a project offers it, it’s worth investigating how this impacts the overall economic picture. You can learn more about crypto staking opportunities on vTrader to see how this can influence an asset's fundamentals.
Analyst's Tip: Never, ever invest in a project without understanding its tokenomics. A fantastic idea with a broken economic model is a guaranteed way to lose money. It's the single biggest mistake most new investors make.
Step 3: Evaluate the Project and Community
Finally, it’s time to look past the numbers and size up the human element—the project’s vision, the team behind it, and the strength of its community. A project’s fundamentals aren’t just about spreadsheets; they're about people and real-world progress.
vTrader gives you direct links to a project’s most important resources. Use this simple checklist to guide you:
- Read the Whitepaper: Use the link on vTrader to pull up the whitepaper. Does it actually solve a real problem? Is the solution logical and well-explained, or is it just a bunch of buzzwords?
- Investigate the Team: Look into the founders. Are they real people with LinkedIn profiles and a track record in tech or finance? Anonymous teams are almost always a gamble you don't want to take.
- Check the Community Vibe: Jump into their social channels like Discord, Telegram, or Twitter using the links provided. Is the community having smart discussions and asking tough questions, or is it just a ghost town full of "wen moon?" An active, engaged community is one of the best signs of a project’s health.
By working through these steps methodically on vTrader, you can turn a confusing pile of data into a clear, confident analysis. This kind of hands-on work is what builds the skill and intuition you need to make much smarter investment moves.
A Complete Fundamental Analysis Case Study
Alright, let's pull all this theory down to earth and see how it works in practice. Reading about concepts is one thing, but walking through a real-world example is what truly makes it click. For this case study, we'll run a complete cryptocurrency fundamental analysis on a made-up asset, "Project Phoenix" (PHX), using our three-pillar framework.
This exercise will show you exactly how to weave together project details, on-chain data, and financial metrics to build a solid investment thesis. By the end, you'll have a repeatable model to tackle your own research with confidence.
Pillar 1: On-Chain Activity
First things first: is anyone actually using the Phoenix network? A quick look reveals that Project Phoenix is averaging 5,000 daily active addresses. Even better, that number has been climbing steadily by 15% month-over-month. That’s a great sign of genuine, organic adoption.
But transaction volume tells a slightly different story. While the number of transactions is high, the average value per transaction is low. This suggests that most of the activity is small-scale. It's not necessarily a deal-breaker, but it does tell us the network isn't being used for major, high-value transfers just yet.
Pillar 2: Project Metrics
Next, we dig into the project itself. The Project Phoenix whitepaper lays out a clear and understandable mission: creating a decentralized data storage network. The problem it's trying to solve is real, which is a massive green flag right from the start.
The team is also fully public, with founders who have proven experience at major tech companies, adding a much-needed layer of credibility. Community engagement is another bright spot. A look at their social channels reveals active, intelligent discussions, not just a bunch of hype about price.
Key Finding: Strong project fundamentals are often the clearest signal of long-term potential. A credible team solving a real problem is the foundation of any sound investment.
Pillar 3: Financial Metrics and Final Thesis
Finally, it's time to crunch the numbers on the PHX tokenomics—and this is where we find a potential snag. Project Phoenix has a total supply of 1 billion tokens, but only 20% of that is currently circulating. Here's the kicker: a massive 40% of all tokens are held by the team and early investors, and they're set to unlock in just six months.
This creates a serious risk of future selling pressure. Even with promising on-chain and project metrics, the tokenomics wave a major red flag. A potential supply dump of this size could easily crush the token's price, no matter how well the project itself is doing.
Conclusion: Project Phoenix looks like a solid project with good tech and a strong team. The tokenomics, however, introduce a major risk that can’t be ignored. One possible strategy would be to hold off on investing until after that big token unlock. That way, you can see how the market handles the new supply, balancing the project's clear potential against its very real financial risks.
Keeping on top of developments like token unlocks is essential. You can track major market events and project news by following a reliable source like the vTrader news hub to make sure your analysis is always up to date.
Frequently Asked Questions About Crypto FA
Even with a solid game plan, you're bound to run into questions when you start putting theory into practice. Digging into crypto fundamental analysis means wading through a ton of data and new ideas. Here are some straightforward answers to the questions that come up most often on the journey.
Practical Questions on Analysis Time and Frequency
How long does a proper fundamental analysis take?
There’s no magic number here. A quick scan for major red flags on a well-known project might only take an hour. But a real deep dive into a new, complex project with groundbreaking tech? That could easily soak up several days of dedicated research.
The goal isn't to be fast; it's to be thorough.
How often should I re-evaluate my fundamental analysis?
Crypto moves at breakneck speed. It's smart to give your analysis a fresh look at least once a quarter. You should also revisit your entire thesis anytime something big happens—like a major protocol upgrade, a huge partnership announcement, or a big swing in market sentiment. This keeps your investment strategy sharp and relevant.
The biggest mistake I see beginners make is falling in love with a project's story while completely ignoring the numbers. A great idea with terrible tokenomics can still be a money pit. You have to analyze all three pillars: on-chain, project, and financial.
Clarifying the Role and Limits of FA
Can fundamental analysis predict short-term price movements?
Nope, that’s not what it’s for. That's the primary job of technical analysis (TA). FA is laser-focused on figuring out a project's long-term intrinsic value and its potential for sustainable growth down the road.
While a strong fundamental outlook often leads to higher prices over time, it's not a crystal ball for predicting what the price will do next week. A truly well-rounded approach often means using both methods together.
For more answers to common trading questions, you can always check the official vTrader FAQ page for additional insights and guidance.
Ready to put your knowledge into action? With vTrader, you get all the tools and data you need to perform your own fundamental analysis on over 30 cryptocurrencies, all with zero trading fees. Sign up today and get a $10 bonus to start building your portfolio!

Steve Gregory is a lawyer in the United States who specializes in licensing for cryptocurrency companies and products. Steve began his career as an attorney in 2015 but made the switch to working in cryptocurrency full time shortly after joining the original team at Gemini Trust Company, an early cryptocurrency exchange based in New York City. Steve then joined CEX.io and was able to launch their regulated US-based cryptocurrency. Steve then went on to become the CEO at currency.com when he ran for four years and was able to lead currency.com to being fully acquired in 2025.