Reading Charts Like A Pro: Your First Steps Into Market Language
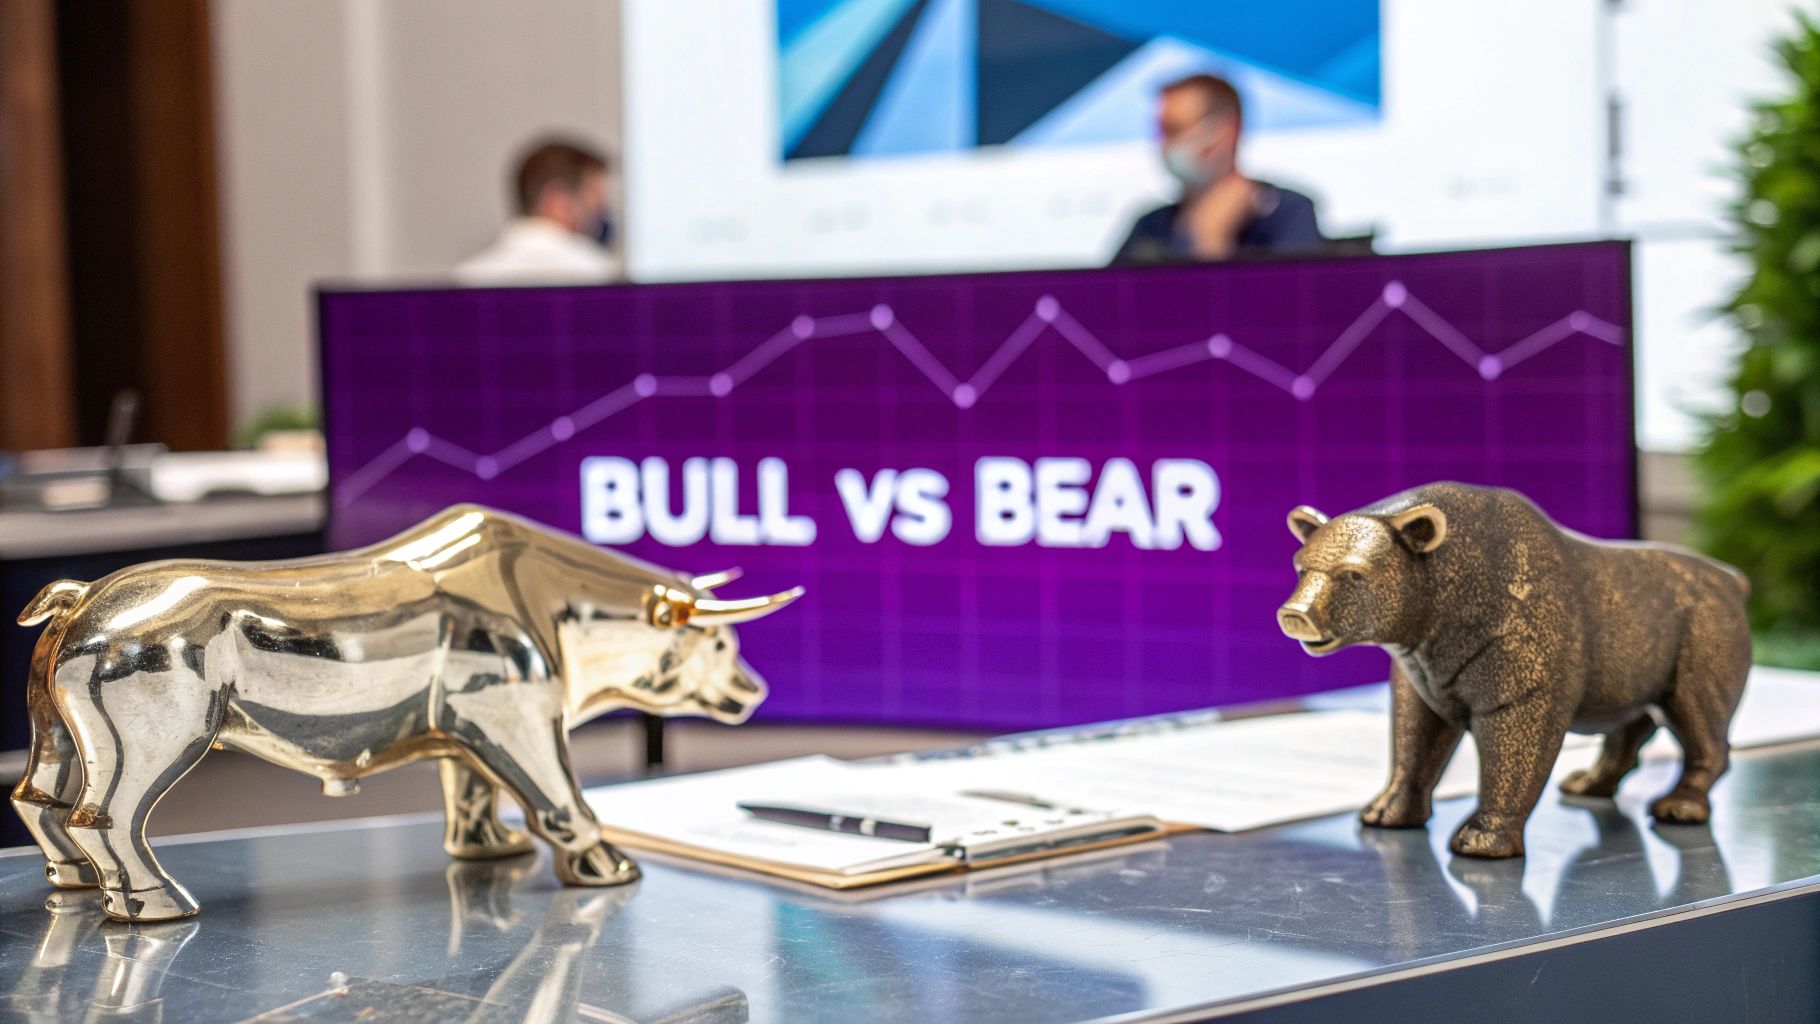
Think of crypto charts less like complex graphs and more like a visual story of market sentiment. Every candlestick tells a tale of the back-and-forth between buyers and sellers. This section acts as your translator, helping you decipher those green and red bars and understand the forces behind price swings. Just like checking the weather forecast helps you plan your day, understanding chart basics prepares you for navigating the sometimes turbulent crypto markets.
Understanding Crypto Charts
Why are charts so effective in the crypto world? One key reason is that crypto markets, being relatively young, are often influenced more by technical factors than traditional markets. This means price patterns tend to repeat, creating opportunities for traders who know what to look for. Even analysts who prioritize fundamental analysis use charts to fine-tune their entry and exit points. Interested in a crypto career? Check out remote opportunities in the field: Remote Cryptocurrency Jobs.
Different Chart Types and Timeframes
Your first step in learning crypto technical analysis is selecting the right chart type. While several exist, the most popular is the candlestick chart. Each candlestick represents a specific timeframe, ranging from 1 minute to 1 month. A shorter timeframe, like 5 minutes, shows you the quick price fluctuations, while a longer timeframe, like 1 day, reveals the broader trend. Want to learn more about trading crypto? This resource can help you get started: How to start trading cryptocurrency.
Reading a Candlestick Chart
This screenshot from TradingView shows a standard candlestick chart. See how the green candles represent times when the closing price was higher than the opening price? This signals buying pressure. Conversely, red candles show selling pressure, meaning the closing price was lower than the opening price. The wicks – those thin lines extending from the candles – indicate the highest and lowest prices during that timeframe.
By studying these patterns, traders gain valuable insights into market sentiment, helping them anticipate potential price moves and make smarter trading decisions. Mastering these basics sets the foundation for exploring more advanced tools and techniques within crypto technical analysis.
Chart Patterns That Actually Predict Price Movements
Imagine being able to anticipate a market shift before it happens. That's the potential of understanding chart patterns in crypto technical analysis. These patterns, like the head and shoulders or the cup and handle, aren't just random shapes on a chart. They reflect the repeating behaviors of traders, driven by fear and greed, throughout market history.
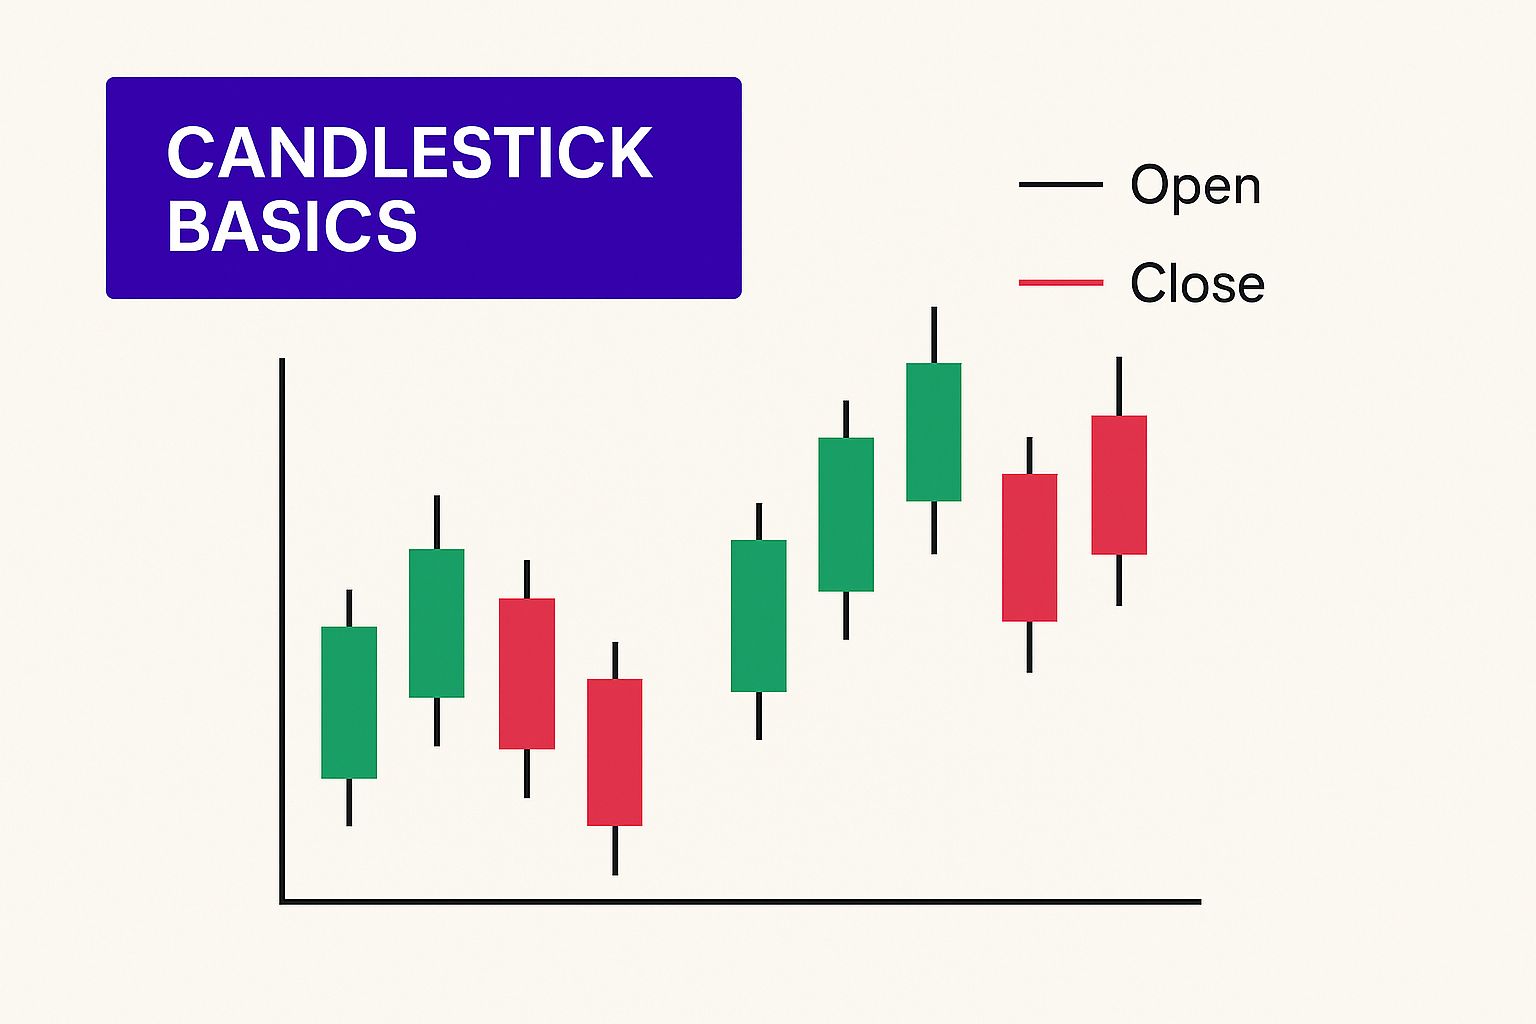
This infographic breaks down candlestick basics, the fundamental building blocks of chart patterns. Think of candlesticks as individual footprints on the price chart, each telling a small story about buyer and seller activity. Understanding these individual "footprints" helps you interpret larger formations, the chart patterns, that can signal potential price moves. For example, a series of long green candlesticks (strong buying) followed by shorter red ones (weakening selling pressure) could indicate a shift in momentum.
Identifying Key Patterns
Learning to spot these patterns in real-time on platforms like vTrader is key. Instead of trying to learn every pattern at once, focus on a few reliable ones to start. The head and shoulders pattern, often a precursor to a price drop, and the double bottom, a bullish signal hinting at a potential price reversal, are good starting points. Understanding how to analyze potential investments is always crucial, and resources on commercial real estate investment analysis can provide a helpful framework for thinking analytically, even in different markets. The core idea behind crypto technical analysis is that history often repeats itself in the markets. This isn't just a theory; it's based on observable patterns. For example, studies of Bitcoin's historical price data show recurring chart patterns, often preceding significant market moves. Learn more about this research.
To help you get started, let's look at some essential chart patterns:
The following table compares some of the most reliable chart patterns for beginners, along with their typical success rates and durations. Remember that these are just estimates, and actual results can vary.
Essential Chart Patterns for Crypto Beginners
Comparison of the most reliable chart patterns, their success rates, and typical timeframes
| Pattern Name | Success Rate | Typical Duration | Best For Beginners |
|---|---|---|---|
| Head and Shoulders | ~70% | Several weeks | Yes |
| Double Bottom | ~65% | Several weeks | Yes |
| Cup and Handle | ~60% | Several weeks to months | Yes |
| Ascending Triangle | ~60% | Several days to weeks | Maybe |
| Descending Triangle | ~55% | Several days to weeks | Maybe |
As you can see, patterns like the Head and Shoulders and Double Bottom offer higher success rates and are easier for beginners to identify. Starting with these patterns can build a solid foundation for your technical analysis.
Avoiding Common Mistakes
One of the biggest pitfalls for beginners is seeing patterns where none actually exist. This can lead to trading decisions based on hope rather than sound analysis. Another common mistake is trying to learn too many patterns at once. This can be overwhelming and lead to "analysis paralysis." Start simple. Focus on the core patterns first, and gradually expand your knowledge as you gain experience.
The Importance of Confirmation
Chart patterns are valuable clues, but they shouldn't be used in isolation. Think of them as one piece of a puzzle. It's crucial to confirm your analysis with other tools, such as volume and indicators, which we'll explore later. These additional tools help validate the patterns you identify and provide a more complete picture of market dynamics. This approach transforms chart patterns from abstract shapes into actionable insights, allowing you to anticipate market moves with more confidence.
Essential Indicators That Never Let You Down
Just like a pilot uses a collection of instruments to navigate safely, successful crypto traders rely on specific indicators to understand the market. This guide focuses on the most reliable tools for beginners in crypto technical analysis, helping you avoid information overload. We’ll explore the Relative Strength Index (RSI) and moving averages, explaining how they can help you make informed trading decisions.
Mastering the RSI
Think of the RSI, which oscillates between 0 and 100, like a car’s temperature gauge. An RSI above 70 suggests the market is overbought, like an engine overheating – signaling a potential price pullback. Conversely, an RSI below 30 indicates an oversold condition, like a cold engine, hinting at a possible price bounce. The RSI helps you identify potential entry and exit points.
Navigating with Moving Averages
Moving averages smooth out price fluctuations and reveal the underlying trend. Imagine driving on a bumpy road. A moving average is like paving that road, giving you a smoother ride and a clearer view of where you're going. Traders often use two moving averages: a shorter-term average (like a 50-day average) and a longer-term average (like a 200-day average). When the shorter-term average crosses above the longer-term, it can signal a bullish trend reversal. You might find this article helpful: Spotting Crypto Hype: 5 Signs You’re Being Pushed To Buy.
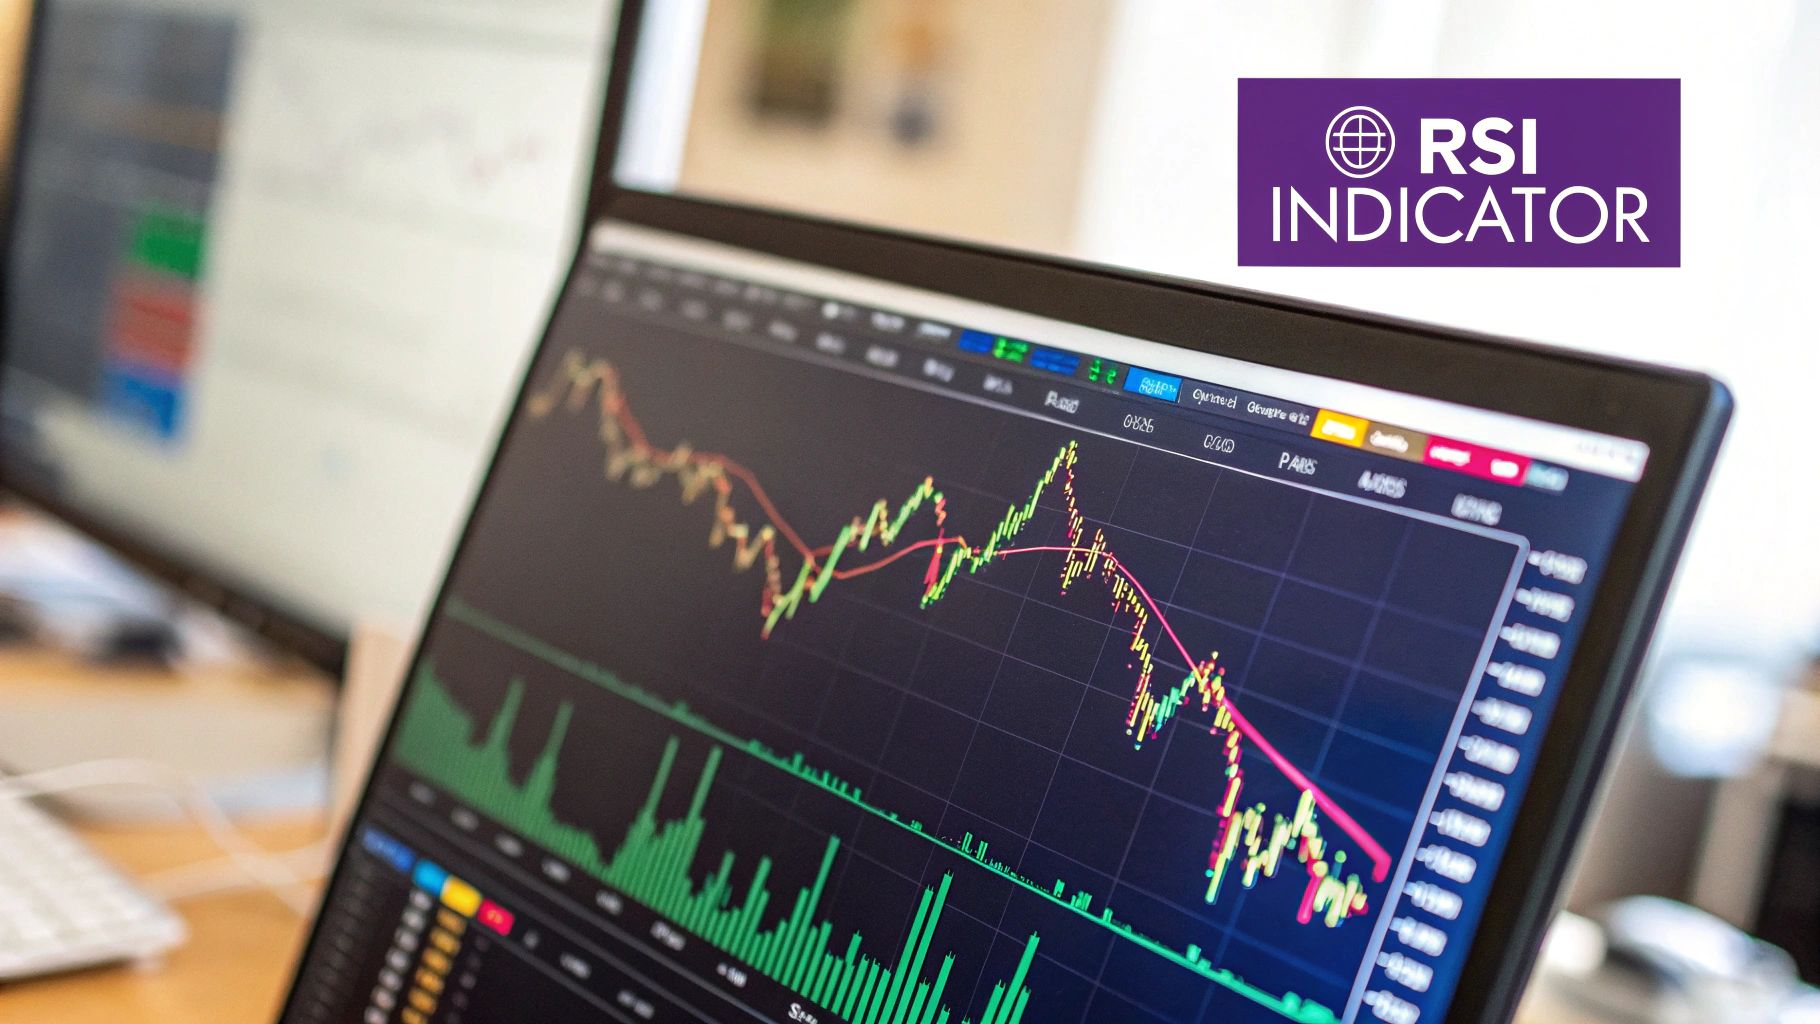
Finding the Right Balance
This TradingView screenshot shows both the RSI and moving averages applied to a Bitcoin chart. The RSI is in the upper panel, fluctuating above and below the key levels of 30 and 70, offering potential buy and sell signals. The two moving averages are overlaid on the price chart itself. Notice how they cross each other, suggesting shifts in the trend direction.
A common mistake for beginners is using too many indicators, leading to confusion. Just as a pilot doesn't need every single instrument at once, focus on a few reliable ones. Technical indicators like the RSI and Moving Averages are popular with crypto traders because they're relatively easy to use and can offer predictive insights. For instance, historical Bitcoin data from Crypto Data Download suggests that when the RSI goes above 70, it often precedes a price pullback, while an RSI below 30 can anticipate a price bounce. Learning to use these tools effectively on platforms like vTrader will greatly improve your technical analysis skills.
Volume Analysis: The Secret Most Beginners Miss
Imagine walking into two different auction houses. In the first, the room is electric with bidders frantically raising their paddles. In the second, only a few hesitant whispers break the silence. The energy in each room tells a story, doesn’t it?
This "energy" is like volume in the crypto markets. It reveals the real strength behind price movements. Many beginners focus solely on the price, overlooking the crucial force driving it. Just like a packed auction room, strong volume can signal high demand. We’ll show you how volume can confirm price trends and add another layer of insight to your trading.
Why Volume Matters in Crypto Technical Analysis for Beginners
Think of a rocket launch. A price breakout with high volume is like a rocket with a full tank of fuel – powerful and likely to travel far. A price move on low volume, on the other hand, is like a sputtering engine, struggling to maintain momentum.
Understanding this dynamic is fundamental to effective crypto technical analysis. It helps you differentiate between powerful, sustainable moves and weak, potentially fleeting ones.
Reading Volume Patterns on vTrader
On the vTrader platform, volume is displayed as bars or histograms at the bottom of your price chart. High volume bars, typically accompanying significant price changes, indicate strong conviction behind the move. Conversely, low volume bars suggest uncertainty or the possibility of a false breakout – a price move that quickly reverses. You might also find this interesting: Mastering Bitcoin Liquidation Maps: A Guide to Staying Afloat in 2025.
Identifying Accumulation and Distribution
Volume analysis also helps you spot periods of accumulation and distribution. High volume during a price uptrend often suggests institutional investors are buying, adding fuel to the rally. This is like seeing whales bid aggressively at our auction, driving the prices higher.
On the flip side, high volume during a downtrend can signal distribution. This means large players are selling, increasing the downward pressure. Imagine those same whales now flooding the market with their holdings, pushing prices down.
Volume as a Confirmation Tool
Volume acts as a critical confirmation tool for trends. A rising price with increasing volume reinforces the validity of the uptrend. It’s a sign of healthy and growing demand.
Conversely, a rising price with declining volume often hints at a potential reversal. This suggests weakening buyer interest – like seeing fewer and fewer bids at our auction despite the rising prices. The same principle applies in reverse for downtrends.
For example, data shows that 70–80% of strong uptrends in Bitcoin and Ethereum correlate with increasing volume, while over 60% of corrections happen with declining volume. Learn more about crypto technical analysis here.
By incorporating volume into your analysis on vTrader, you'll improve your ability to identify sustainable price moves and avoid being fooled by false signals. This knowledge transforms volume from an often-overlooked metric into a powerful tool for validating your trading decisions.
Support And Resistance: The Market's Invisible Boundaries
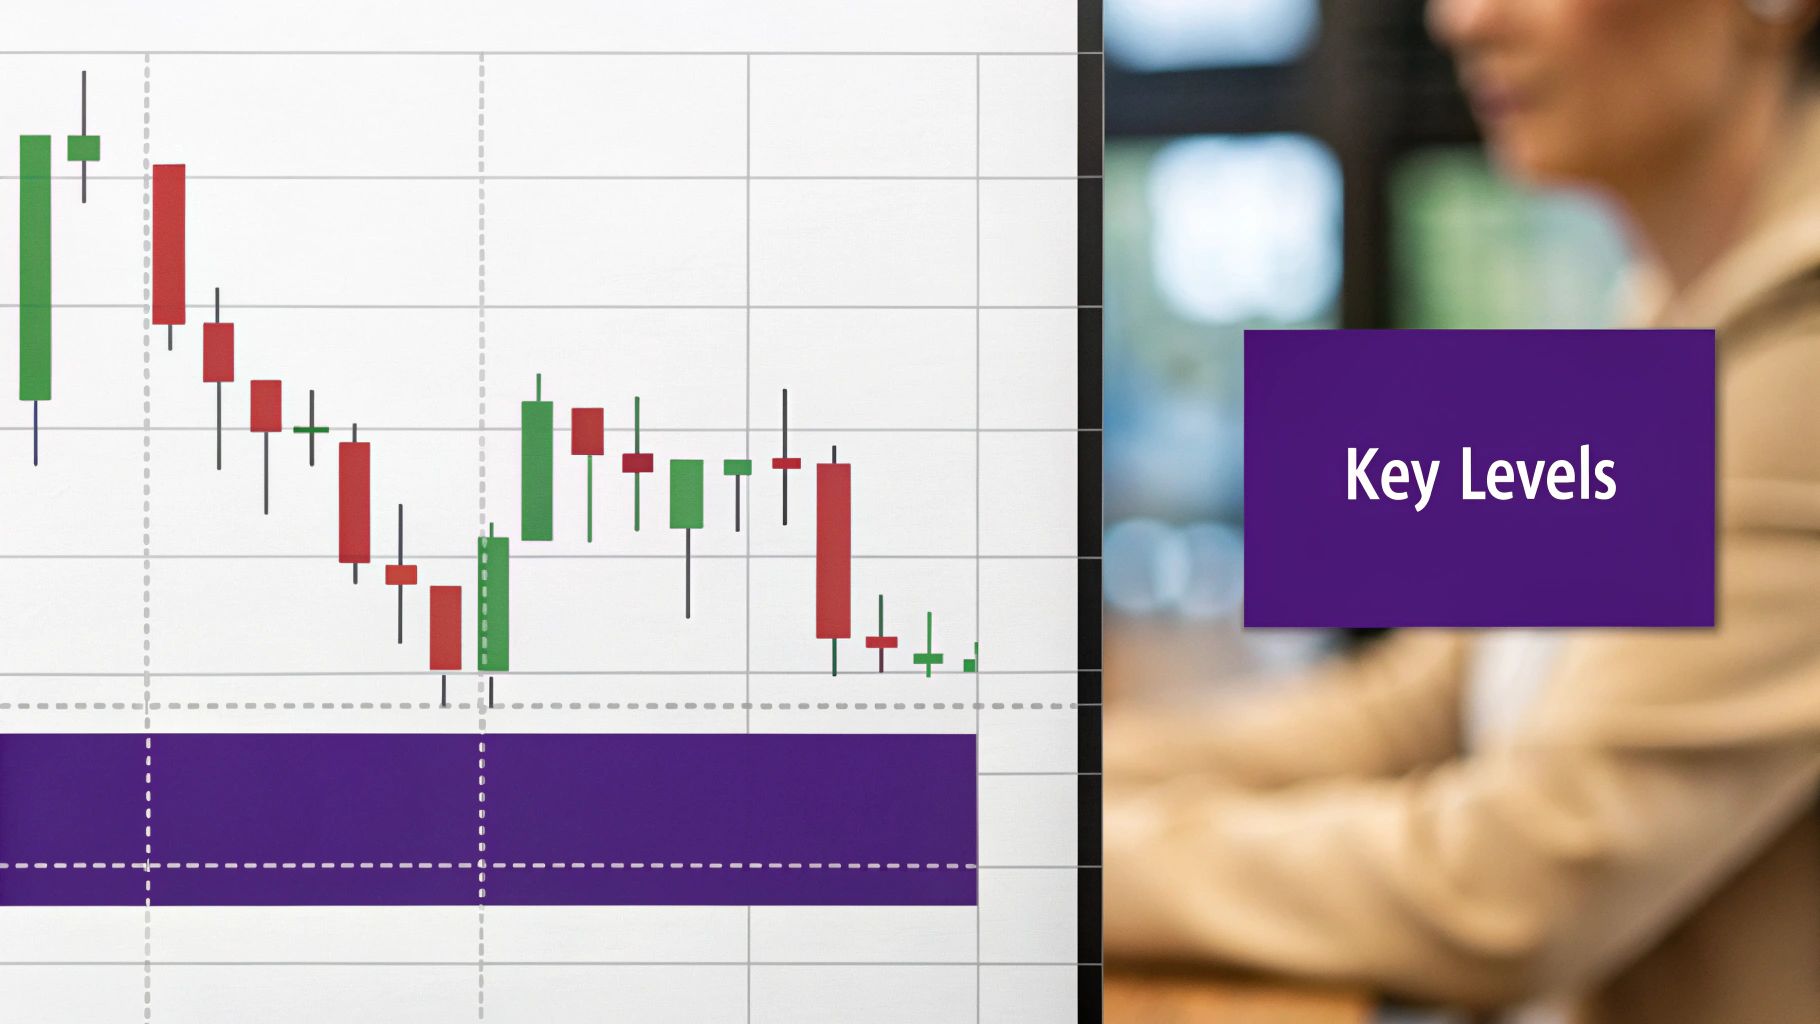
Imagine a pinball machine, but instead of a silver ball, it's the price of Bitcoin, bouncing between invisible bumpers. These bumpers are support and resistance levels, foundational concepts in technical analysis. Support acts like a floor, catching the price as it falls. Resistance is the ceiling, preventing further upward movement.
This TradingView chart perfectly illustrates support and resistance. See how the price repeatedly interacts with those horizontal lines? It either bounces off them or breaks through. These interactions reveal the psychological weight these levels carry, as traders tend to react predictably around them.
Identifying Support and Resistance
Pinpointing these levels is crucial for well-timed entries and exits. One simple method is drawing horizontal lines connecting previous price highs and lows. These points show where the market has historically struggled to move past.
For instance, if Bitcoin has repeatedly failed to break $30,000, that level likely represents resistance. Interestingly, round numbers often act as psychological support and resistance levels, almost like magnets for traders' attention.
Why These Levels Form
Support and resistance are born from the collective psychology of traders. At support levels, buyers feel the asset is a bargain and jump in. Conversely, at resistance, sellers take profits or open short positions, anticipating a price drop. This creates a push and pull dynamic, causing price to fluctuate around these key levels. Grasping this dynamic helps you use these levels to your advantage.
Breakouts and What They Mean
Occasionally, the price forcefully breaks through these invisible barriers. These breakouts can trigger substantial price movements, creating exciting opportunities. If Bitcoin shatters through $30,000 resistance with high trading volume, it could signal a significant upward trend.
But be warned! Not all breakouts are real. False breakouts can trap unsuspecting traders. Confirming breakouts with other indicators, like volume, is crucial to avoid these pitfalls.
Using Support and Resistance on vTrader
The vTrader platform makes identifying and drawing these levels a breeze. You can visualize these crucial price points directly on your charts and incorporate them into your analysis. This allows you to identify potentially ideal entry and exit points, sharpening your trading strategy.
Let's look at different methods for identifying these crucial levels:
Support and Resistance Level Identification Methods
| Method | Reliability | Best Timeframe | Skill Level Required |
|---|---|---|---|
| Horizontal Lines | Medium | Any | Beginner |
| Trendlines | High | Any | Intermediate |
| Fibonacci Retracement | Medium | Any | Intermediate |
| Moving Averages | Medium | Any | Beginner |
| Pivot Points | Low | Day trading | Advanced |
The table above summarizes different methods for identifying support and resistance levels, ranging from simple horizontal lines to more complex techniques like Fibonacci retracement. Choosing the right method depends on your trading style and timeframe. While horizontal lines are easy to use, trendlines offer greater insight into market dynamics. For more advanced traders, Fibonacci retracement and pivot points can provide additional precision.
Putting It All Together: Your Complete Analysis Framework
So, we've covered the individual pieces. Now, let's talk about how to bring them all together to inform your trading decisions. Think of it like building with LEGOs – you've got all these individual bricks (indicators, chart patterns, etc.), and now it's time to construct something awesome. We'll walk through a practical example, showing how everything interacts within a live cryptocurrency analysis.
Building Your Trading Thesis
Let's say we're analyzing Bitcoin. Our first step is to understand the bigger picture. We'll pull up a daily or weekly chart to check the long-term trend. Imagine we spot a double bottom pattern. This typically suggests a bullish reversal, a potential shift from a downtrend to an uptrend. But one signal isn't enough. We need more evidence. So, next, we might look at the Relative Strength Index (RSI). If the RSI is below 30, that supports the double bottom idea, indicating the asset might be oversold and primed for a bounce. You can explore various cryptocurrency investing strategies here.
Confirming With Volume and Support/Resistance
Now we add another layer to our analysis: volume. Is trading volume increasing as the price rises after that double bottom? Higher volume often validates price movements, adding weight to our bullish theory. Finally, we'll map out key support and resistance levels. These are price points where the asset has historically struggled to break through. If Bitcoin breaks above a significant resistance level with strong volume, it confirms the breakout and points towards a potential uptrend.
This chart from TradingView illustrates how these elements combine. You can visualize potential support and resistance levels, volume bars showing trading activity, and an overlaid indicator (perhaps moving averages). The intersection of these factors is where a trading thesis begins to form. For example, a break above resistance with strong volume and a confirming RSI signal might be a good time to consider a long position.
Managing Conflicting Signals and Information Overload
Sometimes, you'll encounter conflicting signals. You might see a bullish chart pattern, but the RSI could be signaling overbought conditions. This is where prioritization becomes essential. Generally, long-term trends and strong volume carry more weight than short-term indicator readings.
It's easy to feel overwhelmed by the sheer amount of information available. Start simple. Focus on a few key indicators and patterns. As you gain experience, you can gradually add more sophisticated tools to your toolkit.
Realistic Expectations and Risk Management
Becoming a proficient trader takes time and practice. Don't expect to be perfect right away. Even seasoned pros make mistakes. Start with small positions, gradually increasing your size as you gain confidence and experience. Effective risk management is paramount. Never risk more than you can afford to lose. This is a fundamental principle in trading.
Building Your Skills on vTrader
The vTrader platform offers the tools you need to hone your crypto technical analysis skills. Use the charting tools to identify patterns, add indicators, and analyze volume. The platform's paper trading feature allows you to test your strategies in a simulated environment without risking real capital.
Your Practice Plan: Building Real Trading Confidence
Mastering crypto technical analysis isn't about memorizing definitions. It's more like learning to play a musical instrument. Sure, the theory is important, but consistent practice is what truly makes you proficient. This section lays out a plan to speed up your learning, all while keeping your capital safe.
Risk-Free Practice: Your Trading Sandbox
Before you jump into live trading with real money, it's wise to practice in a risk-free setting. Many platforms, including vTrader, offer paper trading accounts. These accounts let you trade with virtual money, giving you a chance to test different strategies and learn from your mistakes – without any financial consequences. Think of it as your personal trading laboratory, a safe space to experiment and build confidence. Want to learn more about day trading Bitcoin? Check out our guide on How to Day Trade Bitcoin.
Tracking Progress: The Trading Journal
A trading journal is like a compass, guiding you towards improvement. Every time you make a trade, write it down. Note your entry and exit points, the reasoning behind your decision, and the final outcome. This helps you spot patterns in your trading – both the good and the bad. Are you consistently making profits with certain patterns, but struggling with others? A journal provides the data you need to refine your approach.
Mastering Your Emotions: The Mental Game
Trading involves real money, and emotions can easily get in the way of clear thinking. Fear and greed can quickly override careful analysis, leading to impulsive and often regrettable decisions. A structured learning approach, like the one we’re outlining here, can help you stay disciplined. Your trading journal can also reveal your emotional responses to market ups and downs. This self-awareness is a key ingredient for long-term success.
Realistic Milestones: Measuring Your Growth
Let's be honest: You won't become a trading expert overnight. It takes time and dedication. Set realistic goals and celebrate the small wins along the way. If you're consistently profitable in your paper trading over several months, that’s a good indicator that you're ready to consider trading with a small amount of real capital. Even then, start small. Gradually increase your position size as you gain more confidence and experience.
Continuing Education: Leveling Up Your Skills
The world of crypto technical analysis is always changing. Once you’re comfortable with the basics, explore more advanced concepts. Topics like Fibonacci retracement, Elliott Wave Theory, and harmonic patterns can offer deeper insights into market behavior. Remember, learning is a continuous journey.
Ready to put your knowledge to the test? Join vTrader Now.

Steve Gregory is a lawyer in the United States who specializes in licensing for cryptocurrency companies and products. Steve began his career as an attorney in 2015 but made the switch to working in cryptocurrency full time shortly after joining the original team at Gemini Trust Company, an early cryptocurrency exchange based in New York City. Steve then joined CEX.io and was able to launch their regulated US-based cryptocurrency. Steve then went on to become the CEO at currency.com when he ran for four years and was able to lead currency.com to being fully acquired in 2025.