Crypto swing trading is all about catching those short-to-medium term price moves—the "swings"—that play out over several days or even weeks. It's a strategy that finds a sweet spot between the high-octane world of day trading and the long-game patience of buy-and-hold investing. Instead of executing dozens of trades a day, you find a promising trend, ride it out, and aim to capture a solid chunk of the profit.
Decoding the Rhythms of Crypto Swing Trading
Think of the crypto market less like a chaotic mess and more like an ocean. It has its own tides and waves. A day trader is frantically trying to ride every tiny ripple that hits the shore—it’s exhausting and high-stress. On the other end, a long-term investor (the classic "HODLer") is waiting for a massive tidal wave that might not come for years, ignoring everything else.
Crypto swing trading, then, is like being a surfer. You’re not bothered by the small, choppy waves. Your goal is to spot a good-sized wave forming, ride it for a few days or weeks, and hop off before it crashes. You’re aiming to capture the most powerful part of a single price movement, which we call a "swing."
This balanced method has exploded in popularity, and for good reason. As crypto has gone mainstream, the increased volume and liquidity create more of these "waves" for traders to ride. The numbers don't lie. With U.S. crypto trading volume projected to top $2 trillion in 2025 and DeFi protocols hitting valuations over $50 billion in early 2024, the market has the depth swing traders need. This widespread participation is exactly what fuels the volatility and volume that make swing trading work. You can dig into more cryptocurrency investment statistics to see just how massive this market has become.
Swing Trading vs Other Crypto Trading Styles
To really get a feel for swing trading, it’s helpful to see how it stacks up against the other popular strategies. It occupies a unique middle ground that balances time commitment with profit potential.
The table below breaks down the key differences to clarify where swing trading fits in.
| Trading Style | Typical Holding Period | Time Commitment | Primary Focus |
|---|---|---|---|
| Swing Trading | Days to weeks | Moderate (hours per week) | Technical analysis, chart patterns, trend identification |
| Day Trading | Minutes to hours | High (full-time) | Intra-day volatility, short-term price action |
| Position Trading | Months to years | Low (periodic checks) | Fundamental analysis, long-term market cycles |
As you can see, each style caters to a different temperament and schedule. Swing trading is designed for those who want to be active in the market without being glued to their screens 24/7.
Here's a visual that drives the point home, breaking down the differences in holding periods, risk, and potential returns.
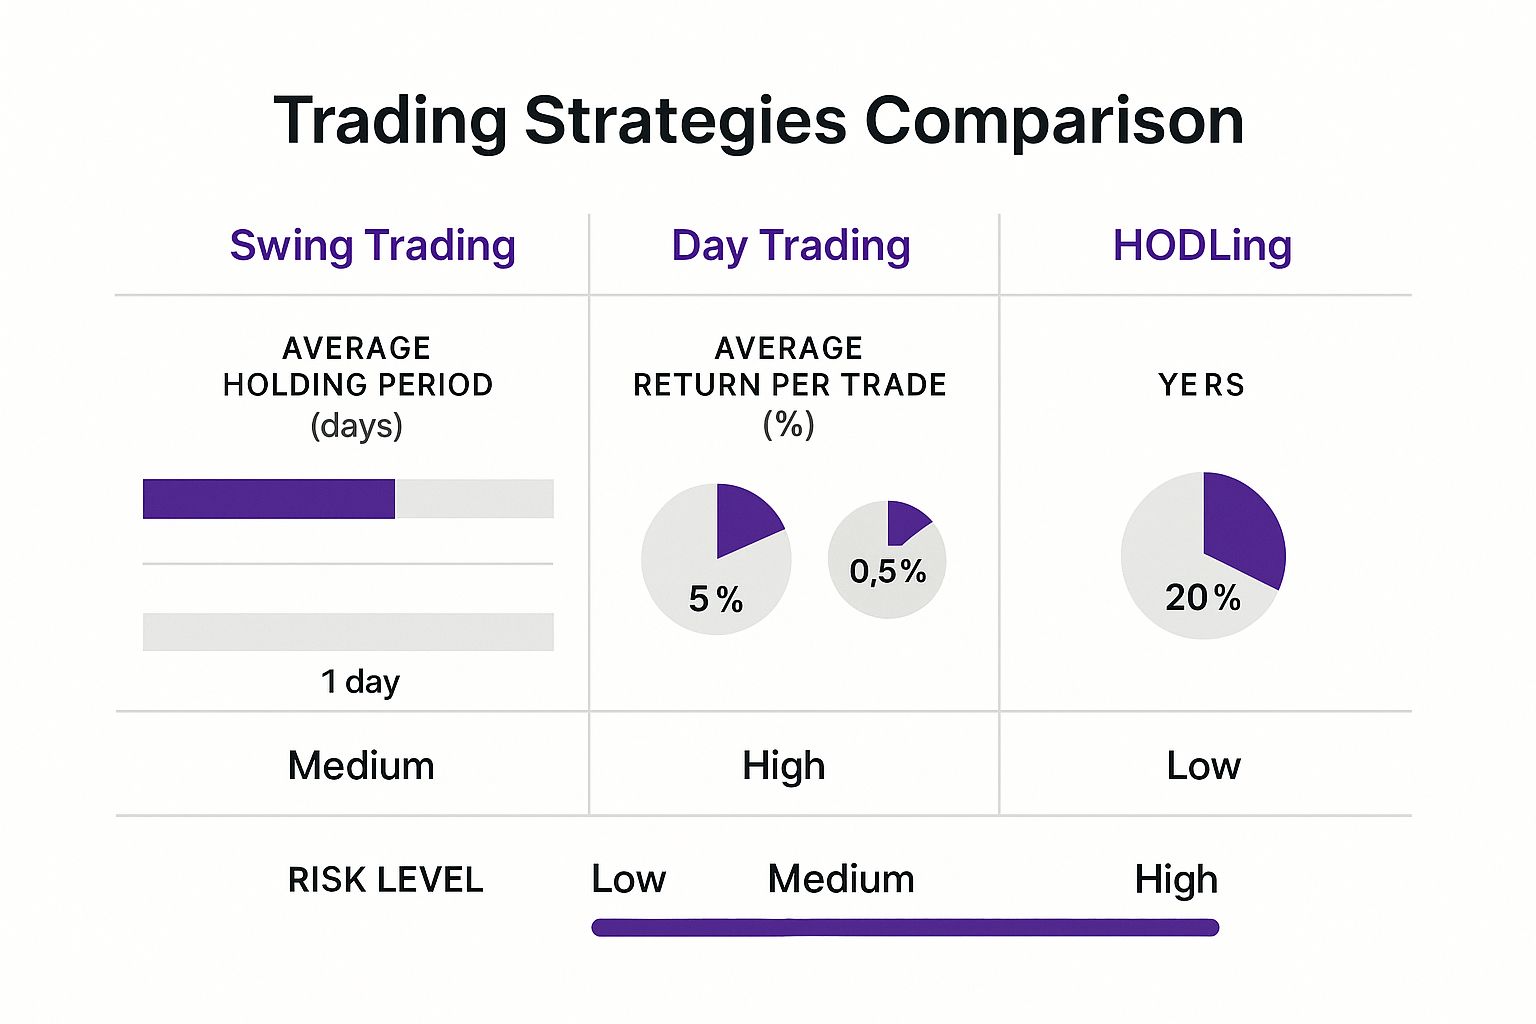
This chart makes it crystal clear: swing trading is the strategic midpoint. It demands less constant monitoring than day trading but brings more frequent action than long-term holding, targeting that sweet spot of moderate risk for consistent, medium-term gains.
Key Takeaway: Swing trading isn’t about being the first to enter or the last to exit a trade. It's about being right during the most profitable part of a trend. Success here comes from solid analysis and patience, not just pure speed.
Foundational Principles of Successful Swing Trading
Let’s get one thing straight: successful crypto swing trading isn't about blind luck or just guessing which way the market will lurch next. It’s a craft, one built on a few core principles that help you feel the market’s rhythm and make moves with confidence.
Mastering these fundamentals is what separates traders who just react to every price alert from those who can anticipate what’s coming next.
First off, you have to learn to love volatility. I know, in most of finance, volatility is a four-letter word synonymous with risk. But for a swing trader? It's our bread and butter. The constant price swings in crypto are the very waves we're trying to ride.
Without those big, juicy price shifts over days or weeks, there’d be no profit to be made. The crypto market’s natural choppiness is what keeps the opportunities flowing.
Identifying The Dominant Market Trend
Before you even think about placing a trade, your first job is to figure out the dominant trend. Think of it like a sailor checking the wind before leaving the harbor. Trying to trade against a powerful trend is like paddling upstream in a strong current—you’ll get exhausted, and you probably won’t get very far.
A market really only moves in three directions:
- Uptrend (Bullish): This is when you see a series of higher highs and higher lows. Here, the game is to buy on the dips (the "lows") and take profits near the peaks.
- Downtrend (Bearish): You'll spot this with a pattern of lower highs and lower lows. The strategy flips: you look to sell or short-sell during the bounces and cover your position at new lows.
- Sideways (Ranging): This happens when the price gets stuck between two clear levels, bouncing back and forth without a real sense of direction. This is where range-trading tactics come into play.
Knowing the bigger picture gives you the context for every single trade. Even something as simple as a moving average on your chart can give you a quick visual on which way the tide is pulling.
Key Insight: The trend is your friend, but remember, friends can change their minds. A swing trader's goal isn't to catch the entire trend from bottom to top but to carve out profitable chunks—the "swings"—along the way.
The Floor and Ceiling: Support and Resistance
Once you have the trend pinned down, it's time to map out the important price levels. We call these support and resistance. The best way to think about them is like a rubber ball bouncing in a room: the floor it bounces off of is support, and the ceiling it can’t seem to break through is resistance.
Support is a price level where a downtrend tends to run out of steam, usually because buyers are waiting to step in. When an asset's price hits a support level, it often bounces.
Resistance is the opposite. It’s a price ceiling where an uptrend stalls or reverses because sellers are taking profits or opening short positions. These levels are your guideposts, helping you build a solid trading plan, even when dealing with less volatile pairs like those involving the USDC stablecoin.
Defining Your Entry and Exit Points
The final piece of the puzzle is having a clear flight plan for every single trade. That means knowing your exact entry point (when to get in) and exit point (when to get out) before you put a single dollar on the line. A classic entry signal is when the price bounces cleanly off a support level during an uptrend.
Your exit plan is a two-part deal: a profit target (often set just below a resistance level) and a stop-loss to cut your losses if the trade goes south. History gives us a fantastic blueprint. Just look at Bitcoin’s wild ride between 2019 and 2025. Its climb from under $4,000 in early 2019 to nearly $13,000 by June—a massive 225% gain—wasn't a straight shot up. It was a series of textbook swings with clear entry and exit opportunities. You can dive into the full data on Bitcoin’s historical price journey on WSOCTV.com to see these patterns for yourself.
Essential Tools for Crypto Swing Traders

Let’s get one thing straight: successful crypto swing trading isn't about blind luck or gut feelings. It's a game of skill, and your success hinges on using the right tools to read what the market is telling you. A savvy trader’s toolkit isn't a crystal ball; it's a set of instruments designed to help you make smart, probability-based decisions.
Think of it like being a pilot. You wouldn't try to fly through a storm without your navigation systems and weather radar. In the same way, you shouldn't be navigating the volatile crypto markets without reliable indicators and chart patterns. These are your guides, helping you understand where the market is headed, how fast it's moving, and when it might be about to turn.
Confirming Direction with Trend Following Tools
The first order of business for any swing trader is figuring out the market's primary direction. This is where trend-following indicators come in—they act as your compass, pointing you toward the dominant flow of capital. The most fundamental of these is the Moving Average (MA).
A Moving Average simply smooths out an asset's price data over a specific period, drawing a clean, flowing line on your chart. This action cuts through the distracting “noise” of minor daily price swings, giving you a much clearer picture of the underlying trend.
- Simple Moving Average (SMA): This is just what it sounds like—the basic average of an asset's price over a set number of periods.
- Exponential Moving Average (EMA): This version puts more weight on recent price action, making it react faster to new information. Many swing traders lean on EMAs precisely for this responsiveness.
When a crypto's price is consistently holding above its key moving averages, like the 50-day or 200-day EMA, it’s a powerful visual clue that you're in an uptrend. If the price is stuck below those MAs, you’re likely looking at a downtrend.
Gauging Market Sentiment with Momentum Indicators
If trend tools are your compass, then momentum indicators are your speedometer. They tell you just how strong a trend is and, more importantly, whether it's starting to lose steam. The king of momentum tools for crypto swing trading is the Relative Strength Index (RSI).
The RSI is an oscillator that bounces between 0 and 100, measuring the speed and magnitude of recent price changes. Its primary job is to spot overbought or oversold conditions.
A Practical Analogy: Imagine the RSI is the tachometer in your car. If the engine is revving way into the red zone (RSI above 70), it’s a sign that things are "overheated" or overbought. A cool-down period, or a price pullback, could be right around the corner. Conversely, if the engine is barely idling (RSI below 30), the asset is "too cold" or oversold, and it might be primed for a bounce.
By combining a trend indicator like an MA with a momentum indicator like the RSI, you get a much more complete view. A price bouncing off a key MA support level while the RSI climbs out of oversold territory? That's the kind of high-probability setup swing traders live for.
Spotting Trend Reversals with Chart Patterns
Chart patterns are the stories that price action tells over time. These visual formations pop up on charts and often signal that a trend will either continue or, even better for a swing trader, reverse course entirely. They are a window into the shifting psychology of the market.
Here are a few classic patterns that should be on every swing trader's radar:
- Head and Shoulders: This is a textbook reversal pattern that often marks the top of an uptrend. It’s formed by three peaks, with the middle "head" being the highest.
- Triangles (Ascending, Descending, Symmetrical): These are usually continuation patterns. They signal a period of consolidation—a brief pause—before the price breaks out and continues in the direction of the original trend.
- Flags and Pennants: These are short-term patterns that show up after a powerful price move. Think of them as the trend just catching its breath before the next leg up or down.
Learning to spot these patterns takes screen time and practice, but it's a skill that can give you a real edge by helping you anticipate major moves before the rest of the crowd piles in. For anyone looking to get a deeper grasp on these trading concepts, the vTrader Academy is packed with resources and interactive learning modules to get you up to speed.
Of course, all these tools rely on having clean, immediate data. To gather real-time market information efficiently, many traders use powerful data extraction techniques to automate the collection process. This ensures your analysis is always based on the very latest market action, giving you the best possible foundation for your trading decisions.
Actionable Crypto Swing Trading Strategies
Alright, you’ve got the tools. Now it's time to put them to work. A sharp crypto swing trader doesn't rely on one single, magic-bullet strategy. Instead, they have a playbook filled with different approaches they can pull out depending on what the market is doing right this second. Is a coin riding a powerful wave, bouncing between two clear price points, or getting ready to make a huge move?
Each of these market moods requires a different game plan.
We're going to dive into three core strategies that are the bread and butter for most successful swing traders. Don't think of these as rigid rules. They’re more like flexible frameworks that help you spot solid opportunities in the wild world of crypto. Once you get a feel for these, you'll have the confidence to trade whatever the market throws at you.
Riding the Wave with Trend Trading
This is probably the most intuitive strategy out there: Trend Trading. The old saying goes, "the trend is your friend," and that’s exactly the idea here. Your job is to spot a clear uptrend or downtrend and simply ride it for as long as it lasts. You aren't trying to perfectly time the top or bottom—you're just hopping on for the ride.
In an uptrend, which you can spot by seeing a pattern of higher highs and higher lows, the classic move is to buy on the pullbacks, or "dips." Your entry point could be a bounce off a key support level or a moving average. From there, you hold on as the price climbs, aiming to take profits near the last high point or at a known resistance level.
When the market is in a downtrend, you just flip the script. You look for chances to sell (or short-sell) when the price rallies up to a resistance level, cashing in as the price continues its slide.
Key Insight: Trend trading is all about patience. You have to trust your initial analysis and fight the temptation to jump out too soon. Let your winners run as long as the trend is on your side.
Profiting from Sideways Action with Range Trading
But what about when the market isn't really going anywhere? Sometimes a crypto gets stuck, bouncing between a solid floor (support) and a hard ceiling (resistance). We call this a "ranging" market, and it opens the door for a strategy called Range Trading.
Think of the asset as a tennis ball bouncing between the floor and the ceiling. The game plan is simple: buy when the price taps the support level at the bottom and sell when it hits the resistance level at the top. The RSI indicator is your best friend in this scenario. An "oversold" reading near support can give you the green light to buy, while an "overbought" signal near resistance confirms it's a good time to sell. This approach works beautifully right up until the price finally breaks out of the range.
Capturing Explosive Moves with Breakout Trading
After a coin has been consolidating quietly in a range for a while, it often makes a powerful, decisive move. A "breakout" is when the price shatters a key resistance level, and a "breakdown" is when it crashes through critical support. Breakout Trading is all about catching the explosive momentum that typically follows.
The strategy here is to place a buy order just above a major resistance level or a sell order just below a key support zone. A sudden spike in trading volume is what you want to see—it confirms there's real conviction behind the move. This strategy is for traders who are looking to jump on a new trend right as it’s born.
Crypto’s history is full of perfect examples. During Bitcoin's wild ride from 2018–2020, traders could have used all three strategies. The brutal downtrend in 2018 was a textbook case for trend trading. The quiet periods of consolidation that followed were prime for range trading, right before the massive breakout in April 2019 gave breakout traders a chance to capitalize on the new bull run.
At the end of the day, every trading strategy has the same goal: making a profit. For a deeper dive into how profits are realized in crypto, you can find great info on understanding Bitcoin profits. And for those looking to build out their portfolio beyond just trading, you might be interested in how some assets can earn you passive income in our guide to crypto staking.
Mastering Risk Management to Protect Your Capital
Let's get one thing straight. The single most vital skill in crypto swing trading—or any trading, really—is playing defense. Chasing those massive gains is a thrill, but the pros know that true longevity in this game comes from protecting your capital above all else.
Think of your trading account as your lifeblood. Your number one job is to keep it safe. Without a rock-solid risk management plan, a string of brilliant trades can be completely wiped out by a single bad move. These aren't just helpful tips; they are the absolute foundation of a sustainable trading career.
Setting Your Automatic Safety Net with a Stop-Loss
First up is the most non-negotiable rule in the book: always use a stop-loss order. A stop-loss is simply an automatic command you place with your exchange to sell your position if the price hits a predetermined level. It’s your emergency exit, planned before things go sideways.
Imagine walking a tightrope. Your stop-loss is the safety net below. You hope you never have to use it, but you'd be a fool to start walking without it. Setting one is what keeps a small, manageable loss from turning into a portfolio-ending catastrophe.
The trick is to place it based on cold, hard technical analysis, not gut feelings. A solid approach is to set your stop-loss just below a key support level for a long position, or just above a major resistance level if you're going short. This gives your trade some breathing room without exposing you to a world of hurt.
The 1% Rule: A Trader’s Best Friend
So, how much should you actually put on the line for any given trade? This is where the 1% Rule becomes a trader's best friend. The concept is brilliantly simple: never risk more than 1% of your total trading capital on a single trade.
If you have a $5,000 account, your maximum acceptable loss on any one position is $50. This doesn't mean you can only buy $50 of crypto. It means the gap between your entry price and your stop-loss price, multiplied by your position size, shouldn't top $50.
Key Takeaway: The 1% Rule is about survival. If you hit a nasty losing streak of ten trades in a row—and it happens—you've only lost 10% of your capital. You can absolutely recover from that. Without this rule, a few bad bets could knock you out of the game for good.
This principle instills discipline and stops you from making those emotional, all-or-nothing bets that have ended countless trading careers before they even got started.
Calculating Your Risk-to-Reward Ratio
Finally, before you even think about clicking "buy," you have to ask yourself one crucial question: "Is the potential payoff worth the risk I'm taking?" This is where the risk-to-reward ratio (R/R) comes in. It's a quick calculation comparing what you stand to gain against what you stand to lose.
To figure it out, just divide your potential profit by your potential loss.
- Potential Loss: The distance from your entry price to your stop-loss.
- Potential Profit: The distance from your entry price to your take-profit target.
Let's walk through an example. You spot a crypto swing trade opportunity. You decide to buy at $100, set your stop-loss at $95, and aim for a profit target of $115.
- Your risk is $5 per coin ($100 – $95).
- Your potential reward is $15 per coin ($115 – $100).
- Your R/R ratio is $15 / $5 = 3. We write this as a 1:3 ratio.
This means you are risking $1 for a shot at making $3. Most seasoned traders won't even look at a trade with a risk-to-reward ratio lower than 1:2. By cherry-picking trades where the potential upside is significantly greater than the downside, you put the mathematical odds firmly in your favor over the long haul.
Your First Crypto Swing Trade: A Walkthrough
All the theory in the world is great, but nothing builds real confidence like getting your hands dirty. So, let’s walk through a complete, real-world crypto swing trade example, from spotting the setup to cashing out. We’ll use a historical chart of Ethereum (ETH) to connect all the dots and turn theory into a practical process you can repeat.
Picture this: you're looking at the ETH/USD chart. The first thing you do is just observe. You notice that for the last two weeks, the price has been trapped, bouncing between a solid floor at $1,950 and a stubborn ceiling at $2,100. This is a classic consolidation phase—the calm before the storm. The market is coiling up, building energy for its next big move.
Step 1: Identifying the Opportunity
Your weapon of choice here is Breakout Trading. You're not interested in the tiny gains you might scalp inside this tight channel. You’re playing the long game, waiting for the price to make a powerful, decisive move and break free from this sideways grind. A clean break above $2,100 would be a huge signal that buyers have wrestled control from the sellers, potentially kicking off a new uptrend.
That’s your trade thesis. You've pinpointed the key level to watch, and now you need a concrete plan to pull the trigger if and when it happens.
Step 2: Confirming with Indicators
You never want to jump into a trade based on price alone; that’s a recipe for getting faked out. You need confirmation from your trusted technical tools. On your chart, you have the 50-day EMA and the Relative Strength Index (RSI) pulled up. As Ethereum creeps toward that $2,100 resistance, you spot two encouraging signs:
- The 50-day EMA is starting to curl upwards just below the price, hinting that underlying momentum is building.
- The RSI is sitting comfortably around 60, not even close to being overbought. This tells you there’s plenty of gas in the tank for the price to run higher without being considered overheated.
A few hours later, you see it: a big, bold green candle slices through $2,100 and closes firmly above it. At the same time, trading volume spikes. This is the confirmation you were waiting for. The breakout is real, and your indicators are giving you the green light.
Step 3: Executing the Trade Plan
Now it's go-time. You execute with precision because you already have a full plan mapped out before risking a single cent.
- Entry Point: You place your buy order at $2,110, just a hair above the breakout level to make sure the move has legs.
- Stop-Loss: Your safety net is set at $2,040. This is tucked safely below the old $2,100 resistance, which should now act as the new support level. Your maximum risk on this trade is $70 per ETH.
- Profit Target: A quick scan of the chart reveals the next major historical resistance level sits at $2,320. That becomes your profit target. Your potential reward is a sweet $210 per ETH.
Calculating the Payoff: Your risk-to-reward ratio is $210 (potential profit) divided by $70 (potential loss). This gives you a fantastic 1:3 R/R. In plain English, you're risking $1 to potentially make $3. That’s a trade setup any swing trader would love to see.
Over the next nine days, the trend does exactly what you hoped. The price climbs steadily, eventually hitting your $2,320 target, and your take-profit order fills automatically. You’ve just planned your trade and traded your plan—a successful crypto swing from start to finish. While this example uses Ethereum, the core principles apply to almost any asset, including stable-value coins, which you can read about in our deep dive on the Dai stablecoin.
Common Crypto Swing Trading Questions
It's one thing to read about trading theory, but another thing entirely to put your own money on the line. As you start making moves, questions are bound to pop up. This is a totally normal part of the learning curve in crypto swing trading, and we've got answers to the most common ones we hear from new traders.
Think of this as plugging the little gaps in your knowledge. Getting these practical details sorted out early can save you from some painful, expensive mistakes and get you on the path to consistent trading much faster.
How Much Capital Do I Need to Start?
This is the big one, the question everyone asks. The answer? Probably less than you think. You don’t need a massive war chest to get into crypto swing trading. Because you can buy fractions of a coin, you can realistically start with as little as $100 to $500.
What's more important than the dollar amount, though, is your mindset. A small account isn't your ticket to a Lamborghini overnight. It's your training ground. Use it to learn the ropes, dial in your strategy, and build rock-solid risk management habits. As you get better, you can start adding more capital.
Expert Insight: Consider your first deposit your "tuition fee" for real-world market education. Focus on mastering the process first, not the profits. If you get the process right, the profits will eventually take care of themselves.
What Is the Best Timeframe for Swing Trading?
Swing traders live in a sweet spot, capturing market moves that last anywhere from a few days to several weeks. There’s no single "best" timeframe, but the pros almost always use a combination of them to get a clearer picture.
- The Big Picture (Daily Chart): Use a higher timeframe like the daily chart to spot the main trend. Is the market bullish or bearish? Where are the major support and resistance levels? This is your strategic map.
- The Entry Point (4-Hour Chart): Drop down to a lower timeframe, like the 4-hour chart, to nail your entries and exits. A bullish signal on this chart is far more powerful when you know the daily trend is already pointing up.
This multi-timeframe approach is all about making sure you’re swimming with the current, not against it. It's a simple trick that dramatically stacks the odds in your favor. For more in-depth answers on how the platform works, don't forget to check out the vTrader FAQ section.
Ready to stop reading and start doing? vTrader gives you a commission-free trading environment loaded with the advanced tools you need to find your edge. Open an account today and we’ll drop a $10 sign-up bonus into your account to get your first swing trade started. Sign up with vTrader now!

Steve Gregory is a lawyer in the United States who specializes in licensing for cryptocurrency companies and products. Steve began his career as an attorney in 2015 but made the switch to working in cryptocurrency full time shortly after joining the original team at Gemini Trust Company, an early cryptocurrency exchange based in New York City. Steve then joined CEX.io and was able to launch their regulated US-based cryptocurrency. Steve then went on to become the CEO at currency.com when he ran for four years and was able to lead currency.com to being fully acquired in 2025.