Think of the Crypto Fear and Greed Index as the market's pulse. It's a powerful sentiment meter that boils down a ton of complex data into a single, easy-to-read score from 0 (Extreme Fear) to 100 (Extreme Greed). This helps traders get a quick read on whether the market is panicking or getting a little too euphoric.
What The Crypto Fear And Greed Index Really Means
This index isn't a crystal ball for predicting prices. A better way to see it is as a weather forecast for market emotions. Just like a meteorologist uses data on humidity, wind, and pressure to predict a storm, the index pulls together various market factors to show you the collective mood of investors. It’s built to help you cut through the daily noise of charts and headlines.
So, are investors dumping their bags in a panic? Or are they caught up in a wave of FOMO (Fear Of Missing Out) and buying with reckless abandon? The index gives you a snapshot of the market’s psychological state with one simple number.
Decoding Market Sentiment
At its heart, the Crypto Fear and Greed Index is a classic contrarian indicator. It works on a simple but powerful premise: the crowd is often wrong at the extremes.
- Extreme Fear (a low score) often signals that investors are overly pessimistic. For a savvy trader, this can be a flashing green light, suggesting assets are oversold and a buying opportunity might be around the corner.
- Extreme Greed (a high score) can be a red flag. It suggests the market is overheating, driven by hype rather than fundamentals. This could mean a correction is due, signaling a time to be cautious.
Here’s a look at what the index looks like on a typical day, showing the current sentiment alongside historical data.
This daily snapshot gives you an immediate feel for where the market's head is at, adding crucial context to price action. Getting a handle on this fundamental push and pull between fear and greed is the first step toward making more rational, less emotional trading decisions. You can check out the live index and its components on the official CFGI website.
Deconstructing The Six Factors Behind The Score
The Crypto Fear and Greed Index doesn't just pull a number out of thin air. Its final score is a carefully calculated blend of six distinct data points, each acting like a unique sensor to gauge the market's emotional temperature. Getting a handle on these components is the key to really appreciating the index's depth.
This multi-layered approach is what makes the index so powerful. It weaves together six key indicators—market volatility, trading volume, social media buzz, Bitcoin's dominance, and search engine trends—all weighted differently based on their market impact. It’s a clever method for putting a number on the collective mood of investors worldwide. You can dig deeper into these components on the official website.
The following infographic breaks down how these different signals feed into the overall fear and greed score.
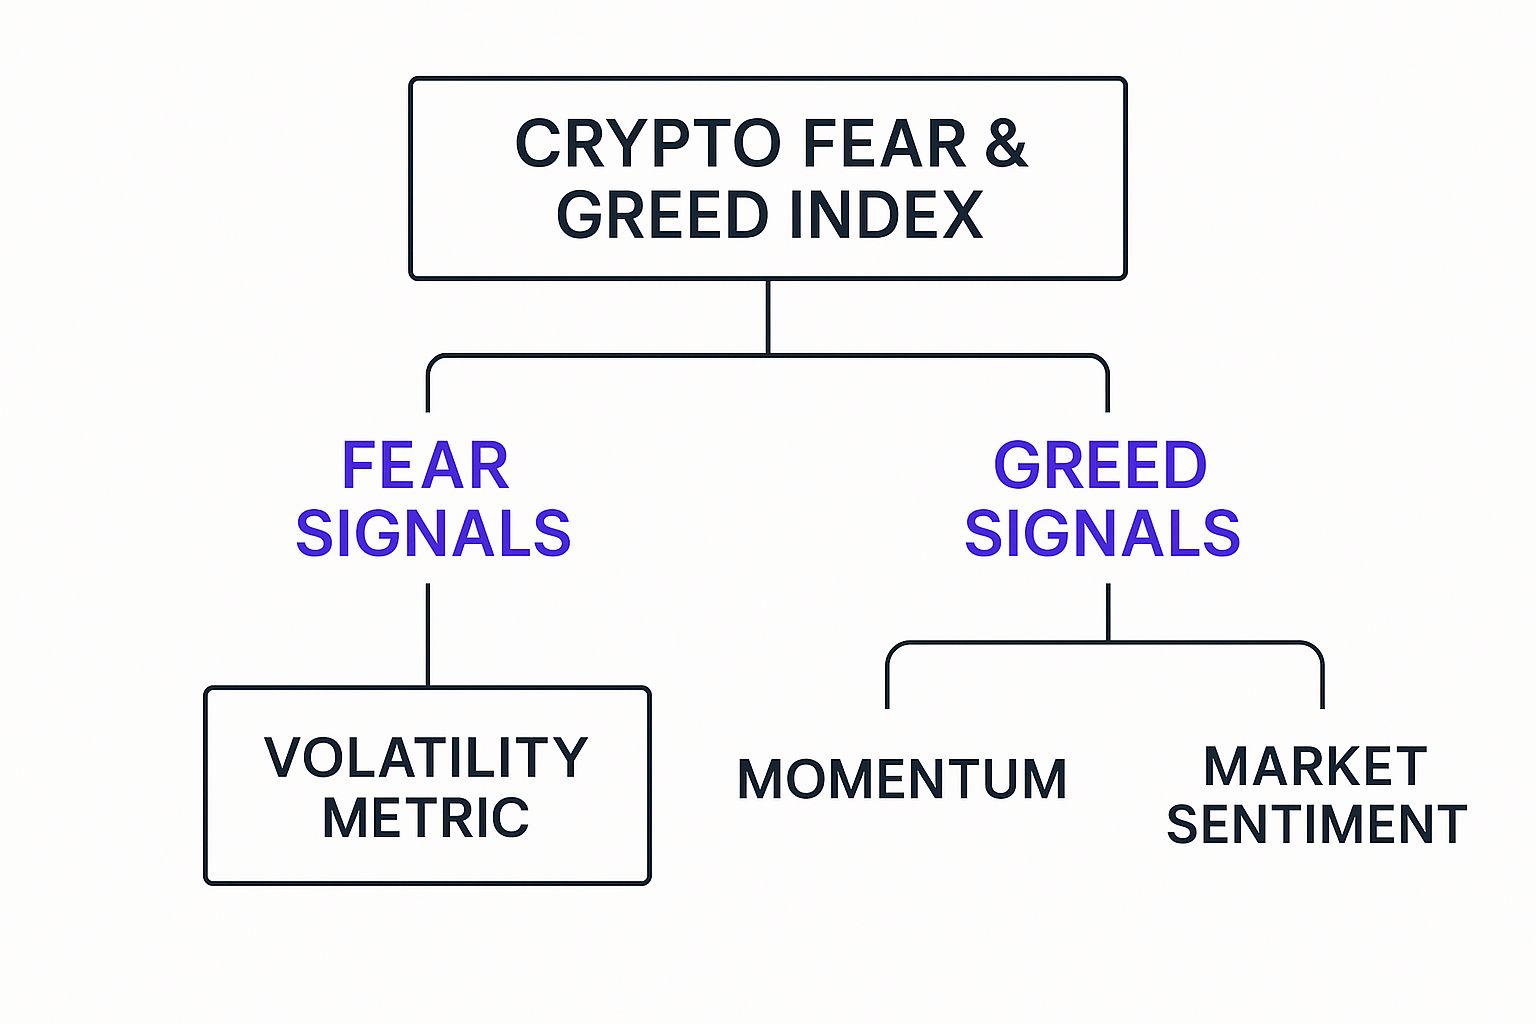
As you can see, it’s not about any single metric. The index creates a more balanced and reliable view by synthesizing all these different signals.
Market Momentum And Volume
First up, the index looks at Market Momentum and Volume. This involves comparing the current trading volume to the average over the last 30 and 90 days. Think of it like the roar of a crowd at a stadium.
A sudden, massive spike in buying volume as prices climb is like a deafening cheer from the stands—a crystal-clear sign of Extreme Greed.
On the flip side, consistently high selling volume on down days suggests widespread panic and points squarely toward Extreme Fear. This factor is a raw, direct measure of the market's energy.
Unpacking Market Volatility
Volatility is just a fancy word for how wildly prices are swinging. The index checks Bitcoin's current volatility against its 30 and 90-day averages. An unusual spike in volatility is a classic sign of a fearful market, as big, unpredictable price swings tend to freak people out and trigger panic selling.
When prices are stable or climbing steadily, investors feel confident. But when they start whipsawing up and down, fear quickly takes over. This factor is designed to capture that anxiety.
Social Media And Surveys
Market sentiment isn't just hidden in the charts; it's right there in our online conversations. The index keeps a close eye on social media chatter, especially on platforms like X (formerly Twitter). It tracks things like post volume and interaction rates for crypto-related hashtags. A big surge in positive engagement is often a sign that greed and FOMO are starting to build.
On top of that, weekly crypto polls and surveys feed into this component, offering a direct pulse on what a sample of investors is thinking and feeling.
These factors give us a more human-centric view of the market mood:
- Social Media Analysis (15% Weight): This piece scans for keywords and hashtags, measuring how quickly and how positively people are talking about crypto.
- Surveys (15% Weight): Although it's currently on pause, this factor has historically provided direct feedback from investors themselves.
- Bitcoin Dominance (10% Weight): This measures Bitcoin's slice of the total crypto market cap pie. When its dominance rises, it often signals a "flight to safety" as investors dump riskier altcoins for Bitcoin—a sign of fear. When it falls, it can mean investors are getting greedy and venturing into more speculative assets.
- Google Trends (10% Weight): This looks at what people are searching for. A spike in searches for "Bitcoin price manipulation" suggests fear is setting in, while a surge in "how to buy crypto" points to growing greed.
By weaving these six distinct threads together, the Crypto Fear and Greed Index creates a rich, textured picture of the market's collective psychology—something far more revealing than price alone.
How To Read The Index Like A Pro
Knowing what goes into the Fear and Greed Index is one thing, but learning how to actually read it is where the magic happens. The index works on a simple 0 to 100 scale, broken down into four emotional zones that give you a real-time snapshot of the market’s collective mood.
Think of it like a weather forecast for the market. You don't just see the temperature; you understand if you need to grab a jacket or sunglasses. A low number on the index screams fear, while a high number signals that greed is running the show.
Decoding Extreme Fear And Fear
When the index drops into the 0-24 range, you’re looking at Extreme Fear. This is the zone of maximum pessimism. Panic selling often takes over, and the prevailing wisdom is that prices are heading straight to zero. It's a chaotic environment where investors are dumping assets left and right—often creating a perfect storm for contrarian traders.
A little less intense, but still shaky, is the Fear zone, which covers the 25-49 range. The panic hasn’t totally set in, but there's a heavy dose of anxiety and uncertainty in the air. Investors are on edge, leading to choppy, unpredictable price movements as buyers and sellers wrestle for dominance.
Key Takeaway: Periods of extreme fear often represent points of maximum financial opportunity. When everyone else is panic-selling, assets can become seriously undervalued, creating prime entry points for traders who keep their cool.
Navigating Greed And Extreme Greed
Once the needle swings past the halfway point into the 51-74 range, we're in Greed territory. Optimism is back in town, and that familiar FOMO (Fear Of Missing Out) starts to take hold. More and more people are buying in, driving prices higher as the overall mood turns bullish.
But the real red flag is the Extreme Greed zone, from 75-100. This is the market’s euphoria phase. The hype is deafening, and investors are piling on risk, completely convinced that the only way is up. Historically, this has been a massive warning sign that the market is overheated and a sharp correction could be just around the corner.
Learning to spot these shifts is a game-changing skill. You can sharpen your ability to read market trends with the educational resources available at the vTrader Academy.
To make things even clearer, here’s a quick-reference guide that breaks down what each score means and how you might react.
Crypto Fear and Greed Index Score Interpretation
This table gives you a snapshot of the different score ranges, what they suggest about market sentiment, and how traders might position themselves accordingly.
| Score Range | Sentiment Label | Market Indication | Potential Strategy |
|---|---|---|---|
| 0 – 24 | Extreme Fear | Widespread panic and capitulation. Assets may be oversold. | Look for potential buying opportunities and strong entry points. |
| 25 – 49 | Fear | General anxiety and market uncertainty. Investors are cautious. | Remain cautious, but monitor for signs of a market bottom. |
| 51 – 74 | Greed | Growing optimism and FOMO. Market is in an uptrend. | Consider taking partial profits or tightening stop-losses. |
| 75 – 100 | Extreme Greed | High euphoria and potential market overheating. | Exercise extreme caution; this may signal a coming correction. |
By keeping this table handy, you can quickly translate the index's number into a strategic insight, helping you make more informed decisions instead of just following the crowd.
Real-World Examples Of The Index In Action
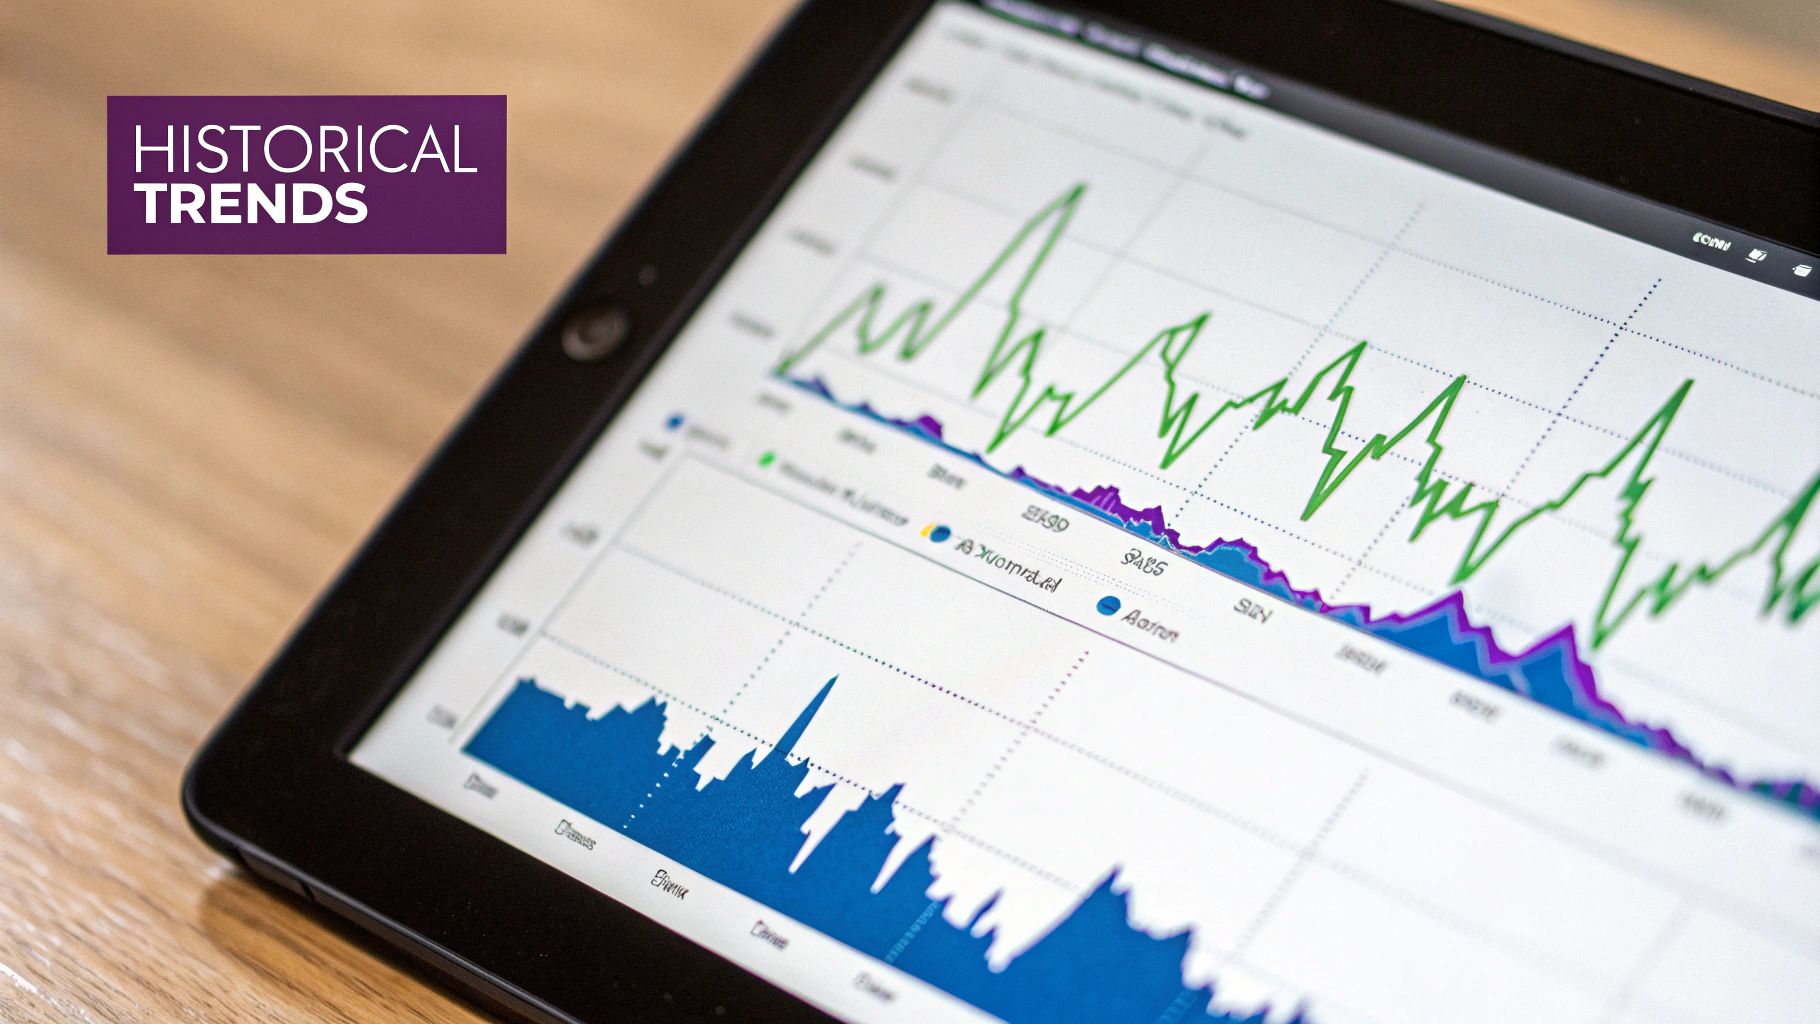
The theory is one thing, but seeing the Crypto Fear & Greed Index work its magic during massive market shifts is another thing entirely. It’s only when you look back at historical charts that you see how the index’s readings lined up almost perfectly with major market turning points.
This isn't just some crypto mood ring. These real-world examples show the index is a powerful lens for spotting when the herd has stampeded too far in one direction, often right before the market pulls a 180.
The Pandemic Plunge: A Case Of Extreme Fear
March 2020 was one for the history books. As the world ground to a halt over the COVID-19 pandemic, financial markets went into a complete nosedive. Crypto got hit especially hard. The fear was thick in the air, with investors dumping everything in a mad dash for cash.
During this chaos, the Fear & Greed Index cratered, hitting single-digit lows that screamed absolute terror. But for the savvy contrarian trader, this wasn't a signal to run—it was a screaming buy signal. The market hit rock bottom right around that time, setting the stage for one of the most explosive bull runs crypto has ever seen.
This event is a perfect lesson in how to use the index:
- Peak Fear Often Signals a Bottom: When the index is in the gutter, it’s a strong sign that the sell-off is exhausted and capitulation is complete.
- Contrarian Thinking Pays Off: Having the guts to buy when everyone else is panic-selling is tough, but it's often the most profitable move.
The 2021 Bull Run: A Tale Of Extreme Greed
Now, let's flip the script. The bull run of late 2020 and early 2021 was the polar opposite. Bitcoin was smashing through all-time highs, big-name institutions were jumping in, and the market went from fearful to euphoric. FOMO was off the charts, with retail investors piling in, thinking the only way was up.
During this frenzy, the index was consistently flashing scores in the 90s. This was a massive red flag, signaling extreme, unsustainable greed. The market was dangerously overheated and practically begging for a major correction.
And just as the index warned, the party didn't last forever. Those peaks of extreme greed were followed by nasty pullbacks. In February 2021, for example, the index surged as Bitcoin’s price shot up from roughly AU$10,000 to AU$50,000. You can dive deeper into historical market moves on the vTrader news hub.
These moments of pure euphoria often marked local tops. They were the perfect time for smart traders to think about taking some profits off the table or at least tightening their stop-losses. By heeding these warnings, investors could have protected their gains before the inevitable downturn. It just goes to show how valuable the index is for spotting when the hype has gone too far.
Using The Index In Your Trading Strategy
Knowing how to read the Crypto Fear and Greed Index is a great first step, but the real magic happens when you weave its insights directly into your trading plan. This tool isn't a crystal ball—it won't tell you the future. Think of it more like a seasoned co-pilot, giving you critical context on market psychology so you can make smarter, less emotional moves.
By bringing the index into your workflow, you can shift from being a reactive trader—one who gets swept up in hype cycles and panic-sells—to a proactive and strategic one. It’s like having a finger on the pulse of the market’s collective mood, helping you anticipate potential shifts before they happen.
There are two main ways traders put the index to work. You can either use it as a contrarian indicator to bet against the herd or as a confirmation tool to give your other technical signals more weight.
Embrace The Contrarian Approach
The most popular way to use the Fear and Greed Index is as a contrarian tool. The logic is simple but incredibly powerful: do the exact opposite of what the emotional, panicked crowd is doing. It’s a strategy echoed by legendary investor Warren Buffett, who famously advised to be "fearful when others are greedy and greedy when others are fearful."
Here’s how that plays out in the real world:
- When the Index Shows Extreme Fear (0-24): This is your cue to go bargain hunting. Widespread panic often triggers capitulation, a moment when investors dump valuable assets for far less than they’re worth. You shouldn't just buy blindly, of course, but a score in the "Extreme Fear" zone is a green light to start analyzing solid projects that look oversold. It’s time to build your watchlist and scout for strong entry points.
- When the Index Shows Extreme Greed (75-100): Consider this a flashing red light. When euphoria and FOMO are running wild, the market is often overbought and primed for a correction. This doesn't mean you need to sell off your entire portfolio, but it's a smart time to think about taking some profits, tightening your stop-losses to lock in gains, and definitely avoiding opening new long positions at inflated prices.
Confirming Signals From Other Tools
The index becomes even more powerful when you stop looking at it in a vacuum. Instead, use it to either confirm or question what your other technical analysis tools are telling you. It adds a crucial layer of psychological context to the cold, hard data on the charts.
For instance, imagine your go-to indicator, like the Relative Strength Index (RSI), is showing that Bitcoin is oversold. If you glance at the Fear and Greed Index and see a reading of 15 (Extreme Fear), that adds some serious weight to the RSI's signal. The data and the sentiment are aligned, giving you a much more compelling reason to consider opening a long position.
Pro Tip: Combining the Fear and Greed Index with other metrics like Moving Averages (MA) or the MACD can create a robust system. If the price is testing a major support level while the index is screaming extreme fear, it could signal a powerful potential bounce.
On the flip side, if the RSI is deep in overbought territory and the index is showing "Extreme Greed" with a score of 92, that warning becomes almost impossible to ignore. This synergy helps you filter out false signals and boosts your confidence when you do decide to pull the trigger. For a deeper dive, you can cross-reference these signals with tools like the vTrader BTC price prediction chart to see how sentiment lines up with current market structures.
Ultimately, using the index as a confirmation tool helps you trade with the wind at your back.
Common Mistakes And How To Avoid Them
It’s easy to look at the Fear and Greed Index and think you’ve found a crystal ball for the crypto market. But treating it as an infallible predictor is one of the most common—and costly—mistakes a trader can make. To really get the most out of it, you have to know its limits and sidestep the psychological traps that catch so many people.
One of the biggest blunders is assuming the index can pinpoint exact market tops and bottoms. Think of it as a powerful barometer of emotion, not a precision timing device. A reading of "Extreme Greed" doesn't mean a crash is imminent; the market can stay overheated for weeks. Likewise, "Extreme Fear" can drag on long before the real bottom is in.
The index is a lagging indicator. It reflects emotions based on what just happened with prices, it doesn't predict what's coming next. Relying on it alone is like driving while only looking in the rearview mirror.
Avoiding Misinterpretation
Another classic pitfall is forgetting the index's heavy focus on Bitcoin. While BTC sentiment often sets the tone for the entire market, altcoins frequently dance to the beat of their own drum. Applying a Bitcoin-centric reading blindly to an altcoin project with its own unique narrative is a recipe for a bad trade.
Here are a few key mistakes to steer clear of:
- Going "All-In" on Extremes: Never, ever bet the farm on a single reading. Use an extreme score as a signal to start digging deeper, not as a green light to make a massive, impulsive trade.
- Ignoring Other Analysis: The index is a supplement, not a substitute. It should always be used alongside your own technical and fundamental analysis. A low fear score is worthless if the project you're looking at has shaky fundamentals.
- Forgetting Risk Management: No matter what the index is telling you, solid risk management is non-negotiable. Always use stop-losses and manage your position sizes to protect your capital. High trading volumes can also impact your strategy, so understanding how platform costs work is essential. You can learn more about how to manage expenses by reviewing the transparent vTrader fee structure.
Frequently Asked Questions
Got questions? You're not the only one. Here are some of the most common things traders ask about the Crypto Fear & Greed Index.
How Often Is The Crypto Fear And Greed Index Updated?
The index gets a fresh update once every 24 hours. This daily refresh gives you a consistent, day-by-day look at how the market's mood is shifting, creating a steady rhythm for tracking crypto's psychological swings.
Is The Index Useful For Altcoin Trading?
While the index is definitely Bitcoin-centric, it's still a fantastic barometer for the overall crypto market's vibe. Think of it this way: when Bitcoin sneezes, the altcoin market often catches a cold.
That said, individual altcoins can dance to their own beat due to specific news or developments. So, use the index as a general market temperature check, but always pair it with research on the specific asset you're trading.
Can I Rely Solely On The Index For Trading Decisions?
In a word: no. The index is a powerful tool for gauging sentiment, but it's not a crystal ball. It tells you how the market feels, not where it's going next.
Smart traders never fly blind. They combine the index's insights with their own technical analysis, fundamental research, and a rock-solid risk management plan.
Key Takeaway: Think of the index as one instrument in your orchestra. Its job is to add emotional color and context, not to give you a direct buy or sell signal.
For more answers to common trading questions, feel free to check out the detailed info in our vTrader FAQ section.

Steve Gregory is a lawyer in the United States who specializes in licensing for cryptocurrency companies and products. Steve began his career as an attorney in 2015 but made the switch to working in cryptocurrency full time shortly after joining the original team at Gemini Trust Company, an early cryptocurrency exchange based in New York City. Steve then joined CEX.io and was able to launch their regulated US-based cryptocurrency. Steve then went on to become the CEO at currency.com when he ran for four years and was able to lead currency.com to being fully acquired in 2025.