When diving into the world of crypto, you'll often hear traders talk about "technical analysis." But what does that actually mean?
Forget the stuffy, academic definitions you might find elsewhere. Think of crypto currency technical analysis (TA) as learning to read the market's body language. It's a bit like a seasoned sailor who can predict a coming storm just by looking at the clouds, the wind, and the waves.
Instead of getting bogged down in news headlines, project promises, or industry hype (which is called fundamental analysis), TA focuses squarely on the charts. It’s all about decoding the story told by an asset's price action and trading volume.
This entire approach hangs on one big idea: that all the information out there—from breaking news and regulatory chatter to the raw emotions of fear and greed—is already baked into the price. The chart, then, becomes a live recording of the constant tug-of-war between buyers and sellers. By learning to spot patterns in this historical data, you can uncover trends and potential turning points that most people miss.
Decoding Market Psychology Through Charts
At its core, technical analysis is really the study of human behavior, just displayed in a visual format. Those squiggly lines on a price chart aren't random; they're a direct reflection of the market's collective mood. When enough traders start acting on the same beliefs, you get predictable patterns.
For example, see a big price jump accompanied by a huge spike in trading volume? That suggests a lot of conviction from buyers, and the upward trend might just have legs. On the flip side, if the price dips but trading volume is low, it could mean sellers aren't too committed. It might just be a temporary dip, not a full-blown reversal. Your job is to turn what looks like chaos into a story you can understand and act on.
The market is a device for transferring money from the impatient to the patient. Technical analysis provides the framework to cultivate that patience by identifying high-probability setups and filtering out emotional noise.
The Role of TA in a Volatile Market
Let's be honest: the crypto market is a wild ride. It's known for its massive price swings and it never sleeps, running 24/7 without the opening or closing bells you see in the stock market. This relentless pace makes technical analysis an absolutely crucial tool for a few key reasons:
- Identifying Trends: It helps you figure out the market's direction. Are we in an uptrend (making higher highs and higher lows), a downtrend (lower highs and lower lows), or just chopping sideways?
- Timing Entries and Exits: Indicators and chart patterns flash signals for potentially good times to buy or sell. This is all about trying to maximize your gains while minimizing your losses.
- Managing Risk: TA helps you spot key support and resistance levels. These are the logical places to set your stop-losses and take-profit targets, turning your trades from hopeful guesses into a structured plan.
Getting good at this is a journey, not a destination. To build a solid foundation, the VTrader Academy at https://www.vtrader.io/en-us/academy is packed with resources to take you from the basics to more advanced strategies. And if you want to zoom out and understand the bigger picture beyond the charts, you can explore these general cryptocurrency concepts. Ultimately, technical analysis gives you the power to make decisions based on evidence, not just emotion.
Understanding The Foundations of Chart Analysis
Before diving into complex indicators and patterns, you need to get a handle on the core beliefs that drive the entire world of crypto technical analysis. These aren't just abstract theories; they're the foundational principles that give charting its predictive power. Once you understand the "why" behind the squiggly lines, you'll start using the tools with a whole new level of confidence.
Think of these principles as the unbreakable laws of market physics. They provide the logic behind every pattern you'll spot and every signal an indicator flashes. Without them, you’re just staring at noise.
The whole discipline really boils down to three key pillars. Let's break each one down so you can build a solid base for your trading journey.
The Market Discounts Everything
This is the big one—the cornerstone of all technical analysis. It’s the idea that an asset's price, at any given moment, already reflects every single piece of information that could possibly affect it. We're talking news, economic data, regulatory shifts, and even the collective mood of the market.
Imagine the price chart as the ultimate executive summary. In theory, you don’t need to pour over company reports or scan headlines for hours because the market has already done the heavy lifting. All that information gets distilled into a single, crucial data point: the current price.
For example, when a major Bitcoin upgrade gets announced, the reaction—whether it's a flood of buys or a wave of sells—shows up on the chart almost instantly. A pure technical analyst believes they don’t need to be an expert on the upgrade itself; they just need to read the price action that follows. You can see this in action by watching the live Bitcoin price action on vTrader.
Prices Move in Trends
The second core belief is that market movements aren't random walks. Instead, prices tend to flow in identifiable directions—up, down, or sideways. The main job of a technical analyst is to spot the current trend and ride it, not fight it.
An uptrend is simply a series of higher highs and higher lows. A downtrend is the opposite, showing lower highs and lower lows. A sideways trend, or consolidation, is when the price bounces around in a relatively stable range.
"A trend in motion is more likely to stay in motion than it is to reverse." This simple but powerful concept is the heart of trend-following, one of the most popular and effective trading strategies out there.
If you can identify these trends early, you can position yourself to ride the wave of market momentum instead of getting tossed around in the chop.
History Tends To Repeat Itself
The final pillar is all about human psychology. Markets are driven by people, and human nature doesn't really change. Because of this, traders tend to react to similar market situations in very similar ways, time and time again. This repetitive behavior is what creates recognizable chart patterns.
These patterns, which are basically visual representations of the tug-of-war between buyers and sellers, have been identified and cataloged for over a century. A pattern that signaled a price reversal in the stock market 100 years ago often signals the exact same thing in the crypto market today.
Why does this work? Because the emotions that forge these patterns—fear, greed, and hope—are timeless and universal. By learning to spot these historical formations, you gain a statistical edge in guessing what might happen next.
Your Essential Crypto Trading Toolkit
Alright, you've got the basics of chart analysis down. Now it's time to open up the toolbox. Think of technical indicators as specialized lenses, each designed to bring a different aspect of the price action into sharp focus.
Every tool tells a unique part of the market’s story. Learning how to use them together is what really separates the beginners from the seasoned pros.
This isn't just a random collection of gadgets. We're talking about a curated set of instruments built to help you spot trends, gauge momentum, and sniff out potential reversals. A classic rookie mistake is plastering your chart with dozens of indicators, creating more noise than signal. Instead, focus on mastering a few key tools—that’s where you'll find a real edge.
We can break most of these essentials into two camps: tools that show you the direction (trend indicators) and those that measure the speed and strength of price moves (momentum oscillators). Let's kick things off with the ones that help define the trend.
Identifying Market Direction with Trend Indicators
Trend indicators are your compass in the chaotic crypto market. They smooth out the day-to-day price noise to give you a much clearer picture of the overall direction. Is the tide rising, falling, or just going sideways? These tools help you answer that.
The Moving Average (MA) is the bedrock of trend analysis. It’s a simple concept: it calculates the average price of an asset over a set period, drawing a single, smooth line on your chart. A popular strategy is to use two MAs—one short-term (like a 20-day) and one long-term (like a 50-day). When the shorter one crosses above the longer one, it’s often seen as a buy signal. When it crosses below, traders get bearish.
Another powerhouse is Bollinger Bands. This indicator wraps three lines around the price: a simple moving average in the middle, with two outer bands that expand and contract based on market volatility.
- Volatility Gauge: When the bands widen, volatility is high. When they tighten up and "squeeze," it often signals a massive price move is just around the corner.
- Overbought/Oversold Clues: If the price is constantly hugging the upper band, the asset might be overbought. If it’s scraping the bottom band, it could be oversold and due for a bounce.
Using these trend indicators keeps you trading with the market's main current, not against it.
Measuring Market Momentum with Oscillators
While trend indicators point you in the right direction, momentum oscillators act like the speedometer on your dashboard. They tell you about the strength and conviction behind a price move. Is a trend picking up steam, or is it about to run out of gas?
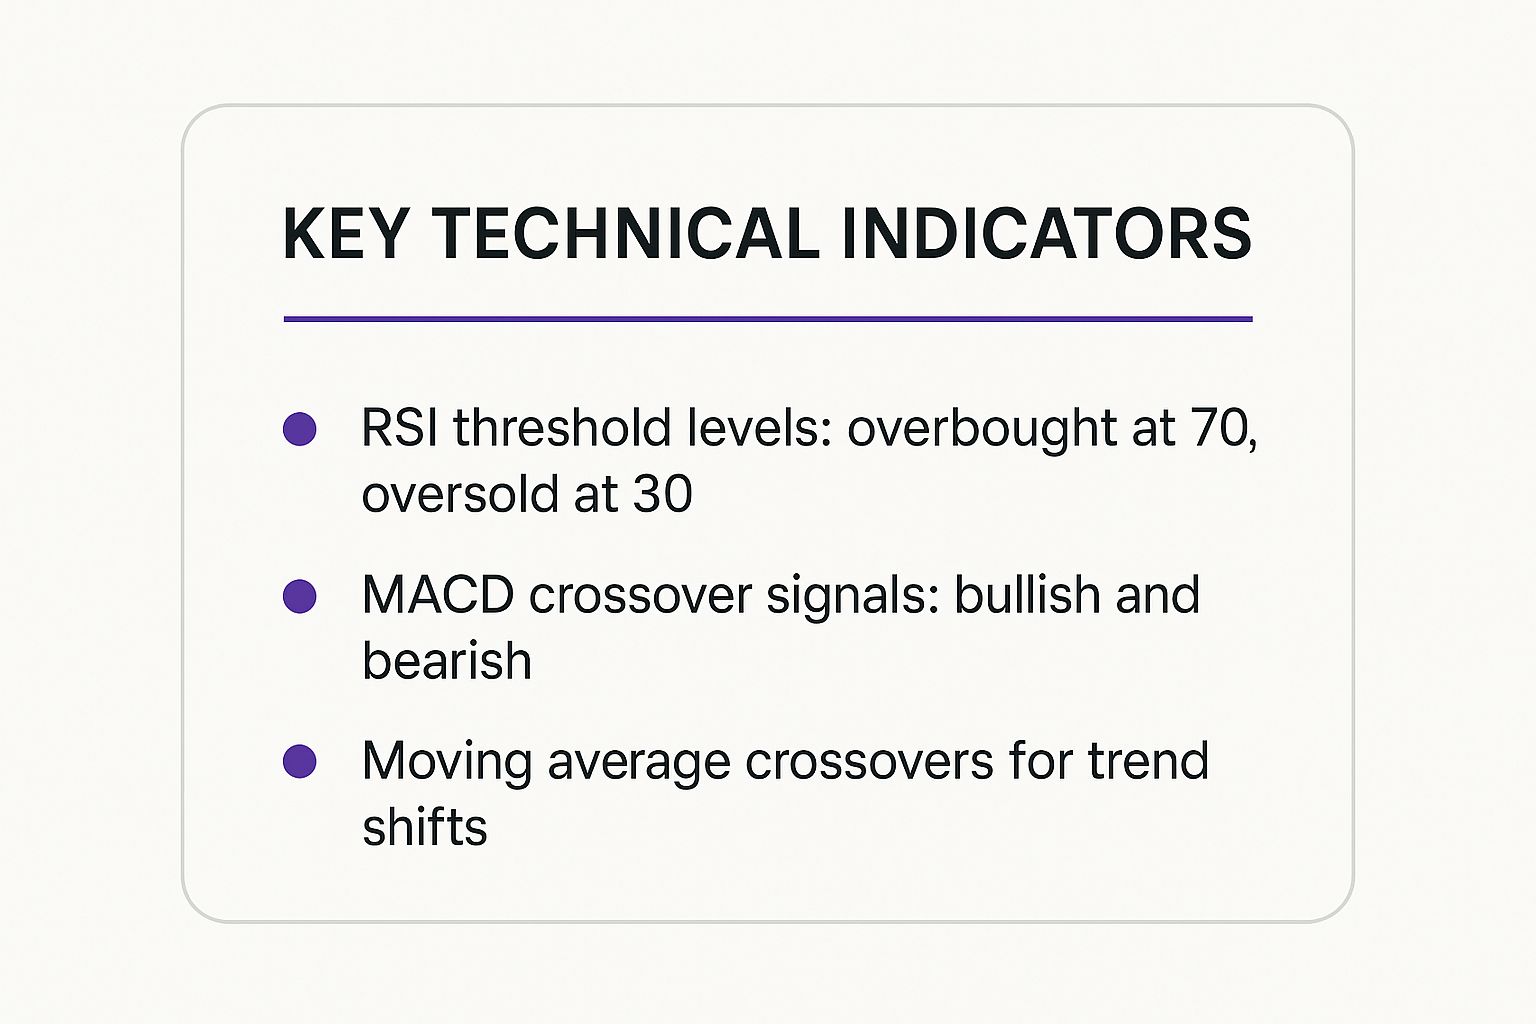
The Relative Strength Index (RSI) is easily one of the most popular oscillators out there. It’s a single line that fluctuates between 0 and 100, measuring the speed and change of price movements. The magic numbers to watch are 70 and 30.
An RSI reading above 70 suggests an asset is getting "overbought" and might be due for a pullback. On the flip side, a reading below 30 signals it could be "oversold" and ready for a rebound.
This chart shows the RSI doing its thing on a crypto chart.
See how the price corrections often line up with the RSI hitting that overbought zone above 70? That’s the kind of signal traders look for to time their entries and exits.
Then there's the Moving Average Convergence Divergence (MACD), another must-have tool for momentum. It features two lines (the MACD line and the signal line) plus a histogram. The most common signal is a simple crossover: when the MACD line crosses above the signal line, it's bullish. When it crosses below, it's bearish. The histogram gives you a visual read on the momentum's strength by showing the distance between the two lines.
Bringing Your Toolkit Together
The real magic happens when you start combining these tools. A single indicator can throw a false signal now and then, but when multiple indicators all point to the same conclusion, your confidence in a trade skyrockets. For example, you might look for a bullish MACD crossover that happens just as the RSI is climbing out of oversold territory.
Technical analysis isn't just a niche strategy; it’s a cornerstone of modern crypto trading. A report from the CME Group found that over 60% of crypto trades on major exchanges use indicators like moving averages, RSI, and MACD. The study also revealed that algorithmic trading, which relies heavily on these tools, made up about 40% of Bitcoin's spot market volume.
But remember, no indicator is a crystal ball. These are tools for weighing probabilities, not for predicting the future with certainty. Practice using them, get a feel for how they behave, and build your experience. While you're at it, keeping an eye on on-chain data can give you an extra edge. For instance, an ETH gas tracker can tell you about network congestion, which can sometimes impact short-term price moves. By mastering this toolkit, you'll stop just looking at charts and start truly reading them.
How To Read Crypto Chart Patterns
While indicators like RSI and MACD give you a great read on the market's pulse, chart patterns tell the real story—the ongoing tug-of-war between buyers and sellers. Think of them as the visual footprints of market psychology, leaving behind crucial clues about where the price might be headed next.
If indicators are the instruments on a ship's dashboard showing speed and direction, then chart patterns are like reading the clouds and the waves. They give you a feel for the bigger picture and what might be brewing on the horizon.
These patterns generally fall into two buckets: reversal patterns, which hint that a trend is running out of gas, and continuation patterns, which suggest the trend is just taking a breather before pushing on.
Spotting Trend Reversals Before They Happen
Reversal patterns are the signals every trader hopes to catch. Why? Because they can help you get in or out of a position right as the market's tide is turning. These formations appear when a trend starts to lose momentum and the opposition—buyers in a downtrend or sellers in an uptrend—starts to gain the upper hand.
One of the most classic reversal patterns you'll see is the Head and Shoulders. This pattern usually shows up at the top of an uptrend and looks exactly like its name suggests:
- Left Shoulder: A price peak followed by a small dip.
- Head: A higher peak, representing the last big push from the bulls.
- Right Shoulder: A lower peak, roughly in line with the left shoulder, showing that buyers are losing their mojo.
The pattern is confirmed once the price breaks below the "neckline," which is a support line connecting the lows between the peaks. A break of the neckline is a strong bearish signal that the uptrend could be over. The flip side, an Inverse Head and Shoulders, can signal a bullish reversal at the bottom of a downtrend.
Another common sight is the Double Top or Double Bottom. A Double Top looks like a capital "M" and happens when the price hits a resistance level twice but fails to break through. This is a clear sign that buyers are exhausted, and sellers are ready to take control. A Double Bottom, which looks like a "W," signals the potential end of a downtrend.
Identifying When a Trend Is Just Taking a Break
Not every pause in the action signals a full-blown reversal. Sometimes, the market is just catching its breath and building up steam to continue in the same direction. These formations are known as continuation patterns.
Flags and Pennants are two of the most frequent continuation patterns you'll encounter. They are small, short-term patterns that typically form after a sharp price move, known as the "flagpole."
- Bull Flag: After a strong rally, the price consolidates into a small, downward-sloping rectangular channel. This looks like a flag on a pole and often signals another move up is coming.
- Bear Flag: This is the opposite of a bull flag. It forms after a steep drop and usually indicates that more downside is on the way.
Pennants are almost identical, but the consolidation part looks like a small, symmetrical triangle. Both of these patterns show a brief pause where the market consolidates before continuing its dominant trend.
To help you get a better feel for these patterns, here's a quick reference table.
Key Chart Patterns At A Glance
This table breaks down some of the most common chart patterns you'll encounter, helping you quickly identify what they might be signaling about the market's next move.
| Pattern Name | Pattern Type | What It Signals | Typical Volume Behavior |
|---|---|---|---|
| Head and Shoulders | Reversal | Potential end of an uptrend | Volume often decreases on the right shoulder |
| Inverse Head and Shoulders | Reversal | Potential end of a downtrend | Volume typically increases on the breakout |
| Double Top | Reversal | Bulls are losing steam; bearish reversal likely | Volume is often lower on the second peak |
| Double Bottom | Reversal | Bears are losing control; bullish reversal likely | Volume often increases on the second bottom |
| Bull Flag / Pennant | Continuation | A brief pause before an uptrend continues | Volume decreases during consolidation, then surges on breakout |
| Bear Flag / Pennant | Continuation | A brief pause before a downtrend continues | Volume dries up during consolidation, then picks up on breakdown |
Keep this table handy as you start analyzing charts. Over time, you'll begin to spot these formations almost instinctively.
This chart helps visualize how you can combine patterns with other indicators for stronger signals. For instance, seeing the RSI dip below 70 just as a Double Top forms can give you much more confidence that the pattern is valid.
The real key to reading charts is context. A Head and Shoulders pattern forming at a major, long-term resistance level with declining volume is far more powerful than one appearing randomly. Patterns rarely work in a vacuum.
Skilled traders don't just see shapes; they see the story of supply and demand unfolding. Recognizing a Head and Shoulders isn't just about spotting three peaks—it's about understanding the narrative of buying pressure failing as selling pressure takes over.
This skill lets you form an educated guess about where the market is likely to go. For a closer look at how these patterns play into forecasting, our guide on Bitcoin price prediction methodologies offers some deeper insights. By combining pattern recognition with other tools, you can build a much stronger framework for your trading decisions.
Building Your First Trading Strategy
Knowing how to use a few indicators or spot a chart pattern is a great start, but the real magic happens when you combine them into a coherent trading strategy. A strategy isn't just about finding one good signal; it's a complete, rule-based system that dictates your every move.
The goal here is to shift from reacting to market swings with emotion to executing a disciplined plan. A solid strategy tells you exactly when to get in, where to set your stop-loss to protect your capital, and when it’s time to cash in your profits. Without one, you're essentially just gambling.
A powerful concept you'll hear seasoned traders talk about is confluence. This is the sweet spot where multiple, independent tools all point to the same conclusion. A single indicator can easily throw a false signal, but when your trend, momentum, and chart patterns all line up, the odds of a winning trade stack heavily in your favor.
The Power of Confluence
Think of it like this: you're trying to figure out if it's going to rain. One friend points out the sky is getting dark—that's one signal. Another checks a barometer and sees the pressure is dropping fast—a second signal. A third pulls up the weather app, which shows a 70% chance of rain. With all three signs pointing to the same outcome, you're grabbing an umbrella with confidence.
Trading confluence is the exact same principle. You're looking for a chorus of indicators singing the same tune, not just a lone voice in the wilderness. This helps you filter out the market noise and avoid getting faked out by a misleading signal, which happens all the time in the volatile crypto world.
As you start piecing together your first strategy, it’s also smart to keep an eye on the broader trends in the cryptocurrency trading industry. Understanding the bigger picture gives you the context you need to interpret what you’re seeing on the charts.
A Practical Strategy Example
Let's walk through building a simple, yet effective, trend-following strategy using three common tools. The idea is to buy into a clear uptrend right after the price has dipped, giving us a better entry point.
Our Three-Part Checklist:
- Trend Confirmation (The Compass): We’ll use the 50-period Exponential Moving Average (EMA). If the price is consistently trading above the 50 EMA, we'll consider the trend bullish and will only look for opportunities to buy.
- Entry Timing (The Speedometer): Here, we'll use the Relative Strength Index (RSI). We want to buy on a pullback, so we’ll watch for the RSI to dip near the 40-50 level—showing a temporary pause in momentum—before it starts to tick back up.
- Risk Management (The Blueprint): Finally, we'll use a recent chart pattern or support level. We can identify a recent swing low or a clear support zone and set our stop-loss just below it. This protects us if the trend suddenly decides to reverse course.
With this structure, you have a clear game plan. You patiently wait for the market to check all three of these boxes before you even consider hitting the "buy" button.
A trading strategy is your personal rulebook for navigating the market. It’s what separates disciplined trading from impulsive gambling, turning chaos into a structured process with a statistical edge.
This structured, data-driven approach is becoming more critical than ever. The global cryptocurrency market, currently valued around $5.7 billion, is projected to rocket to $11.7 billion by 2030. This explosive growth is fueled by the wider adoption of TA and automated trading systems designed to manage risk. As crypto wealth continues to create thousands of new millionaires, these analytical strategies become absolutely vital.
Your first strategy doesn’t need to be complicated. The most important thing is that it’s crystal clear, logical, and something you can follow without hesitation. Start with a simple framework like the one above, test it out, and tweak it as you get more screen time. This disciplined process is the foundation for long-term success.
Common Questions About Crypto TA
Jumping into crypto technical analysis can feel like learning a whole new language. As you start getting your feet wet, a few questions always seem to pop up. This section is all about tackling those common queries head-on.
Think of it as your go-to guide for clearing up any confusion. We'll break down the key differences between charting crypto versus stocks, point out the classic rookie mistakes, and dig into whether TA is really all you need.
How Does Crypto TA Differ from Stock Market TA
While many of the core principles of technical analysis apply everywhere, the crypto market just hits different. The single biggest game-changer is that crypto markets never sleep—they run 24/7/365. This relentless pace means trends can form, peak, and reverse far more quickly than in the stock market, which sticks to a strict 9-to-5 schedule.
On top of that, the crypto world is notoriously volatile. Price swings that would make headlines in the stock market are often just a regular Tuesday for Bitcoin or Ethereum. This high-octane environment makes risk management tools and momentum indicators like the RSI absolutely critical for survival.
The constant, global nature of the crypto market means information gets priced in at lightning speed. Unlike traditional markets, there are no "off-hours" for news to settle, making real-time chart analysis an indispensable skill for navigating its choppy waters.
What Are the Biggest Mistakes Beginners Make
It’s easy to fall into a few predictable traps when you're just starting out. Spotting them early is the first step toward building a trading approach that can actually last.
- Indicator Overload: It’s so tempting to plaster your chart with a dozen different indicators, hoping one will give you the perfect signal. In reality, this just leads to confusion and "analysis paralysis." You’re better off mastering two or three tools that work well together.
- Ignoring Risk Management: So many newcomers get tunnel vision, focusing only on how much they could win without ever setting a stop-loss. This is the fastest way to blow up an account. Always know your exit point before you even think about entering a trade.
- Chasing "Pumps": Letting hype or the fear of missing out (FOMO) drive your decisions is a recipe for disaster. Stick to the strategy you developed, not the noise you see on social media.
For more guidance on navigating the basics, you might find answers to other common inquiries in our comprehensive vTrader FAQ section.
Can You Succeed with Technical Analysis Alone
Now this is a hotly debated topic. While you’ll find some purists who live and die by TA, most successful traders find their edge by blending it with a bit of fundamental analysis (FA). TA is great for telling you when to buy or sell, but FA helps you figure out what is worth buying in the first place.
For example, you might use fundamentals to find a project with killer tech and a solid team. From there, you can use crypto currency technical analysis to pinpoint the perfect entry based on chart patterns and indicator signals. This one-two punch gives you a much more complete picture of what's happening.
This combined approach is catching on. The Global State of Crypto Report mentioned that growing crypto ownership in the US, UK, and Singapore is partly thanks to the tools TA offers, which help investors make sense of the market’s wild swings. You can learn more about the findings of the crypto report.
Ready to put your knowledge into practice? vTrader offers zero-fee trading on Bitcoin, Ethereum, and over 30 other cryptocurrencies. With advanced charting tools, real-time data, and an integrated learning academy, it's the perfect platform to build and test your trading strategies. Sign up today and get a $10 bonus to start your journey at https://www.vtrader.io.

Steve Gregory is a lawyer in the United States who specializes in licensing for cryptocurrency companies and products. Steve began his career as an attorney in 2015 but made the switch to working in cryptocurrency full time shortly after joining the original team at Gemini Trust Company, an early cryptocurrency exchange based in New York City. Steve then joined CEX.io and was able to launch their regulated US-based cryptocurrency. Steve then went on to become the CEO at currency.com when he ran for four years and was able to lead currency.com to being fully acquired in 2025.