Why Crypto Candlestick Patterns Are Your Secret Weapon
Imagine the market whispering its secrets to you. That's the power of crypto candlestick patterns. These visual cues translate the often chaotic back-and-forth between buyers and sellers into a language you can understand. We'll explore how a centuries-old Japanese rice trading technique became essential for modern crypto analysis and why these patterns work so reliably across Bitcoin, Ethereum, and all altcoins.
Unveiling the Power of Visual Storytelling
Candlestick patterns transform raw price data into a compelling story. Each candlestick represents a specific timeframe (like an hour or a day) and captures the open, high, low, and close prices within that period. A green (or sometimes white) candlestick shows a price increase, while a red (or sometimes black) candlestick indicates a decrease. This simple color-coding lets traders quickly see the price direction.
A long green candlestick, for example, suggests strong buying pressure. A long red one points to dominant selling. But the real magic happens when you combine multiple candlesticks into recognizable patterns. These patterns, such as the Hammer, the Engulfing, or the Doji, reveal shifts in momentum, potential reversals, and periods of consolidation. They offer a glimpse into the psychology driving price action.
Bridging the Gap Between Past and Present
The effectiveness of candlestick patterns in cryptocurrency markets has been thoroughly tested using historical data. Studies have shown that certain methods can identify key candlestick patterns with remarkable accuracy by carefully analyzing market trends and movements. In Bitcoin, for instance, patterns like the Harami Bullish and Bullish Engulfing appear often and can signal potential reversals or continuations. Discover more insights
This historical validation, combined with the predictable nature of human behavior, explains why these patterns remain relevant in the fast-paced crypto world. Traders react to certain price formations today much like they did centuries ago. Fear, greed, and indecision are timeless emotions mirrored in the patterns on our charts.
Unlocking Predictive Potential
Savvy traders use crypto candlestick patterns not just to understand past price action, but to anticipate future moves. Recognizing these formations can help you identify good entry and exit points, manage risk, and ride emerging trends. Interested in starting your crypto trading journey? Check out our guide on: how to start trading cryptocurrency. For more general trading, analysis, and market pattern information, the Timeskip Blog might be helpful.
Learning to read these patterns is like learning the market's language. It allows you to see past the noise and grasp the underlying forces driving price. It's a valuable skill that can significantly improve your trading and unlock the predictive power hidden within the charts.
Decoding The DNA Of Every Candlestick
Every candlestick on a crypto chart tells a story – a snapshot of market activity over a specific timeframe. Think of them like miniature market reports, each packing four key pieces of information: the opening price, the closing price, the high price, and the low price. These four data points form the building blocks of every candlestick, offering a glimpse into the ongoing battle between buyers and sellers.
The Body: The Main Story
The thick part of the candlestick, known as the body, visually represents the difference between the opening and closing prices. A green body signals a win for the bulls – the closing price was higher than the opening price. Conversely, a red body means the bears were in charge, pushing the closing price below the opening price.
The size of the body also matters. A long body, green or red, suggests strong conviction in the market's direction. A short body, on the other hand, often indicates indecision or a period of consolidation, where neither buyers nor sellers have a clear advantage.
The Wicks: Behind-The-Scenes Drama
Extending from the body, you'll find thin lines called wicks, sometimes referred to as shadows. These wicks reveal the price extremes reached during the trading period, adding another layer of insight to the story.
A long upper wick suggests an initial push higher by buyers, followed by a retreat as sellers took control. This can hint at potential resistance above. A long lower wick paints the opposite picture: sellers initially drove the price down, but buyers stepped in and pushed it back up, potentially indicating support below. Short wicks mean the price action mostly stayed within the range of the body.
Putting It All Together: Context Is Key
Visualize a candlestick with a small body and long wicks – this suggests indecision, a tug-of-war between buyers and sellers. Now picture a large body with tiny wicks. This indicates a decisive move, a clear winner in the market battle.
Understanding candlestick patterns isn't just about identifying individual candles; it's about understanding their place within the larger market context. Where does the candlestick appear within the overall trend? What was the trading volume during that period?
To help you dissect these important market clues, here’s a handy table:
Essential Candlestick Components and Their Market Meanings
A comprehensive breakdown of candlestick elements and what each component reveals about market sentiment
| Component | Market Signal | Bullish Indication | Bearish Indication |
|---|---|---|---|
| Body (Green) | Closing price > Opening Price | Price moved upwards | N/A |
| Body (Red) | Closing price < Opening Price | N/A | Price moved downwards |
| Long Body | Strong conviction | Strong upward movement | Strong downward movement |
| Short Body | Indecision/Consolidation | Small upward movement | Small downward movement |
| Long Upper Wick | Buyers initially pushed higher, but sellers took over | Rejection of higher prices | Potential resistance |
| Long Lower Wick | Sellers initially pushed lower, but buyers took over | Potential support | Rejection of lower prices |
| Short Wicks | Price stayed mostly within the body's range | Confirms price movement indicated by the body | Confirms price movement indicated by the body |
This table summarizes the key information each component of a candlestick provides. Notice how the relationship between the body and the wicks can paint very different pictures of market sentiment.
These questions, along with the information contained within the candlestick itself, help you interpret its message and make informed trading decisions. Combining candlestick analysis with tools like those offered by vTrader can provide a deeper understanding of market dynamics and potentially uncover profitable opportunities. You might also be interested in crypto technical analysis for beginners.
Spotting Trend Reversals Before Everyone Else
Imagine trying to predict the mood shift at a party. That's kind of like recognizing reversal patterns in crypto. These patterns, formed by clusters of candlesticks, hint at a coming change in the market's direction, from bullish (prices going up) to bearish (prices going down), or the other way around. This can help you get out of losing trades before things get worse, or jump into new ones just as a new trend begins.
The Hammer and Its Inverted Twin
The Hammer, found at the bottom of a downtrend, looks just like its name. A short body up top with a long wick underneath shows sellers pushing prices down at first, only to have buyers wrestle control and push them back up. This can mean selling pressure is weakening and a bullish reversal might be on the horizon. The Inverted Hammer, though visually flipped, tells a similar story. The long wick above shows buyers testing higher prices before hitting resistance, hinting at a possible shift to bullish sentiment.
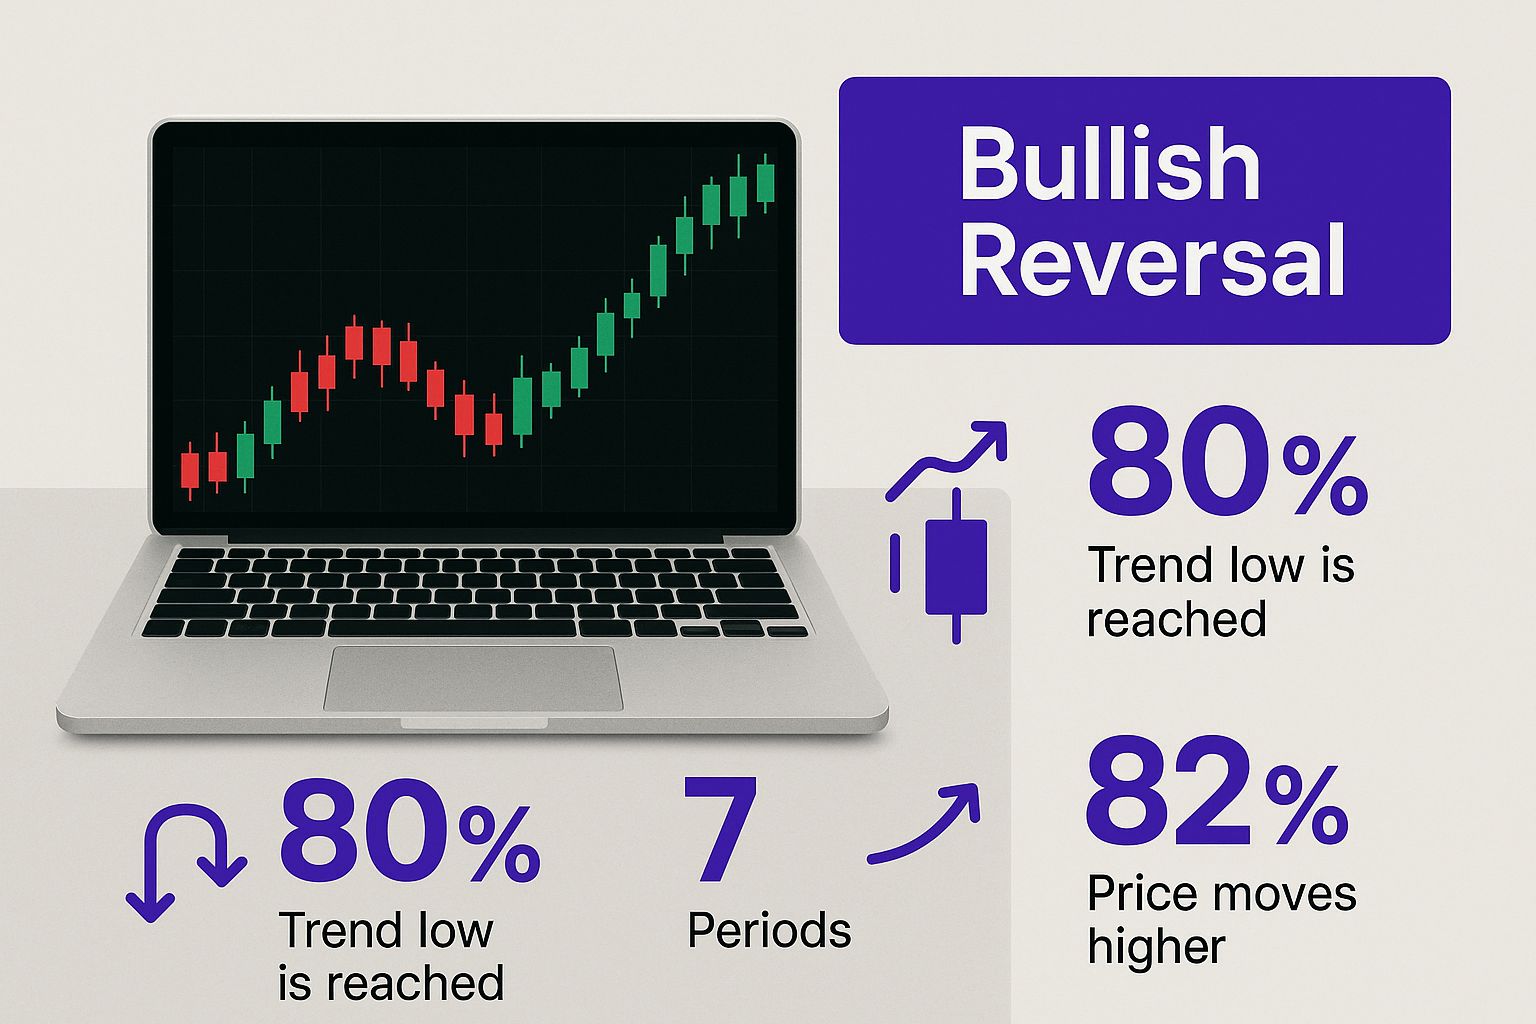
The infographic above shows a bullish reversal setup on a laptop screen. The "Bullish Reversal" label highlights the potential for price increases. Visualizations like these can help traders quickly grasp what a reversal pattern means for market direction.
Shooting Stars and Hanging Men
On the flip side, at the peak of an uptrend, the Shooting Star sends a warning signal. A small body with a long upper wick means buyers pushed prices up initially, but then met strong selling pressure, forcing a retreat. This can indicate a bearish reversal is coming. The Hanging Man, with a similar shape, reinforces this message in an uptrend.
Unveiling Exhaustion: Engulfing Patterns
Engulfing patterns signal market exhaustion. A Bullish Engulfing pattern, found at the bottom of a downtrend, happens when a large green candlestick totally covers the previous red one. This powerful image shows strong buying pressure overwhelming previous selling, pointing to a bullish reversal. Conversely, the Bearish Engulfing pattern, at the top of an uptrend, shows a large red candlestick engulfing the previous green one, signaling strong selling and a possible bearish reversal.
Psychology Behind Reversals
These patterns reflect market psychology – the tug-of-war between buyers and sellers. Reversal patterns signal one side weakening and the other gaining the upper hand. This shift often leads to a change in trend direction. Understanding this adds depth to how you interpret these patterns. Some reliable patterns include the Inverse Head and Shoulders, Head and Shoulders, and Double Bottom, with success rates of 84%, 82%, and 82%, respectively. These are key for spotting market turning points. Discover more insights. You might also want to check out vTrader's own article about crypto candlestick patterns.
Patience and Confirmation: Avoiding Costly Mistakes
Spotting a potential reversal is just the first step. Confirmation is key. Don't rush into a trade. Wait for the market to confirm the reversal signal through subsequent price action. This takes patience and discipline. Tools like those offered by vTrader can help you identify and confirm these critical patterns, leading to better trading decisions.
Let's look at some historical data on reversal pattern success rates to better understand their reliability.
High-Probability Reversal Patterns Success Rates: Statistical analysis of the most reliable candlestick reversal patterns in cryptocurrency trading
| Pattern Name | Success Rate | Time Frame | Confirmation Required |
|---|---|---|---|
| Inverse Head and Shoulders | 84% | Varies (Days/Weeks) | Breakout above neckline |
| Head and Shoulders | 82% | Varies (Days/Weeks) | Breakdown below neckline |
| Double Bottom | 82% | Varies (Days/Weeks) | Breakout above neckline |
| Bullish Engulfing | 70% | Varies (Days) | Higher close following pattern |
| Bearish Engulfing | 65% | Varies (Days) | Lower close following pattern |
This table shows that while these patterns offer a statistical edge, they aren't foolproof. Confirmation, as mentioned earlier, remains crucial. Always consider other factors and manage your risk appropriately.
Riding The Momentum Wave With Continuation Patterns
Sometimes, the crypto market pauses before continuing its upward or downward movement. These pauses, shown by continuation patterns, give smart traders chances to join strong trends at better prices. Think of them as pit stops during a race. You can refuel and get back in the action. We'll explore how patterns like Flags, Pennants, and Triangles can help you during these market pauses.
Understanding Healthy Consolidation Vs. Trend Weakness
Using continuation patterns well means knowing the difference between healthy consolidation and a weakening trend. Consolidation is when the market takes a break. It lets recent price changes settle before the trend continues. It's like taking a deep breath before the next sprint. A weakening trend, however, might mean a reversal. Knowing this difference is key to deciding whether to trade based on a continuation pattern.
Flags and Pennants: Pauses in the Action
Flags and Pennants are short-term continuation patterns that look like their names. A Flag looks like a flag on a pole. The "pole" is the sharp price movement, and the "flag" is the period of consolidation. A Pennant is similar, but it's triangular. These patterns usually show up after a big price surge or drop and often signal that the initial move will continue. They're like short breaks in a powerful trend.
Triangles: Gathering Momentum for the Breakout
Triangles form when converging trendlines make a triangle. These patterns show a period of compression, where the market seems unsure. But this indecision often comes before a powerful breakout in the prior trend's direction. Imagine a compressed spring – the tighter it gets, the stronger the release. Triangles can be symmetrical, ascending, or descending, each giving slightly different clues about the breakout.
Timing Your Entries and Exits: Maximizing Position Size and Minimizing Risk
Continuation patterns offer strategic entry points with a clear risk level. You usually enter at the breakout from the pattern. Your stop-loss goes just below the lower trendline (for bullish patterns) or above the upper trendline (for bearish patterns). This lets traders maximize position size while minimizing potential losses. It's like figuring out the right amount of fuel for a race car – enough to finish, but not so much that it slows you down.
Why Continuation Patterns Thrive in Crypto
Crypto markets, known for their volatility and long trends, are perfect for continuation patterns. Unlike traditional markets, where trends might reverse faster, crypto trends can last longer. This gives continuation patterns more time to develop and play out. They become valuable tools for finding high-probability trading setups in the dynamic crypto world. Think of it like driving a long, winding road. Continuation patterns are like signs, confirming you're still going the right way. Combined with tools like vTrader's advanced charting features, they're a powerful tool for crypto trading.
Multi-Timeframe Pattern Analysis That Actually Works
Imagine you're a detective piecing together a complex case. You wouldn't rely on just one clue, right? Crypto candlestick pattern analysis is similar. Focusing on a single timeframe can be misleading. Real insight comes from confluence – seeing patterns align across different timeframes, like multiple witnesses confirming the same story.
Zooming In and Out: The Big Picture and Precise Entries
Think of it like using Google Maps. You zoom out to see the city and plan your route (longer timeframe). Then, you zoom in to find the exact address (shorter timeframe). In trading, longer timeframes (daily or weekly charts) reveal overall market direction. Shorter timeframes (hourly or 4-hour charts) fine-tune entry and exit points.
For example, a bullish engulfing pattern on the daily Bitcoin chart might suggest an uptrend. But jumping in immediately could be risky. Zooming into the 4-hour chart might reveal a better entry – perhaps a bullish pin bar or a breakout from a continuation pattern, improving your risk-to-reward ratio.
This TradingView screenshot shows Bitcoin across different timeframes. See how higher timeframe patterns give context to lower timeframe movements? Zooming out shows the trend. Zooming in pinpoints entries and exits based on shorter-term patterns.
The Power of Higher Timeframes: Bigger Moves, Sustained Trends
Higher timeframe patterns are generally more reliable. They represent broader market agreement. A weekly bullish pattern shows sustained buying pressure, potentially leading to bigger, longer price moves.
A 5-minute bullish pattern might be a quick burst of buying that fades fast. Many traders prioritize higher timeframes for their overall bias, using shorter timeframes for timing entries and exits.
Avoiding Conflicting Signals: The Trap of Mixed Messages
A common mistake is getting caught by conflicting signals. You might see a daily bullish pattern but an hourly bearish one. This can cause confusion. Prioritize the higher timeframe. If the daily chart is bullish, be careful shorting based on an hourly bearish pattern. It could be a temporary pullback within the uptrend.
Practical Application: Building Confluence With vTrader
vTrader lets you switch between timeframes seamlessly, which is vital for multi-timeframe analysis. Use its charting tools to analyze patterns on different horizons, looking for confluence. This improves your market understanding, letting you trade with more confidence and potentially boosting profitability. Combining this with vTrader's other tools provides a comprehensive view for making smart decisions.
Avoiding The Expensive Mistakes Most Traders Make
Even when you spot a picture-perfect crypto candlestick pattern, things can still go south. Why? Because trading psychology can be a real minefield. It doesn't matter if you're brand new or a seasoned pro, these traps can catch anyone. Let's talk about some common pitfalls and how to steer clear of them.
The Danger of Pattern Hunting
Imagine you're frantically searching for your keys in a messy room. You might start seeing key-shaped objects everywhere, simply because you're expecting to see them. This is a lot like pattern hunting in trading. Traders sometimes try to force crypto candlestick patterns onto charts where they don't actually exist, fueled by the hope of a quick profit.
This often leads to entering trades based on hope rather than solid analysis. The result? Painful losses.
Trading in Isolation: A Broken Compass
Imagine trying to navigate with a broken compass. That's what it's like to trade crypto candlestick patterns in isolation, without looking at the bigger picture. Volume, market context, and the overall trend direction are all vital pieces of information you need to consider.
For instance, a bullish hammer pattern might look promising. But if it appears on low volume and during a downtrend, it's probably a false signal. Learn to combine patterns with other indicators for a more reliable trading approach. Our guide on common mistakes crypto beginners make offers even more helpful advice.
Mastering Discipline: The Art of Saying 'No'
Successful traders understand the power of discipline. They know trading isn't about chasing every single opportunity. It's about patiently waiting for the setups with the highest probability of success.
This means having the discipline to say "no" to borderline patterns, even if they seem attractive. It means recognizing when your emotions are clouding your judgment.
Emotional Traps: FOMO and Revenge Trading
Two powerful emotions that can sabotage even the best trading strategies are FOMO (Fear Of Missing Out) and revenge trading. FOMO can pressure you into trades before you have confirmation, chasing rising prices because you're afraid of missing the boat.
Revenge trading, on the other hand, is the knee-jerk reaction to a loss. It often leads to bigger, riskier trades in an attempt to quickly recover what you lost. Both are dangerous and should be avoided at all costs.
Building a Mental Framework for Success
A solid mental framework is just as important as mastering technical analysis. This means:
- Knowing your emotional triggers: Understanding what leads you to make impulsive trading decisions.
- Creating a trading plan: A clear plan defines your entry and exit strategies, how much risk you're comfortable with, and your profit goals.
- Practicing patience: Waiting for confirmations and resisting the urge to jump the gun.
- Accepting losses: Understanding that losses are part of the game and focusing on long-term profits.
By working on these elements and incorporating them into your trading strategy, you'll dramatically improve your decision-making and avoid costly mistakes that can trap even experienced traders. This disciplined approach will set you on the road to consistent profits in the ever-changing crypto market.
Building Your Personal Pattern Trading System
So, you've learned to spot crypto candlestick patterns. Great! But what's next? Recognizing these patterns is like knowing the alphabet – essential, but not enough on its own. To really communicate, you need to form words and sentences. In trading, you need a system to turn your pattern knowledge into actual trades.
Creating a Framework for Success
Let's build a step-by-step framework. Think of it as your trading blueprint:
- Market Scanning: Don't try to watch every cryptocurrency at once. That's like trying to drink from a firehose! Focus on a manageable number. Use dynamic watchlists that change based on market conditions.
- Pattern Identification: With your watchlist set, actively look for those familiar candlestick patterns. Remember, context matters. Don't just trade patterns in isolation. Look at the bigger picture.
- Confirmation: Patience is a virtue, especially in trading. Wait for confirmation before jumping into a trade. This could be waiting for a breakout from a continuation pattern or a strong close after a reversal.
- Risk Management: Plan your entry and exit points before you trade. Intelligent alerts can notify you when these levels are hit, taking emotion out of the equation. An options Greeks calculator can offer a deeper understanding of price influencers and risk.
- Position Sizing: How much you risk on each trade should depend on how reliable the pattern is and your personal risk tolerance. Never risk everything on a single trade, no matter how tempting it looks.
Integrating Candlesticks With Other Tools
Candlestick analysis is powerful on its own, but it becomes even stronger when combined with other indicators. It’s like adding spices to a dish to bring out the flavor:
- Volume: High volume confirms strong conviction, like a crowd cheering for a winning team. Low volume? That could signal a weak signal or a false breakout.
- Momentum Indicators: Tools like the Relative Strength Index (RSI) and MACD can help identify overbought and oversold conditions, providing another layer of confirmation.
- Market Structure: Understanding support and resistance levels, trendlines, and Fibonacci retracements gives essential context to your pattern analysis.
This multi-faceted approach paints a fuller picture of market dynamics and empowers you to make smarter decisions.
Developing Your Personal Trading Rules
Every trader is different. Develop a set of rules that fits your personality, risk tolerance, and trading style:
- Which patterns resonate with you? Some traders prefer reversal patterns, others lean towards continuation patterns. Find what clicks.
- What timeframes suit your style? Day traders might focus on shorter timeframes like 5-minute or 15-minute charts, while swing traders might prefer daily or weekly charts.
- What’s your risk-reward ratio? How much profit are you aiming for compared to the amount you're willing to risk?
This screenshot from Coinigy shows how different technical indicators can be added to a candlestick chart. Combining volume, moving averages, and the RSI gives more context to candlestick patterns, helping traders see the potential strength of trends and reversals. Integrating these tools empowers more informed decisions about entry and exit points.
Adapting to Changing Markets
Crypto markets are dynamic. What works today might not work tomorrow. Be adaptable and willing to adjust your system as market conditions shift. This could mean tweaking your watchlist, your rules, or the indicators you use. Our guide on how to day trade Bitcoin offers more specific strategies.
Building a profitable trading system is an ongoing journey of learning, adapting, and refining. It takes discipline, patience, and a willingness to learn from mistakes. By following this framework and constantly evolving your approach, you can turn your pattern recognition skills into consistent profits.
Ready to take the next step? vTrader offers a complete platform with advanced charting tools, real-time market data, and a smooth trading experience. Start trading today and see the power of a systematic approach. Explore vTrader Now!

Steve Gregory is a lawyer in the United States who specializes in licensing for cryptocurrency companies and products. Steve began his career as an attorney in 2015 but made the switch to working in cryptocurrency full time shortly after joining the original team at Gemini Trust Company, an early cryptocurrency exchange based in New York City. Steve then joined CEX.io and was able to launch their regulated US-based cryptocurrency. Steve then went on to become the CEO at currency.com when he ran for four years and was able to lead currency.com to being fully acquired in 2025.