

Bitcoin Price Forecast For January 2026 New Year & Post-Halving Analysis
Table of Contents
January 2026 is turning out to be an important month for Bitcoin. We are kicking off the year with a mix of optimism and caution. We’re now 21 months past the April 2024 halving. For those that don’t know, that’s when the reward for mining new Bitcoin blocks gets cut in half, reducing the supply of new coins entering the market. Historically, these events have sparked major bull runs in the past.
Coming out of a volatile 2025 where Bitcoin hit all-time highs of $126,000 but ended the year with a decline, the crypto benchmark is now trading around $93,000 as of early January. This is reflective of my previous bullish analysis for 2026.
Institutional players, the smart money pumping capital into Bitcoin ETFs, are showing fresh enthusiasm after the pullback we saw in late 2025. Right out of the gate in January 2026, net inflows have already topped $695 million in the first two trading days of January. That influx could keep the upward momentum rolling, though big picture issues like the Fed’s policy tweaks and lingering global economic jitters still leave room for uncertainty.
Today, we’ll break down expert forecasts, dive into technical signals, review historical patterns, and give you some strategies to help you navigate January and beyond. Whether you’re a die-hard HODLer positioning for the long haul or a day trader hunting for quick edges, I’m here to lay out real, actionable advice and levels. Just practical insights and proven strategies you can use in your trading today.
This will be data backed analysis to help you make smarter trades. We compared data among top analysts which points to a potential price gain of 5-18% from current levels! Keep in mind, with Bitcoin’s volatility, nothing’s guaranteed. For a broader overview, check out our Bitcoin Price Forecast for 2026: Consolidated Expert’s Forecast.
What is the Forecast for Bitcoin’s price for January 2026?
Bitcoin’s price forecast for January is in the range of $95,000 to $110,000, with expert consensus grouped at $100,000. This forecast includes factors like ongoing post-halving dynamics, newly growing institutional ETF buying, and historical January gains averaging in the ballpark of 8.5%.
January Price Forecast Summary
| Forecast | Price Range | Probability | Key Factors |
| Bullish (Most Optimistic) | $105,000–$110,000 | 25% | Strong ETF flows, buying momentum increases |
| Base Case (Most Likely) | $98,000–$105,000 | 55% | Moderate recovery, January seasonality |
| Conservative (Cautious) | $95,000–$98,000 | 20% | Profit-taking, global macro risks |
Fig. 1 – Bitcoin Price Forecast For January Including Key Factors
Diving straight into the numbers, almost all forecasts lean bullish for the month. Around 75% of all forecasts see a push to $105,000. That is not a price target as much as it is a directional indication.
The majority of experts agree on a moderate price increase to $98,000-$105,000, balancing technical corrections with potential seasonal rebounds. Only 15% are conservative, forecasting $95,000-$98,000 if macro headwinds like rising bond yields kick in.
But what are the main influences for the price gains? Institutional ETF flows flipped positive in early January after $4.57 billion in outflows in late 2025. That’s a solid tell, smart money’s clearly scooping up the dips here.
On top of that, we’re right in that halving sweet spot where supply gets choked and demand just keeps building. Throw in potential Fed cuts loosening things up and whatever pro-crypto moves come out of the Trump administration, and you’ve got real tailwinds for adoption growing globally.
Statistically, we’re seeing about a 55% chance we settle in that juicy $98k-$105k zone by month’s end. If you’re an active trader, keep an eye on a clean break above $95k, that’s your green light to jump in. Long-term folks, you can DCA steadily around the $90k support, it’s an easy way to build your position without worrying about the noise.
Historical Bitcoin Performance in January
January has been mostly bullish for Bitcoin. Historically, the month would bring in an average return of +8.5% over the past nine years. In post-halving years like 2017 (+30%) and in 2021 (+14%), it’s even stronger, averaging +12%.
But why? In markets, there’s something called the “January effect,” fresh capital from year-end bonuses and portfolio rebalancing flows in, which tends to benefit the prices of risk-on assets like stocks, commodities and cryptocurrency. But it’s not always a cut and paste seasonality. In 2018 we saw a -26% drop amid a bear market, and in 2022 the price dipped -17% on Fed rate hikes.
Seasonal Patterns
Historically, early January also brings in volatility from tax-loss harvesting which causes short term reversals. Tax-loss harvesting is where investors sell losers in December for tax benefits, then rebuy their positions again in January.
Also, post-halving Januaries shine because supply tightens while the demand builds. For 2026, considering the optimistic environment for crypto, historical patterns point towards a rally if we hold above $90,000.
2025 Performance Comparison
The January of 2025 gained about +9.5% on the back of the ETF hype. If sentiment stays positive this year, expect a similar upside. A quick tip you can use to see if the bullish trend is holding up is by tracking volume. Spikes above daily turnover of $40 billion mean real momentum for buys.
Expert Forecasts for January
Experts are optimistic, but remain grounded for the most part. Tom Lee from Fundstrat predicts $150,000-$200,000 by month-end, citing Fed cuts and institutional inflows. Binance’s CZ forecasts $120,000-$150,000, emphasizing increased adoption. More conservatively, Steve Taylor from Changelly forecasts around $96,000 by mid-month.
Bullish Forecast
Analysts from K33 Research posted $105,000 in their yearly review. Their forecast is based on a rebound from 2025’s dip and potential Q2 rate cuts. “Another possibility is $110,000” they say, if the ETFs inflows remain strong.
Moderate Forecasts
Most other analytical firms fall into this range between $95,000-$105,000. It basically means we are holding support levels. This view is balanced while factoring in seasonality.
Conservative Forecast
Some analysts at Seeking Alpha warn that we might be glued to $90,000 floors if bond yields rise.
The main insight to be gathered from all of this is that in order to stay ahead you need to diversify. Try pairing your Bitcoin with stablecoins by selling some of your BTC into a stablecoin (like USDT and USDC) when the price reverses, this way you lock in your profits and protect them from further drops without leaving the market entirely.
This keeps your gains safe while staying ready to quickly swap back into Bitcoin at lower prices, letting you buy more when the dip ends and allowing you to potentially compound your position.
Post-Halving Cycle Analysis
Bitcoin halvings reduce miner rewards, creating supply shocks that historically boost prices 21 months later. The April 2024 halving positions January 2026 in the later stage of the acceleration phase.
Post-Halving Historical Performance
Although historical data often highlights strong performance in the early months following a Bitcoin halving, by 21 months post halving we are firmly in the mid-late cycle phase where momentum typically builds further.
Looking at past cycles, similar periods delivered solid gains. The 2016 cycle saw around 18 percent returns in comparable months, while the 2020 cycle posted an even stronger 25%.
January Halving Cycle Position
In January 2026, we should expect the later stages of price acceleration as the ongoing supply tightens from reduced miner rewards and begins to compound with growing demand.
This setup draws parallels to January 2021, which delivered strong gains during a similar mid-cycle phase about eight months after the 2020 halving, highlighting how momentum often builds in these periods.
Keep an eye on Bitcoin’s hashrate, since steady rises indicate robust network health and miner commitment, this can serve as a noteworthy signal for potential buying opportunities.
Institutional Influence on Bitcoin’s Price
The big boys – banks, hedge funds, all those institutional heavyweights, are straight-up dominating Bitcoin’s price action these days. Back in 2025, the spot Bitcoin ETFs hauled in around $25-30 billion net, with BlackRock’s IBIT alone grabbing over $25 billion. That’s real Wall Street demand showing up.
Toward the end of the year, some money flowed out, about $4.57 billion, but this January has already flipped that trend with some $695 million coming back in. As funds rebalance their portfolios at the start of the year and employees get their bonuses, even more fresh money will likely pour in.
Companies like MicroStrategy are continuing to steadily buy and hold large amounts of Bitcoin on their balance sheets. Watch the weekly ETF flow numbers closely, if inflows keep growing the way they are in January, it’s usually a good sign to consider buying or adding to your position.
Technical Analysis of Bitcoin Price Targets for January 2026
The daily chart shows Bitcoin in a squeeze, with a small impulse breaking out.
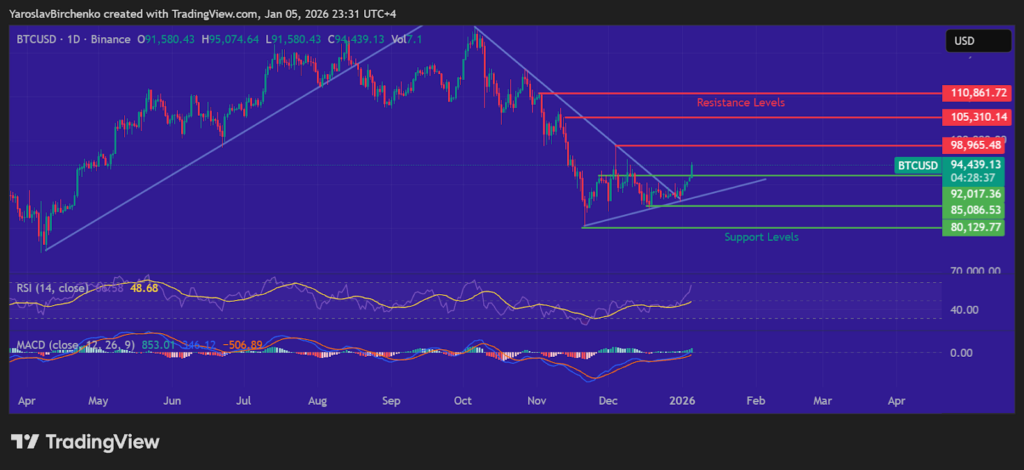
Fig. 2 – Daily Bitcoin Price Chart with MACD & RSI Indicators and S&R levels outlined
Support Levels
The primary support level which we broke above today is $90,000-$92,000. The secondary support level sits around $85,000-$88,000. Critical support, if broken, could cause a change of trend, around $80,000 (200-day MA).
Resistance Areas
The first resistance we’re eyeing is that $95k-$98k zone. BTC has to punch through there for any real moves higher. Then the big psychological wall hits at $100k-$105k, where sellers usually pile in and lock in profits. If we break and hold above that, the door opens to $110k, and that’s when bulls really take control.
Key Technical Indicators
Right now, the RSI (Relative Strength Index) is sitting in the 60-70 range, the classic bullish signal. It suggests bullish control and steady buying pressure without being overbought.
The Moving Average Convergence Divergence (MACD), is showing signs of a bullish crossover soon, signaling upcoming upward momentum. As the faster line crosses over the histogram we usually see upward action pick up or continue.
Simple Strategy for Swing Trading
When the RSI drops below 30, it often means oversold conditions are present and signals a good spot to buy any dips. When it climbs above 70, the asset may be overbought, marking a nice area to take profits or sell some of your position.
But I recommend always using indicators with other forms of analysis to increase your odds of success. Remember no single strategy or indicator will work 100% of the time.
Fundamental Factors Influencing the January 2026 Price
In addition to price charts and technical analysis, Bitcoin’s fundamentals are stacking up in big ways right now. The potential Federal Reserve interest rate cuts on the horizon make risky assets more appealing because they encourage investors to chase higher returns. Clearer crypto regulations could pull in more smart money by reducing the uncertainty with legal frameworks.
We also see a rising hashrate (the network’s computing power) pushing all-time highs to around 1 EH/s which signals rock solid health and security for the blockchain.
Market sentiment usually stays positive from the post-halving vibes and fresh institutional inflows, though you have to watch for quick flips on bad headlines.
Bitcoin also tends to move in correlation with stocks, rallying when the broader markets do (risk-on) and pulling back in times of sell-offs (risk-off).
January 2026 Risk Factors & Downside Scenarios
No one likes hearing about the bad stuff, but smart trading means considering the risks upfront. Bitcoin prices can decline quickly if things turn sour, these are the main risks to watch out for in January 2026.
Potential Downside Catalysts
Any hint of a broader recession, think spiking unemployment rate or low GDP numbers, could hammer risk assets and spark a rush out of Bitcoin. Sudden regulatory hits, like tougher SEC rules or surprise bans in key global markets, have a habit of igniting sharp sell-offs.
Profit-taking feels inevitable after the massive 2025 run-up, especially as traders pull in the profits early in the year. And don’t overlook lingering tax-loss harvesting, which can dump extra supply on the market and keep adding to downward pressure.
Bear Case Scenario for January
In a true bear scenario, Bitcoin could fall to the $70,000 to $75,000 range by the end of January. That downside plunge only carries about a 15-20% chance of happening, and it would probably take a perfect storm.
Such factors include poor macro reads piling on with nasty regulatory changes, and institutions all hitting the sell button together. We’ve got solid support layers underneath the current price, which makes a deep crash less probable, but it pays to stay ready. Keep your stop-losses in place and size positions sensibly to shield your portfolio if things do go sideways.
Trading Strategies for Bitcoin in January 2026
January’s already dishing out decent setups across the board, fueled by lingering halving momentum and that typical New Year’s lift we talked about. Whether you’re a long-term investor building for the cycle or a swing trader chasing shorter moves, here’s how to position yourself smartly and capture some upside without getting wrecked:
For long-term holders, buying the dip and holding through any noise is the way to go. With Bitcoin this far into the halving cycle, history shows years like 2016 and 2020 delivered 300% plus returns at this stage. Try to enter near support levels like $85,000 to $90,000 early in the month, then sit tight for the yearly upside. Don’t sell unless fundamentals crumble around the world, like if a major economic recession hits.
Swing traders can ride the expected $85,000 to $105,000 range. Buy dips at secondary support levels $85,000 to $88,000 or primary levels at $90,000 to $92,000. Target sells at first resistance $95,000 to $98,000 or the big $100,000 to $105,000 zone.
Week 3 (around January 15 to 21) often brings the biggest volatility for quick 5 to 10% price swings. I already shared the strategy that has worked for me in the past, to move my BTC positions into stablecoins during pullbacks, then to rebuy at a lower price.
Dollar-cost averaging works great for anyone not following the graphs too closely. With this strategy you invest fixed amounts weekly, regardless of price. This smooths out the volatility and gives you a better average entry price over time.
Risk management isn’t optional in crypto, it’s everything. Never put more than 1-2% of your portfolio on the line per trade. Set stop-losses about 5% below key supports, for current prices around $82k. And keep your overall Bitcoin allocation capped at 3-5% of the whole portfolio, no hero bets that can wipe you out completely. Day traders should focus on tight intraday ranges between $2,000 to $4,000 around key S&R levels.
Frequently Asked Questions
This FAQ is meant to answer any left over questions and give you the facts on forecasts, risks and buying timing.
What is the Bitcoin price forecast for January 2026?
January forecasts for Bitcoin are running $95k to $110k by month’s end, with most experts clustering around that $95k-$100k median. This is solid upside potential from where we’re sitting now in the low $93k area.
The base case I’m leaning toward (around 55% odds) is $95k-$102k, backed by post-halving momentum kicking in around months 20-21, fresh institutional ETF inflows, January’s historical growth, and the macro setup looking optimistic heading into 2026.
Will Bitcoin go up in January 2026?
The current setup points to good odds of upside momentum as we’re right in that phase where supply tightens and momentum builds. Traders are piling into option calls targeting $100k and up, and as long as we hold the support levels, the price action is set to go higher.
Institutional money is expected to keep coming in following year-end portfolio rebalancing, and Wall Street bonus season typically bringing in fresh capital in January.
Technical indicators suggest the mid range of our forecast is probably where we will end the month. However, profit-taking after 2025 gains and economic downturns represent significant risk. The overall probability of January being a bullish month is around 70%.
What is the lowest price Bitcoin is expected to be at in January 2026?
The lowest forecast for Bitcoin is around $75,000-$80,000 in a bear case scenario. This downside target would require multiple negative factors to come together. A combination of significant macroeconomic deterioration, regulatory crackdowns, and a major market downturn.
More realistic support levels are $82,000-$85,000 (secondary support) and $78,000-$80,000 (critical support). Historical post-halving patterns also suggest strong support above $75,000, as this would represent the 200-day moving average’s position.
Is January 2026 a good time to buy Bitcoin?
January represents a good risk-reward opportunity for buying Bitcoin, but timing really matters. If Bitcoin trades near $85,000-$88,000 in early January, this is a strong value zone relative to the predicted $95,000-$105,000 targets.
If we’re already pushing past $100k early in January, I’d rather sit on my hands and wait for a dip back to $90k-$95k. That’s where the real value entries show up.
For anyone holding long-term (12+ months), jumping in anytime this month still makes sense with the bull cycle likely rolling on through the rest of 2026. Just steer clear of heavy leverage and keep BTC at 3-5% of your overall portfolio, no need to go all-in and risk blowing up your account.
How does the Bitcoin halving affect the January price?
The supply shock is really compounding now, with miners dumping 50% less new BTC, tightening things up just as institutional demand ramps up.
History shows that 20-21 months post-halving marks the shift from accumulation to acceleration. That’s why I’m eyeing $95k-$105k as realistic here. Cycles aren’t identical though, expect heavier institutional buying but also tougher regulatory scrutiny this time around.
What are the key factors affecting Bitcoin’s price in January 2026?
We’re deep in the halving cycle where supply cuts start biting valuations harder. ETF inflows picked up from year-end rebalancing and bonus season cash hitting the markets. Macro events like Fed rate cuts, inflation trends, and dollar strength all support BTC as a risk-on play and hedge.
January seasonality is reliable. Technical levels are also outlining the range for us: resistance at $95k-$105k, solid support at $82k-$85k. Plus pro-crypto regulations and on-chain metrics like climbing hashrate and active addresses are boosting prices.
What are the most important price targets for day traders?
Day traders targeting January should focus on the following:
- Entry zones at $85,000-$88,000 and $90,000-$92,000.
- Profit-taking targets at $95,000-$98,000 (first resistance) and $103,000-$105,000 (psychological resistance).
- Stop-losses below $82,000 protect against downside.
- Week 3 of January typically sees highest volatility and breakout potential.
- Intraday ranges are around $4,000 depending on news catalysts.
- Monitor institutional capital flow data, macro announcements, and options expiry dates (typically last Friday) for when volatility is likely to hit.
The risk/reward ratio favors a bullish bias given the context, still, I recommend tight risk management for each intraday position.
How accurate are January 2026 Bitcoin price forecasts?
Monthly Bitcoin price forecasts carry moderate accuracy, historically achieving around 25% accuracy for monthly forecasts. January forecasts benefit from the clearer technical setup and established seasonal patterns, which give you higher confidence in your trades.
Factors supporting the January forecast are clear halving cycle position, historical January performance data, and visible institutional momentum carrying over from 2025.
Unpredictable macro events, Bitcoin’s own volatility, and the evolving market structure are wildcards. The forecasts should be viewed as directional guidance rather than precise price targets.
In Summary
Listen up traders, January 2026 is stacking up to be a crucial month for Bitcoin, with big institutions dipping back in like they smell blood in the water. The crowd’s betting on a close between $95k and $110k and a median around $100k, which could give you 5-18% upside. That’s better than what you’d scrape together from stocks and bonds in an entire year.
It’s backed by technical analysis screaming buy with MACD flipping bullish and RSI hanging around the 65 zone, a clear sign that whales are stacking positions quietly.
But good traders should never get too comfortable. Macros could tank it for everybody with downturns at any moment, regulations could come clamping down, and a recession might reverberate across the market, capping us at around $98k or worse, a 15% chance at plunging down to $75k-$80k.
Play your positions smartly. DCA your way in, swing trade in the $90k-$105k channel with tight stops, and flip to stablecoins on pullbacks to lock profits and rebuy at a cheaper price.
In this wild crypto landscape, you should keep your eyes glued to on-chain metrics, institutional money flows and market sentiment. Patience and attentiveness are what separate the winners from the losers, just like in the previous cycles where the steady hands rode to 10x glory while panic sellers ate losses.

Steve Gregory is a lawyer in the United States who specializes in licensing for cryptocurrency companies and products. Steve began his career as an attorney in 2015 but made the switch to working in cryptocurrency full time shortly after joining the original team at Gemini Trust Company, an early cryptocurrency exchange based in New York City. Steve then joined CEX.io and was able to launch their regulated US-based cryptocurrency. Steve then went on to become the CEO at currency.com when he ran for four years and was able to lead currency.com to being fully acquired in 2025.


