

Table of Contents
This year cryptocurrency valuations are breaking away from the 4 year cycle as governments and corporations keep adding more digital assets to their balance sheets. Price action was previously tied to Bitcoin’s halving events, that’s when the mining reward supply is cut in half (every 4 years). This event would initiate a bull market that would last about 16 months. The bullish run would peak and be followed by a bear market. In the end, this cycle would finish with an accumulation period where smart money would buy in, keep the price from going too low and the next cycle would begin.
But in 2025 we saw institutional adoption grow at a record pace, in essence changing how this cycle works. In 2026 we could potentially see longer and steadier growth that will break the traditional cycle we have become used to.
In March, the United States took a massive position in bitcoin. President Donald Trump mandated the treasury to hold bitcoin and several other cryptocurrencies as reserve assets of the government. This is all part of the U.S. Strategic Bitcoin Reserve with the other cryptos being: Solana (SOL), Cardano (ADA), Ripple (XRP), and Ethereum (ETH).
We could see another peak for Bitcoin and the crypto sphere in general on the horizon. Based on balanced views from major institutions like Standard Chartered bank and AllianceBernstein, Bitcoin is highly likely to stay within the $100,000-200,000 range in 2026. Based on a consolidation of available research we forecast the median for the year to be at $150,000.
In a bearish scenario, the worst possible scenario would be a global conflict or crash of the S&P 500. The price of bitcoin could dip lower into the $40,000-80,000 range (based on Fibonacci retracement). We have seen this behavior before during drawdowns coming off bullish highs. But as of writing this, there are no massively negative factors at play to forecast a bear scenario. What we do have, is enough statistical evidence to suggest that the base forecast model points to $100,000-170,000 by the end of 2026.
Candlestick Chart of Bitcoins 4 Year Cycle
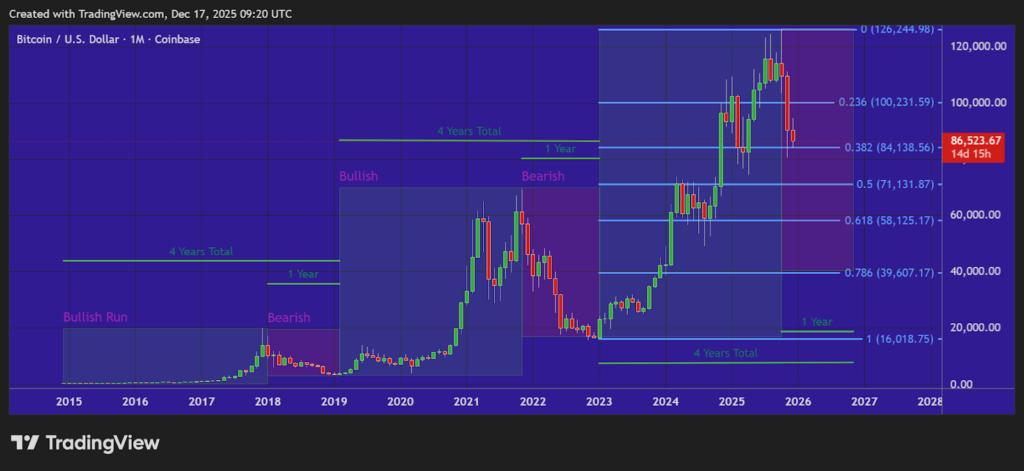
Fig. 1 – Bitcoin’s Halving 4 Year Boom Bust Cycle
There is also the bullish scenario to consider, it is highly optimistic and based on worldwide adoption of Bitcoin and massive inflows in cryptocurrency futures, funds and ETFs. In the case of global government adoption and the addition of cryptocurrencies to different Central Bank’s balance sheets, the price of Bitcoin could skyrocket to $200,000-500,000.
Let’s have a look at some figures: currently there is about $4 trillion invested in all cryptocurrency. Gold has $30 trillion invested and the U.S. stock market alone has a capitalization of $75 trillion. Cryptocurrency has a lot more room to grow judging by the global capitalization of these traditional financial instruments.
What is Bitcoin Price Prediction and How Does it Work?
Bitcoin price prediction is forecasting the possible future value of BTC based on historical data, market trends, external factors and different indicators. It helps us as traders/investors figure out the potential returns (and risks) of this financial asset.
Our analysts use various methodologies, ranging from quantitative models to qualitative assessments, and we combine multiple expert predictions for a well rounded forecast.
Technical, Fundamental and On-Chain Analysis
Here are the main forms of analysis most traders use today to gather data and find their trade entries:
- Technical Analysis (TA): Which focuses on candlestick charts, patterns, and indicators like moving averages, RSI, and Elliott Waves to predict price movements.
- Fundamental Analysis (FA): Is where we look at Bitcoin’s intrinsic value through the lens of macroeconomic factors, adoption, security, and supply.
- On-Chain Analysis: Here, we look at blockchain data like transaction volume, holder behavior, hash rate, and wallet activity to assess network health and real-time supply/demand dynamics.
The best way to trade and invest is to use a combination of these: TA for timing, FA for long-term assumptions, and on-chain for validation of your thesis.
Understanding Prediction Accuracy and Limitations
As you read this, remember that no prediction is guaranteed to come true. There are too many moving parts like Bitcoin’s high volatility, regulatory shifts and black swan events to be certain 100% of the time. Because of this, you should always view forecasts only as a probability.
Historical Performance
From 2020-2024, many analysts accurately predicted the 2020 halving bull run, with many targets set around $60,000 which were hit in 2021. However, the 2022 bear market lows (about $16,000) caught some investors off-guard.
The last halving cycle took place in April 2024 and showed mixed results. Predictions that Bitcoin would rise to $150,000 were put aside by broader economic challenges, such as high interest rates and tighter financial conditions. The approval of Bitcoin exchange-traded funds (ETFs), investment products that allowed people buy Bitcoin exposure through traditional stock markets, pushed the price above $73,000 even before the halving.
Price models based on Bitcoin’s historical cycles performed well at showing the general direction of the market but often overstated how high prices would go. One example is the stock-to-flow model (S2F), which compares the total amount of Bitcoin that already exists (the stock) to how much new Bitcoin is created each year (the flow). Because Bitcoin’s new supply keeps shrinking over time, this model assumes scarcity will drive prices much higher, but overshoots highs and lows. This is the reason why relying on more than one type of analysis is important.
Why 2026 Matters So Much
2026 stands out as an important year for Bitcoin because it sits around 20 months after the 2024 halving event. It’s an important phase in Bitcoin’s historical four-year cycle, previously price has consolidated or extended gains following the initial rally. But now, combined with ongoing strong institutional interest, bullish regulatory changes in the U.S., and shifting global economic conditions, these factors shape whether Bitcoin experiences a continued uptrend or deeper bearish correction.
Post-Halving Cycle Situation
Bitcoin’s supply is designed to become scarcer through these halving events. They occur approximately every four years or specifically every 210,000 blocks mined. The most recent halving event cut the daily new Bitcoin issuance in half. The daily BTC creation fell from about 900 BTC per day to 450 BTC per day. This built-in scarcity mechanism has historically created upward price momentum as increasing demand meets a slowing supply.
As of December 2025, we are 20 months post-halving meaning Bitcoin is in the mid-to-late stage of its current cycle. Past cycles show that major price peaks often occurred 12-18 months after a halving, followed by periods of consolidation or correction in the following year. As a quick reference:
- After the 2016 halving, the peak came around 17 months later.
- After 2020, it was about 18 months.
After the recent halving, Bitcoin reached an all-time high of $126,000 in October 2025 before correcting to around $87,000 thanks to profit-taking and persistent economic uncertainty.
Entering 2026, the reduced supply from the halving will provide foundational support, but the cycle is giving way to more stable, demand-driven growth and global adoption.
Institutional Adoption Trajectory in 2026
Institutional adoption refers to large organizations, like pension funds, hedge funds, corporations, and banks diverting significant capital to buying Bitcoin and treating it as a legitimate asset class similar to stocks, bonds, and gold.
In 2025, this trend grew dramatically with U.S. spot Bitcoin ETFs attracting billions in capital. Major players like BlackRock and Fidelity led the way, pushing ETF assets under management into the hundreds of billions. By December 2025, we noticed an outflow from ETFs as funds shifted out of the stock market and crypto due to fears of an AI bubble forming. This is a broader risk-off sentiment that spilled over into crypto as well.
Companies like MicroStrategy (now called Strategy Inc.) continued building massive Bitcoin portfolios as a hedge against inflation. Even though it’s not a full safe-haven asset, Bitcoin behaves like a traditional financial asset with regulated products, deep liquidity, and reduces extreme volatility which inherently attracts capital.
Looking to 2026, analysts expect this trajectory to continue and strengthen, with potential for further crypto expansions, corporations adding more BTC to their balance sheets, and even sovereign investments (other countries increasing their own strategic Bitcoin reserve).
Regulatory Landscape
The regulations of cryptocurrency are a set of rules and policies that governments create, they affect everything from trading, taxation and protecting you as a crypto investor.
In 2025, the U.S. made a noticeable shift towards pro-crypto policies under the Trump administration. President Trump made several executive orders promoting digital assets, establishing better rules for stablecoins (the GENIUS Act), he also eased banking access for crypto firms and allowed banks to freely add crypto to their balance sheets. This reduced previous guardrails and is encouraging widespread institutional participation.
For 2026, this evolving landscape is now more clear and supportive of investment than it has ever been, which could add trillions in potential capitalization from institutions previously hesitant due to regulatory risks.
Macroeconomic Projections
When we analyze the macroeconomic statistics we include all of the broad economic factors like interest rates, inflation, growth, and global demand. All of these factors influence crypto assets just like they do with other financial instruments.
By the end of 2025, Bitcoin faced downward pressure from interest rates and persistent inflation. U.S. fiscal policy for 2026 is likely to incorporate some easing of monetary policy. Most Wall Street economists expect the U.S. Federal Reserve interest rate to decline toward 3-3.25% (currently 3.25-3.50%) and inflation to drop closer to the 2% target. This will likely stimulate new risk appetite from investors.
Fed Funds Futures Forecast for 2026
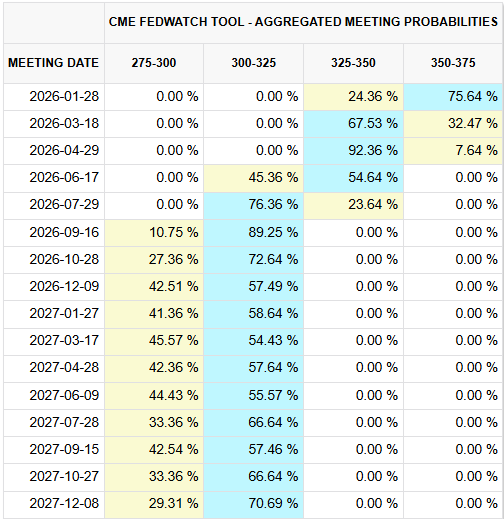
Fig. 2 – Markets Participants Forecast for July Interest Rate Decrease
This happens because lower rates make borrowing cheaper, encouraging investment in high-risk assets, and reducing the appeal of low-risk savings. However, persistent inflation from tariffs and geopolitical tensions could delay the interest rate cuts until July.
Analysis of the Expert Consensus
By the start of 2026, Bitcoin will be about 21 months past its most recent halving. Historically, this window was the turning point into bearish territory. Supply growth is already reduced, long-term holders are typically less willing to sell, and supply/demand changes have an outsized effect on price.
Considering this backdrop, we reviewed forecasts from 17 well-known analysts, fund managers, and research teams who actively publish Bitcoin price forecasts and are correct a respectable amount of the time.
Rather than focusing on the most optimistic or pessimistic voices, this section will look at where expert opinion consolidates or overlaps and which factors are having the most impact behind each forecast.
Distribution of Predictions (Median, Mean, Standard Deviation)
When we look at what different analysts say and analyze them as a data sample, the numbers look less chaotic than what social media would suggest.
The average, or mean, forecast for Bitcoin in 2026 comes in just above $125,000. This number is pulled upward slightly by a handful of very bullish calls that assume strong ETF demand and quick institutional participation.
The median forecast, the midpoint where half of predictions are higher and half are lower, sits closer to $120,000. This is often the more useful figure to long-term traders and investors because it reduces the influence of extreme outliers.
The spread of forecasts, we measured by using standard deviation, is moderate rather than extreme. These estimates fall within $25,000 of the median. In plain language, experts disagree on the exact level, but they agree on the direction – higher.
This tells us something important. The market is not debating whether Bitcoin will still be in the headlines in 2026. It is debating how much capital flows in, not whether it flows in at all.
The Base Range Explained
Out of the publicly available sources, the most common range cited by analysts is between $100,000 and $150,000. This range shows up in articles from banks, to crypto funds, and independent researchers, even though each of their analysis methods differ.
The lower end sits around $100,000 and usually assumes slower macroeconomic improvement. Think of the scenario if we have higher-for-longer interest rates, cautious pension funds, and ETF inflows that grow steadily but not explosively (like in 2025).
The upper end is around $150,000 and assumes that three things happen simultaneously. First, ETFs continue to absorb supply at a meaningful pace. Second, large asset managers raise Bitcoin allocations from symbolic levels, such as 0.1%, toward more meaningful exposure, closer to 0.5% and 1% (still small). Third, the post-halving supply reduction tightens the market enough that new demand pushes prices higher rather than being absorbed by sellers.
An important note here, very few experts call this range a ceiling. Instead, they frame it as a reasonable base case under normal conditions, not a best-case scenario.
Analyst Methodology Breakdown
Some analysts rely on cycle analysis. This is when you study past halving cycles, they measure average returns 12 to 24 months after supply cuts, and adjust them for Bitcoin’s market size today. These models tend to produce conservative but historically accurate estimates.
Other analysts you will find use flow-based models. These focus on how much new capital enters the market through ETFs, corporate treasuries, and wealth managers, and compare that demand to the reduced new supply of Bitcoin. When demand is modeled like this, as persistent rather than speculative, the price outcomes are skewed a little higher.
And the third popular method you will see on Wall Street is macro-relative valuation. They compare the correlation of Bitcoin to gold, global money supply growth, and sovereign debt trends. These analysts often argue that Bitcoin does not need mass retail hype to move higher, it only needs modest reallocation from traditional stores of value. We tend to agree.
Each method has blind spots, which is why the overlap between them matters more than any one single forecast type by itself.
Credibility Weighting
Not all predictions are created equal (or carry the same weight). In our review, forecasts were evaluated using these three criteria:
- First, their track record. Analysts who published Bitcoin forecasts in previous cycles and were directionally correct, were given more weight than those with no historical record or accuracy.
- Second, their incentive alignment. Independent researchers and fund managers with disclosed exposure were weighted more heavily than promotional or social media accounts.
- Third, clarity of the method used. When dealing with probabilities you always want calculated assumptions, balanced risks, and data-backed reasoning which matter more than confidence or bold language.
When we took 17 different forecasts and compared them this way. The resulting center of gravity remains firmly in the $110,000 to $140,000 zone, confirming the idea that expert consensus is narrower than it appears.
What This Really Tells Us as Traders
The takeaway is not that Bitcoin will hit a specific number in 2026. The takeaway is that expert opinion has centered around a higher price range than what we saw in the previous cycles. This is driven by structural demand and reduced supply.
For traders and long-term investors, this kind of overlap points to a market that is maturing (rather than peaking). Volatility will still exist, but the debate has shifted from “will it?” To “how far?”
Bear Case Scenario – About 30% Probability
The bearish scenario for Bitcoin could play out in 2026 if institutional adoption slows while global economic pressure builds. This is not likely to be a collapse, it is a possible drawdown and consolidation similar to what we saw in prior correction phases.
Roughly 6 of the analysts we reviewed fall into this territory. These analysts put more emphasis on the broader economy and money conditions rather than on long-term adoption of crypto. They believe high interest rates, reduced market liquidity, and the tendency for prices to fall back toward historical averages can overpower the steady growth of adoption, at least for a short period of time.
This kind of bearish decline could happen if Bitcoin fails to sustain its momentum beyond late 2025. If ETF inflows flatten or even reverse and risk appetite declines across equities then we could see Bitcoin start to decline significantly.
Technical analysis shows us that previously, the bearish decline would continue until 78.6% of the Fibonacci retracement of the entire growth phase. Right now we are watching for the break below the Fibonacci level at 84,700. If we break below this level and stay there, price compresses into a wide range between $40,000 and $80,000 as leveraged positions are forced to unwind and long-term holders absorb the supply.
Candlestick Chart of Bear Case Scenario
Fig. 3 – Possible Support Level Based on Past Corrections to 78.6% Fib Level
Conditions for Bear Case
The bear scenario does not rely on a single shock, but a combination of pressure points aligning at once.
- First, the macro stress. If we see a rise in inflation, leading to delayed rate cuts, or even renewed tightening, that forces capital back into cash and short-term bonds. CNBC’s analyst Tom Lee pointed out that Bitcoin struggles when real yields rise and liquidity contracts.
- Second, the institutional hesitation. If the ETF capital slows, not due to any Bitcoin issues, but because funds rotate out of risk assets generally. This will mirror the end of 2021 when Bitcoin reached its peak while liquidity was still high, then fell sharply as monetary policy tightened.
- And finally, regulatory and geopolitical disruption. While the U.S. policy towards crypto has turned supportive, global efforts remain fragile. Sudden restrictions, capital controls, and conflict-driven market stress could trigger indiscriminate selling across all risk assets, including crypto.
Historical Parallels 2018 and 2022
This year’s scenario most closely resembles the 2018 and 2022 bear markets, though likely less severe.
In 2018, Bitcoin fell over 80% after the initial coin offering (ICO) bubble burst and liquidity dried up. In 2022, Bitcoin dropped about 75% from its peak as rate hikes, overleveraging, and forced selling (stop-loss activation) cascaded throughout the entire system.
The key difference for 2026 is structure. Now we have ETFs, deeper spot liquidity, and long-term institutional holders which reduce the odds of an 80% drawdown. Analysts modeling this case generally cap downside between 60% and 70% from cycle highs, placing the lower bound near $40,000 considering the 2025 peak is above $125,000.
Quarter-by-Quarter for the Bear Scenario
If we turn bearish in 2026, price weakness unfolds gradually rather than collapsing instantly.
- Q1 could start with Bitcoin failing to reclaim prior highs and breaking key support levels. We already see Bitcoin breaking below key support levels in 2025.
- Q2 brings more and faster selloffs as confidence fades and momentum traders short.
- Q3 could be the time where selling pressure peaks and volatility spikes.
- And, by Q4, price stabilizes as weak hands are flushed out and long-term buyers re-enter, forming a base support level rather than starting a new recovery.
This slow grind is consistent with what we have seen in analyst models that incorporate declining momentum rather than sudden systemic failure.
On-Chain Indicators Signaling Bear Case
To forecast this scenario correctly, watch the on-chain data as it will play a critical role in spotting shifting dynamics.
Warning signs include long-term holders beginning to sell coins, rising exchange balances, and market value to realized value (MVRV) ratios falling below historical averages. The ratio of Bitcoins market value to its realized value indicates whether the price is overvalued or not.
If we see a declining hash rate and miner stress, when miners are not making enough profit to cover operational costs, this would further confirm structural weakness.
Investment Strategy for a Bear Market
In a bearish market the objective shifts from growth to preservation and positioning. Each sell position you take is a leveraged position, meaning you pay extra fees for each hour the position is open.
The strategy here would be to focus on range trading rather than trend following. Long-term investors will likely wait to buy from support, if they choose to open positions at all. In this scenario, cash or USDT becomes a position in itself. An expert move would be to sell BTC for USDT and stake it for about 6-12% in yearly yield. If you choose to exit out of your Bitcoin position in a bear market the yield could be lower.
Historically, periods like this have offered some of the best long-term entry opportunities, but only for those who remain patient and unemotional. The bear case could be painful, but it should not be tragic for you. It represents a correction, not a collapse of Bitcoin’s role in the global financial system.
Bull Case Scenario – 20% Probability
The bull case sees Bitcoin surging dramatically in 2026, reaching $200,000 to $400,000 or higher. This outlook assumes a perfect alignment of strong demand drivers that overwhelm any short-term corrections, creating parabolic upward momentum.
A total of 6 of the analysts we reviewed support this higher range, including people like Cathie Wood (ARK Invest), Michael Saylor, and Tom Lee (Fundstrat), who point to outsized institutional buying, potential sovereign adoption, and favorable global liquidity as the key factors of the bullish momentum.
Catalysts That Could Trigger a Bull Run
Here are several powerful factors that could push BTC higher to the upside:
- Aggressive Federal Reserve rate cuts and renewed quantitative easing. In essence, they will be flooding the markets with liquidity and boosting risk assets like Bitcoin.
- Massive ETF inflows, exceeding $100-200 billion as wealth managers and pension funds increase their allocations. This has already been forecasted by ETF providers.
- New global sovereign adoption. This means countries adding Bitcoin to their national reserves (mirroring U.S. strategic reserve decisions). This alone could create sudden supply shocks hiking prices higher.
- Corporate treasuries ramping up their holdings. With more companies following Strategy’s lead after new regulations came out.
If these would combine on top of the ongoing 2024 halving’s scarcity effects, it would turn steady growth into rapid growth.
Mass Institutional FOMO and Sovereign Adoption
FOMO (fear of missing out) among institutions happens when large players rush in to avoid being the underperforming peers, driving up price through rapid buying. We have seen this happen before.
In 2025, ETFs from BlackRock and Fidelity saw tens of billions in inflows, normalizing Bitcoin as a portfolio asset. To validate a bull scenario, be on the lookout for funds who allocate 1-5% of their trillions of dollars in managed assets.
Sovereign adoption is when governments start treating Bitcoin like digital gold. It could be the ultimate catalyst when it happens. Discussions around U.S. reserves and interest from other nations could trigger competitive buying, removing huge amounts of Bitcoin from circulation and sparking global FOMO.
Historical Bull Runs of 2017 and 2021
The two past cycles show massive profit multipliers during the bull phases:
- In 2017 Bitcoin rose about 19x from its lows to around $20,000. It was fueled by retail hype and early adoption.
- Then in 2021 we saw growth of around 10x to about $69,000, driven by institutional adoption and the ripple effects of pandemic stimulus.
Analysts from behemoths VanEck and Fidelity see potential for a similar bull run today, but amplified by the larger capital pools. With maturing markets reducing downside risks, a 3-5x move from current levels of $87,000 could push toward $300,000+ if momentum mirrors historical patterns.
Quarter-by-Quarter Parabolic Price Potential
A bull run in 2026 might unfold like this:
- In Q1 we see a breakout above $100,000 on signals of easing monetary policy and ETF surges, reaching $150,000.
- By Q2 institutional FOMO accelerates, parabolic growth pushes to $200,000 amid sovereign adoption.
- Then Q3 extends the rally on liquidity floods, and because there is not enough free Bitcoin to go around and prices continue to rise, testing $300,000.
- Finally Q4 will serve as the potential blow-off top at $400,000-$500,000 if global adoption narratives dominate financial headlines.
This scenario has a small chance to play out and assumes perfect conditions from the Fed and the global economy.
Warning Signs and Exit Strategy
Even in a bull run, watch for these clues of an overextension:
- Extreme greed in fear and greed indexes, RSI above 90 on weekly charts, or a massive buildup of leveraged positions. These factors can unwind quickly.
- Sudden ETF outflows, prohibitive regulations, and macro shocks (inflation spikes delaying cuts).
- Deviation from stock-to-flow (S2F) models or whale distribution spikes.
The S2F model predicts Bitcoin’s price based on its growing scarcity. A big deviation happens when the actual price moves far above or below this model’s prediction, often signaling the market is overheated (if too high) and a pullback could be coming.
Whale distribution spikes occur when large holders suddenly send lots of Bitcoin to exchanges to sell, flooding the market and potentially triggering a sharp price drop.
Here is a strategy you can use in a bull market: take partial profits at specific milestones ($150,000, $250,000), and put trailing stops on your remaining positions. Try to avoid full leverage as much as you can. Historically bull runs reward holders but punish late chasers. So your best bet is to secure gains while monitoring on-chain health like declining exchange reserves.
This scenario has only about 20% odds, lower than the base case due to the required “everything goes right” conditions, but offers the highest reward if institutional and macroeconomic factors fully align.
Risk Assessment and Uncertainty Factors
While the overall trend for bitcoin points to steady growth in 2026, it remains a volatile asset influenced by unpredictable events.
Key on-chain metrics provide us with some guidance. The S2F model popularized by PlanB suggests a fair value around $200,000-$400,000 or higher in bull phases due to increasing scarcity post-halving, though the current price sits below this amid 2025 corrections.
The MVRV Z-Score (which compares market value to realized value, adjusted for volatility) has historically peaked around 7-10 at cycle tops, signaling overvaluation when too high. Currently it is hovering around 1. If it drops to 0, it is considered very oversold.
The hash rate, which is the total computing power securing the network, is projected to grow 20-30% year-over-year in 2026. And if mining remains profitable, it will signal strong network health overall.
Black Swan Event Probabilities
Black swans are rare, unforeseen, high-impact events like major hacks, global conflicts, and pandemics that could crash markets 50%+ overnight. Their probability is low (under 10%), but history has given us examples like the 2020 COVID crash and the 2022 FTX collapse. This is why black swan events should always be factored into your investment strategy.
Bitcoin’s decentralization helps it recover faster than traditional assets like stocks and commodities, but extreme fear could temporarily push prices towards the bear case lows mentioned earlier.
Regulatory Risks
Governments are still the ones that control the rules around trading, taxes, and cryptocurrency usage. Risks in crypto investing include sudden SEC crackdowns on exchanges, outright bans in major countries, and coordinated global restrictions (like anti-money laundering rules). The 2025 U.S. shift towards crypto friendly policies sparked one of the biggest rallies in crypto history.
But strict, restrictive, or outright prohibitive government actions could trigger similar outflows and 20-40% drops in price. On the bright side, clear regulations often boost investors’ confidence in this market overall.
Macroeconomic Risks
Bitcoin often moves with the broader economy. This means high interest rates make safe assets more appealing (while Bitcoin, gold and risky assets less appealing). A deep recession or delayed rate cuts could extend the bearish correction, pressuring prices lower.
On the other hand, interest rate easing, cutting spending and increasing taxes support the base case and the bullish scenario. Current Wall Street projections point to softening of rates in 2026, but persistent inflation and stock market crashes remain the key threats to overall market optimism.
Technical and Protocol Risks
Finally, these risks involve Bitcoin’s core technology. If a major bug is found in the code, 51% attack (highly unlikely with the current hash rate), or failed upgrades, could cause a widespread selloff.
Protocol risks are minimal due to conservative development, but on-chain warnings like sudden whale selling or hash rate drops will signal trouble. Keep an eye out for these developments.
Overall, maturing infrastructure and institutional safeguards lower these risks compared to earlier post-halving cycles. For additional information stay on top of metrics like market structure, open interest (oi), liquidation heatmaps and MVRV Z-score to improve your entry and exit timing.
Investment Allocation and Possible Strategies
If you’re looking to add Bitcoin to your portfolio it still offers a high probability reward in 2026. A well thought out approach focuses on a long-term holding period while managing downside through smart allocation, timing, and keeping a steady hand while reading different headlines. Most fund managers view Bitcoin as a portfolio supplement (not the core), so we recommend small positions for most investors.
Portfolio Allocation Recommendations
The top financial advisors often suggest allocating 3-7% of a diversified portfolio to Bitcoin, depending on your risk tolerance:
- Conservative investors should allocate 3-5%. This amount provides you with exposure without excessive volatility for your overall portfolio.
- Moderate/aggressive investors can push 5-7% which captures more upside from institutional trends. Investing along with smart money has proven to be a successful strategy in the past.
This range balances growth potential and drawdowns. If historical cycles show us 50-80% corrections are possible, you need to be careful. But not too careful as to miss the recoveries that reward patient holders. Pair your crypto investments with stable assets like stocks, bonds, and gold for overall stability.
Entry Timing Considerations
Timing matters less over long horizons, this is why it is always a good idea to invest for the long term. Here are specific recommendations when you can consider long term entries:
- If we are in the Base case scenario – Look for a buy based on technical analysis or on dips below $60,000-80,000.
- If macroeconomics favor the Bull case – Add to your position on breakouts and retracements above $120,000 with confirmed ETF inflows and softening monetary policy.
- In the Bear case – Wait for support levels to be hit (like high fear on the Fear and Greed index) before making large entries.
Avoid trying to time your entries perfectly and trading on margin. Remember, markets can stay irrational longer than expected. Focus on conviction levels and statistics rather than short-term noise and hype.
Dollar-Cost Averaging vs. Lump Sum Strategy
Investing all at once or spreading out your investment across time is an important consideration to make. Here are the key factors to consider:
- Dollar-Cost Averaging (DCA) is the best strategy for most people. It is how U.S. pensioners become rich, by buying fixed amounts of financial instruments regularly (monthly). This approach reduces emotional decisions, averages costs over sporadic volatility, and takes uncomfortable guesswork out of the picture.
- Lump Sum: This is better if you know what you’re doing and have high conviction (and cash ready). The logic here is that markets trend up long-term and if you can get in at a great price discount, do it big (historical data shows lump sum investing outperforms DCA about 68% of time).
A smart approach would be to combine both. Use DCA for your core position and lump sum trades on major dips.
Risk Management and Position Sizing
As with all investments, never risk more than you can afford to lose. Always use proper position sizing with no single trade taking up more than 1-2% of your portfolio. Here are a few more tips for efficient investing:
- Set stop-losses or mental exits for all positions.
- Rebalance monthly, meaning you check if you can sell highs to lock gains or buy from lows.
- Monitor the key risks as we discussed above. Read about new regulations and macro changes and adjust your portfolio accordingly.
Tax Optimization Considerations
This part is a bit tricky because crypto taxes vary from country to country. You should at least treat Bitcoin as property (in many places, capital gains on sales). Here are a few tricks to save money when tax season rolls around:
- If the market situation allows, try to hold for over a year for lower tax rates (where applicable).
- Use tax-advantaged accounts if available (IRAs with Bitcoin ETFs).
- Harvest losses in bear markets to offset gains. Tax-loss harvesting is a strategy where you sell securities at a loss to offset capital gains from other investments.
- Track all transactions accurately and use automated crypto tax programs – ZenLedger, CoinLedger or Blockpit.
If you trade in sufficient size, always consult with a tax professional. The reason is that rules evolve and change and you never want to be caught off guard with a tax audit.
Using Bitcoin 2026 Predictions
Bitcoin’s base case scenario looks promising at around the $100,000–$170,000 range. It will be driven by institutional adoption and the continuing halving effects, but short-term outcomes remain hard to predict due to the volatility and external risks. You should treat all forecasts as probabilities and never as guarantees.
Combining Multiple Forecasts and Methodologies
The strongest insights come from blending approaches used by different firms and banks. Use technical analysis for timing your trade entries and exits, but also monitor fundamentals for long-term drivers, and on-chain metrics for statistics about network health.
Always cross-reference experts’ opinions against each other, and confirm with your own analysis of the situation. This way you are better positioned to spot consensus ranges rather than follow the extreme opinions.
Frequently Asked Questions About Bitcoin in 2026
What is the most likely Bitcoin price in 2026?
The consensus from major analysts points to a base case range of $100,000–$170,000, reflecting the ongoing institutional adoption, ETF inflows, weighed against potential macro pressures from persistent inflation and geopolitical risk.
Will Bitcoin hit $200,000 or more in 2026?
Possible in a bull scenario (20% probability), driven by strong sovereign interest and accelerated FOMO. The major factor is that it requires multiple positive catalysts aligning together.
What could cause Bitcoin to drop below $100,000?
A bear case could unfold from prolonged high interest rates, a recession, prohibitive regulation, and major market sell-offs (S&P 500). All this could potentially sink prices to $40,000.
Are Bitcoin price predictions reliable?
No forecast is 100% guaranteed. Past cycles have shown many bold calls, overestimated rallies due to unexpected macro risks, leveraged crashes leading to selloffs, and simple sentiment shifts. Always view everything through a lens of probabilities.
Should I invest in Bitcoin now to capture gains in 2026?
Only with money you can afford to lose. Use strategies like dollar-cost averaging, small portfolio allocations, and proper risk management. Do your own research (DYOR) and consider holding for the long-term tax benefits.
How did the halving affect prices?
The 2024 halving’s reduction of supply continues supporting prices in 2026 (18-30 months post-event), historically this has been a phase of consolidation or extension after initial rallies.
Resources and Further Reading
For deeper insights:
- Fidelity’s latest Crypto Outlook report for more institutional perspectives.
- Galaxy Research / Galaxy Digital (Alex Thorn) for macro factors.
- PlanB’s Stock-to-Flow model charts for scarcity-based analysis.
- ARK Invest’s Big Ideas annual report on adoption trends.
- Follow X analyst @intocryptoverse (Benjamin Cowen) for technical views
Markets change rapidly so it’s wise to stay updated with balanced sources like these.
Final Note on Responsible Investing
Bitcoin predictions often fail because they underestimate black swan events, market participants emotional swings, and changing economic conditions. Treat all forecasts (including this guide) as educated guesses, not certainties. As you invest, always DYOR, diversify if unsure, and always focus on the fundamentals over the hype, that’s how you get the best long-term results.

Steve Gregory is a lawyer in the United States who specializes in licensing for cryptocurrency companies and products. Steve began his career as an attorney in 2015 but made the switch to working in cryptocurrency full time shortly after joining the original team at Gemini Trust Company, an early cryptocurrency exchange based in New York City. Steve then joined CEX.io and was able to launch their regulated US-based cryptocurrency. Steve then went on to become the CEO at currency.com when he ran for four years and was able to lead currency.com to being fully acquired in 2025.


