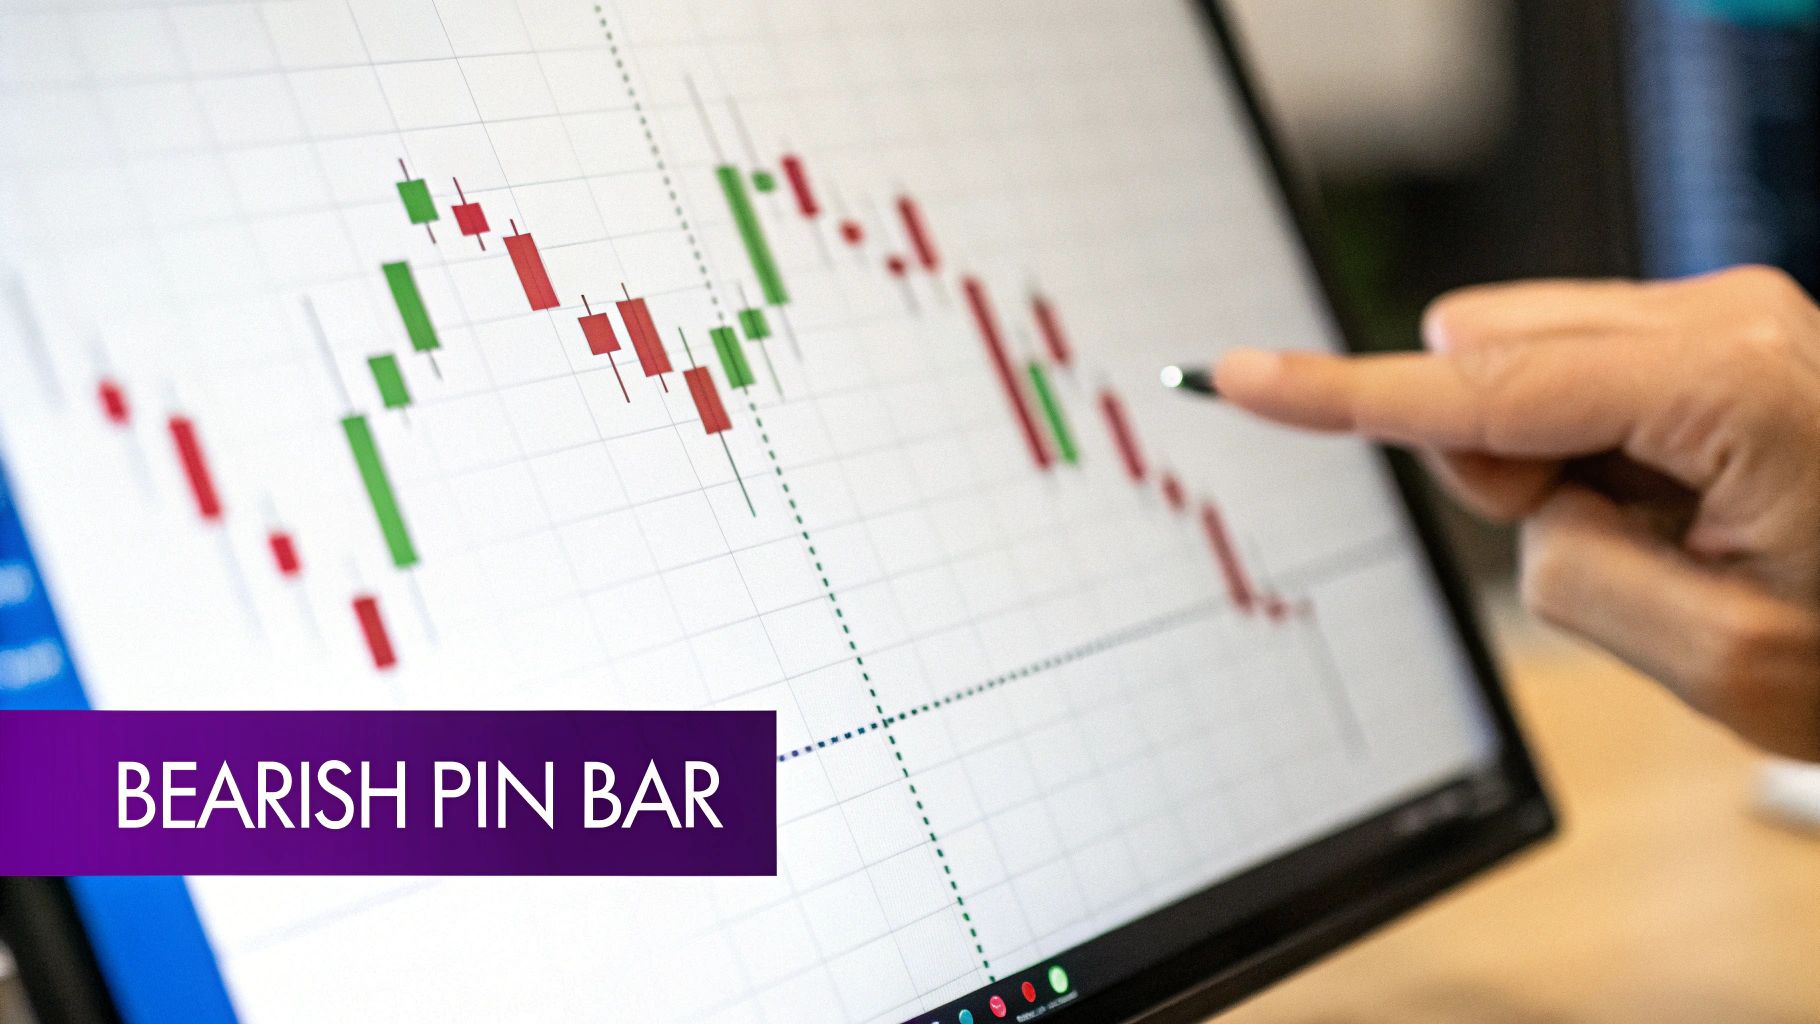
When a bullish trend starts to lose steam, the market often leaves clues. One of the most telling signals is the bearish pin bar, a single candlestick pattern that screams, "The bears are taking over."
Think of it like a tug-of-war. The bulls give one last mighty pull, sending the price soaring. But just as they think they've won, a wall of sellers pushes back with overwhelming force, sending the price tumbling back down. This is the story of strong price rejection, and the bearish pin bar is its calling card.
Decoding the Bearish Pin Bar Signal
At its heart, a bearish pin bar shows a decisive moment where selling pressure completely overwhelms buying interest. It's a key price action signal that traders look for on a candlestick chart. If you're new to this style of charting, getting a handle on the basics will make these patterns much easier to spot.
The pin bar’s distinct shape isn't just for show; it gives us a direct look into the shifting psychology of the market. To really understand what it’s telling us, we need to break it down piece by piece.
Anatomy of a Bearish Pin Bar
Here's a quick rundown of the three parts that make up a bearish pin bar and what they tell us about the market's mood.
| Component | Description | Market Implication |
|---|---|---|
| Long Upper Wick | The long, thin line extending upwards. It should be at least 2/3 of the total candle length. | Shows buyers pushed the price up aggressively but failed to hold it there. This is strong rejection from sellers. |
| Small Real Body | The small, blocky part showing the open and close prices. It's located at the bottom of the candle. | Indicates that sellers pushed the price back down to near (or below) where it opened. The bulls lost control. |
| Tiny or No Lower Wick | The lack of a shadow below the real body. | Reinforces the bearish dominance. Buyers couldn't even mount a small comeback before the session closed. |
Each element combines to tell a powerful story of a failed rally and a potential shift in momentum from bullish to bearish.
This isn’t just chart-reading folklore; it’s a recognized pattern with a solid track record. For example, some studies on major indices have shown that pin bars appearing at key technical levels can have success rates between 63% and 68%.
Essentially, the bearish pin bar is a warning flare. It’s the market’s way of saying that the party for the bulls is over, and the bears are about to crash it.
Understanding the Psychology of the Rejection
To really get a feel for the bearish pin bar, you have to look past the pattern itself and dive into the human emotions that drive the price. Think of it as the footprint of a dramatic battle where market sentiment flips from greed to fear, all within a single trading session.

Picture a strong uptrend. Everyone’s excited, and buyers are confidently pushing the price higher, mostly fueled by the fear of missing out (FOMO). As the price charges toward a key resistance level, they run straight into a wall of sell orders placed by institutional traders and other smart money.
The Bull Trap Is Set
This is where things get interesting. The big players might intentionally let the price nudge just past that resistance level. It’s a classic move designed to trip the stop-loss orders of anyone shorting the asset and, more importantly, to suck in eager breakout traders who think the rally is about to continue.
Then, the trap springs shut.
Huge sell orders flood the market, absorbing all the buying pressure and slamming the price back down. That long upper wick you see on the bearish pin bar? That’s the evidence of this fierce rejection.
This sudden reversal catches all the late, optimistic buyers who jumped in at the very top. They’re now holding losing positions, and their greed quickly morphs into pure panic.
The Shift from Greed to Fear
By the time the candle closes near its opening price—forming that tiny body—the entire psychological landscape has been reset. The buyers who were just in control are now trapped, and the sellers have decisively taken over.
What happens next is what makes the bearish pin bar such a powerful signal. To cut their losses, those trapped buyers are forced to sell. This wave of selling adds even more downward pressure, often kicking off a sharp and sustained move lower as fear takes hold. Learning to manage these emotions is a skill in itself; our guide on how to avoid FOMO and panic selling can help you navigate these moments.
At its core, a bearish pin bar isn't just a pattern on a chart; it's the story of a failed auction. It shows you the exact point where the bulls ran out of steam and the bears seized control, setting the stage for a potential reversal.
How to Spot High-Probability Pin Bar Setups
Seeing a bearish pin bar pop up on your chart is a good starting point, but it's definitely not an automatic green light to hit the sell button. The hard truth is that many pin bars fail, leading to some seriously frustrating losses. The real secret to success is learning how to separate the A+ signals from all the market noise, and that comes down to one critical thing: context.
A random bearish pin bar floating in the middle of a choppy, sideways market doesn’t mean much. Think of it like a single person trying to start a "wave" in a half-empty stadium; it’s just not going to catch on. A powerful pin bar, on the other hand, shows up exactly where a wall of sellers was already waiting to jump in.
Look for Confluence at Key Levels
The most reliable bearish pin bars happen at areas of confluence—that's just a fancy word for a spot on the chart where multiple technical reasons to sell all line up. This is where big institutions often stack their sell orders, creating a barrier that buyers just can't seem to break through.
Instead of getting trigger-happy on every pin bar you see, run each potential setup through a quick checklist. This forces you to be selective and only take the trades with the highest odds. A top-tier setup will check several of these boxes:
- Major Resistance: The pin bar forms right at a clear horizontal resistance level—a previous high point where the market has turned around before.
- Moving Average Rejection: The candle's long upper wick pokes above a key moving average (like the 50 or 200 EMA) but gets slammed back down below it.
- Trend Line Touch: In a downtrend, the price pulls back to tap a descending trend line and forms a pin bar, signaling that the downward march is ready to resume.
- Fibonacci Retracement: The pattern appears at a key Fibonacci level, especially the 61.8% retracement, which is a classic reversal spot.
The most powerful signals are born from rejection. A bearish pin bar at a confluence of resistance tells you that buyers tried to break through a critical defensive line and were decisively thrown back by sellers.
Adding Confirmation for Stronger Signals
To really stack the odds in your favor, look for a little extra proof from momentum indicators or what the price was doing just before the pin bar appeared. A bearish pin bar that forms after a long, grinding uptrend is often far more powerful because it screams "buyer exhaustion." The bulls have run a marathon, and that pin bar is the first sign they're completely out of steam.
You can also glance at an oscillator like the Relative Strength Index (RSI) for another layer of confirmation. If the pin bar shows up while the RSI is in overbought territory (above 70), it adds weight to the idea that the upward move is overextended and due for a reversal. Combining solid price action with an indicator like this makes for a much more compelling trade. If you're interested in how different chart structures relate, exploring the differences between a bearish flag vs bullish flag can give you a broader understanding.
Executing Your Bearish Pin Bar Trading Plan
Spotting a perfect bearish pin bar is a great start, but it's only half the job. The real difference between traders who make it and those who don't comes down to execution. A rock-solid trading plan is what gets you there, taking the emotion and guesswork out of the equation.
It all boils down to defining your entry trigger, your stop loss, and your take-profit target before a single dollar is on the line.
This simple flow chart breaks down the process of finding a high-probability setup, long before you even think about placing an order.
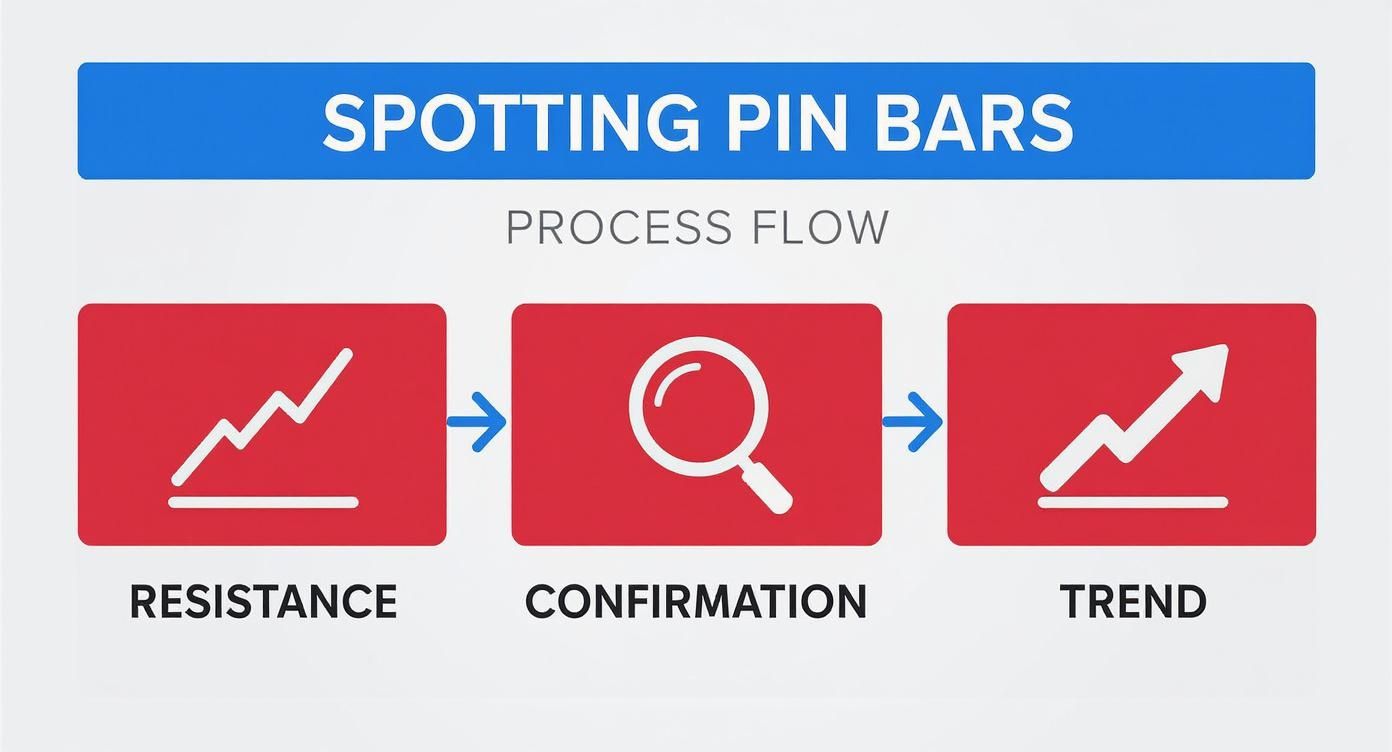
As you can see, a powerful signal starts with price running into a key resistance level. The bearish pin bar confirms the rejection, and if it lines up with the bigger trend, you've got a potential winner.
Choosing Your Entry Strategy
When it's time to pull the trigger on a bearish pin bar, you have two main paths to choose from. Each comes with its own trade-offs between risk and the likelihood of your trade actually getting filled.
Let's look at the two most common entry methods traders use to short a pin bar.
Entry and Risk Management Strategies Compared
| Strategy | Entry Trigger | Pros | Cons |
|---|---|---|---|
| The Conservative Entry | Place a sell stop order just below the low of the pin bar's body. | Confirms that bearish momentum is actually taking hold before you enter. | You get in a bit later, which means a wider stop loss and a less attractive risk-to-reward ratio. |
| The Aggressive Entry | Place a sell limit order at the 50% retracement level of the long upper wick. | Tighter stop loss and a much better potential risk-to-reward. | Price might not retrace to your entry, leaving you on the sidelines as the move happens without you. |
Ultimately, your choice here really comes down to your personal risk appetite. The aggressive approach can lead to bigger wins, but the conservative entry gives you that extra confirmation that sellers are truly in command.
Setting Your Stop Loss and Take Profit
Your risk management plan is everything. It’s the one thing that will protect your capital over the long haul. Without it, even a textbook pattern can turn into a disaster.
Luckily, with a bearish pin bar, the logic is pretty clear.
Your stop loss should always go just a few pips above the high of the pin bar’s long wick. This is your line in the sand. If the price breaks above that high, the selling pressure has officially failed, and you want out of that trade.
As for your take profit, a solid approach is to target the next major support level you can identify on the chart. Another popular method is to aim for a specific risk-to-reward ratio, like 1:2. That simply means for every dollar you risk, you're shooting to make two.
Getting these levels right is a fundamental skill, and you can dive deeper into mastering your stop loss and take profit placements in our full guide.
Automating Pin Bar Detection with Trading Tools
Let’s be honest: manually hunting for the perfect bearish pin bar across dozens of charts is a grind. Hours spent staring at the screen can lead to tired eyes, missed trades, and a whole lot of frustration. Thankfully, you don't have to do it the hard way. Modern trading platforms let you automate the entire detection process, so you can stop searching and start analyzing.
So how does this work? It’s all about using specialized indicators or scanners that do the heavy lifting for you. These tools are coded with a specific rulebook to identify what makes a valid pin bar. You can tell them exactly what to look for—for instance, flagging only the candles where the upper wick is at least two or three times the size of the body.
Leveraging Scanners and Custom Scripts
Platforms like TradingView are fantastic for this because they let you use and even build your own custom indicators with their Pine Script language. This means you can create a scanner that not only finds pin bars but also filters them according to your specific strategy.
Today’s tools are smarter than ever. Indicators like the Pine Script-based PinBar Finders use dynamic thresholds based on the Average True Range (ATR) to automatically highlight high-probability setups. These algorithms look at the precise wick-to-body ratio and factor in recent volatility, taking the guesswork and emotional bias out of your analysis. You can find a bunch of these powerful custom indicators on TradingView.com.
This image shows exactly how it works. A custom indicator is running on the chart, automatically highlighting both bullish and bearish signals as they appear.
As you can see, the indicator labels each candle that meets the criteria. This saves you the tedious work of manual inspection and lets you quickly validate potential setups across different assets and timeframes.
The real game-changer is setting up alerts. You can get a real-time notification sent straight to your phone or desktop the second a qualifying bearish pin bar forms. You’ll never miss a high-quality trading opportunity again.
For those who want to dive even deeper, understanding the basic principles of Intelligent Automation can give you a serious edge in pattern detection. Ultimately, these tools shift your workflow from actively hunting for trades to strategically waiting for the best ones to come to you, letting you execute your plan with precision.
Common Mistakes to Avoid When Trading Pin Bars
Spotting a bearish pin bar is a great start, but becoming a consistently profitable trader is all about knowing what not to do. It’s easy to get lured in by the pattern’s powerful look, only to get stopped out because you missed the bigger picture.
Avoiding just a few common slip-ups can make a massive difference in your results.
The single biggest mistake is trading a pin bar in isolation. A perfect-looking bearish pin bar that pops up in the middle of a choppy, sideways market means very little. It’s missing the most critical ingredient: confluence. You need the pattern to align with something significant, like a major resistance level or a key moving average. Without that, it's just noise.
Another classic error is setting your stop loss way too tight. Jamming it just a single pip above the pin bar’s wick is asking to get shaken out by normal market chop. You have to give the trade some breathing room above that high to account for volatility.
Ignoring Market Conditions
Even a textbook pin bar will fail if the overall market environment isn't on your side. Trying to force a reversal trade in a low-volatility, sideways market is a fast track to frustration as the price just drifts aimlessly.
The strongest bearish pin bar signals show up after a solid uptrend, screaming that buyers are finally running out of steam. A pin bar in a quiet, dead market is usually just random price action, not a high-probability setup.
Here are a few critical mistakes you need to dodge:
- Forgetting Confirmation: Don't just jump in on the pin bar alone. Wait for the next candle to close below the pin bar’s low. This confirms that sellers are actually following through on the rejection.
- Ignoring the Higher Timeframe: A bearish pin bar on a 15-minute chart might look tempting, but if the daily chart is screaming bullish, you're picking a fight with a much stronger trend.
- Poor Risk-to-Reward: Never take a trade if the next major support level is just around the corner. If you can’t realistically aim for at least a 1:2 risk-to-reward ratio, the trade simply isn't worth it.
Avoiding these traps comes down to discipline, a theme that runs through every part of trading. In fact, these principles apply far beyond just chart patterns; you can read about similar strategic errors in our guide to common yield farming mistakes.
Answering Your Questions About Bearish Pin Bars
When you're first getting the hang of this pattern, a few common questions always pop up. Getting these sorted out will help you trade with more confidence.
What’s the Best Timeframe for Trading These?
Stick to the higher timeframes. I’m talking about the 4-hour, daily, or even weekly charts. A bearish pin bar on a daily chart tells a powerful story of price rejection over a full 24-hour period. That carries a lot more weight than a quick signal on a 5-minute chart, which is often just market noise.
Sure, you’ll see pin bars on every timeframe, but their significance grows with the chart’s duration. More traders and more volume contribute to the formation, making the rejection signal far more reliable.
How Do You Know When a Pin Bar Signal Has Failed?
It’s simple: the signal is dead if the price breaks and closes above the high of that long upper wick. Once that happens, the entire rejection story falls apart. It's a clear sign that buyers have wrestled back control and soaked up all the selling pressure that created the pin bar.
When the high of a bearish pin bar is taken out, your bearish theory is officially wrong. The smart move is to accept it, get out of the trade, and protect your capital. Don't fight it.
Does Trading Volume Matter for a Pin Bar?
Absolutely. Volume is a fantastic confirmation tool. A textbook bearish pin bar should form on higher-than-average volume. High volume tells you the big players—the institutions—were heavily involved, which validates the rejection at that price level.
On the flip side, if you see a pin bar form on low volume, be skeptical. It suggests there isn't much conviction behind the move, making the signal weak and more likely to fail.
Ready to put this into practice? With vTrader, you can analyze charts with professional-grade tools and trade over 30 different cryptocurrencies with zero commission fees. Start building your portfolio with vTrader today.

Steve Gregory is a lawyer in the United States who specializes in licensing for cryptocurrency companies and products. Steve began his career as an attorney in 2015 but made the switch to working in cryptocurrency full time shortly after joining the original team at Gemini Trust Company, an early cryptocurrency exchange based in New York City. Steve then joined CEX.io and was able to launch their regulated US-based cryptocurrency. Steve then went on to become the CEO at currency.com when he ran for four years and was able to lead currency.com to being fully acquired in 2025.