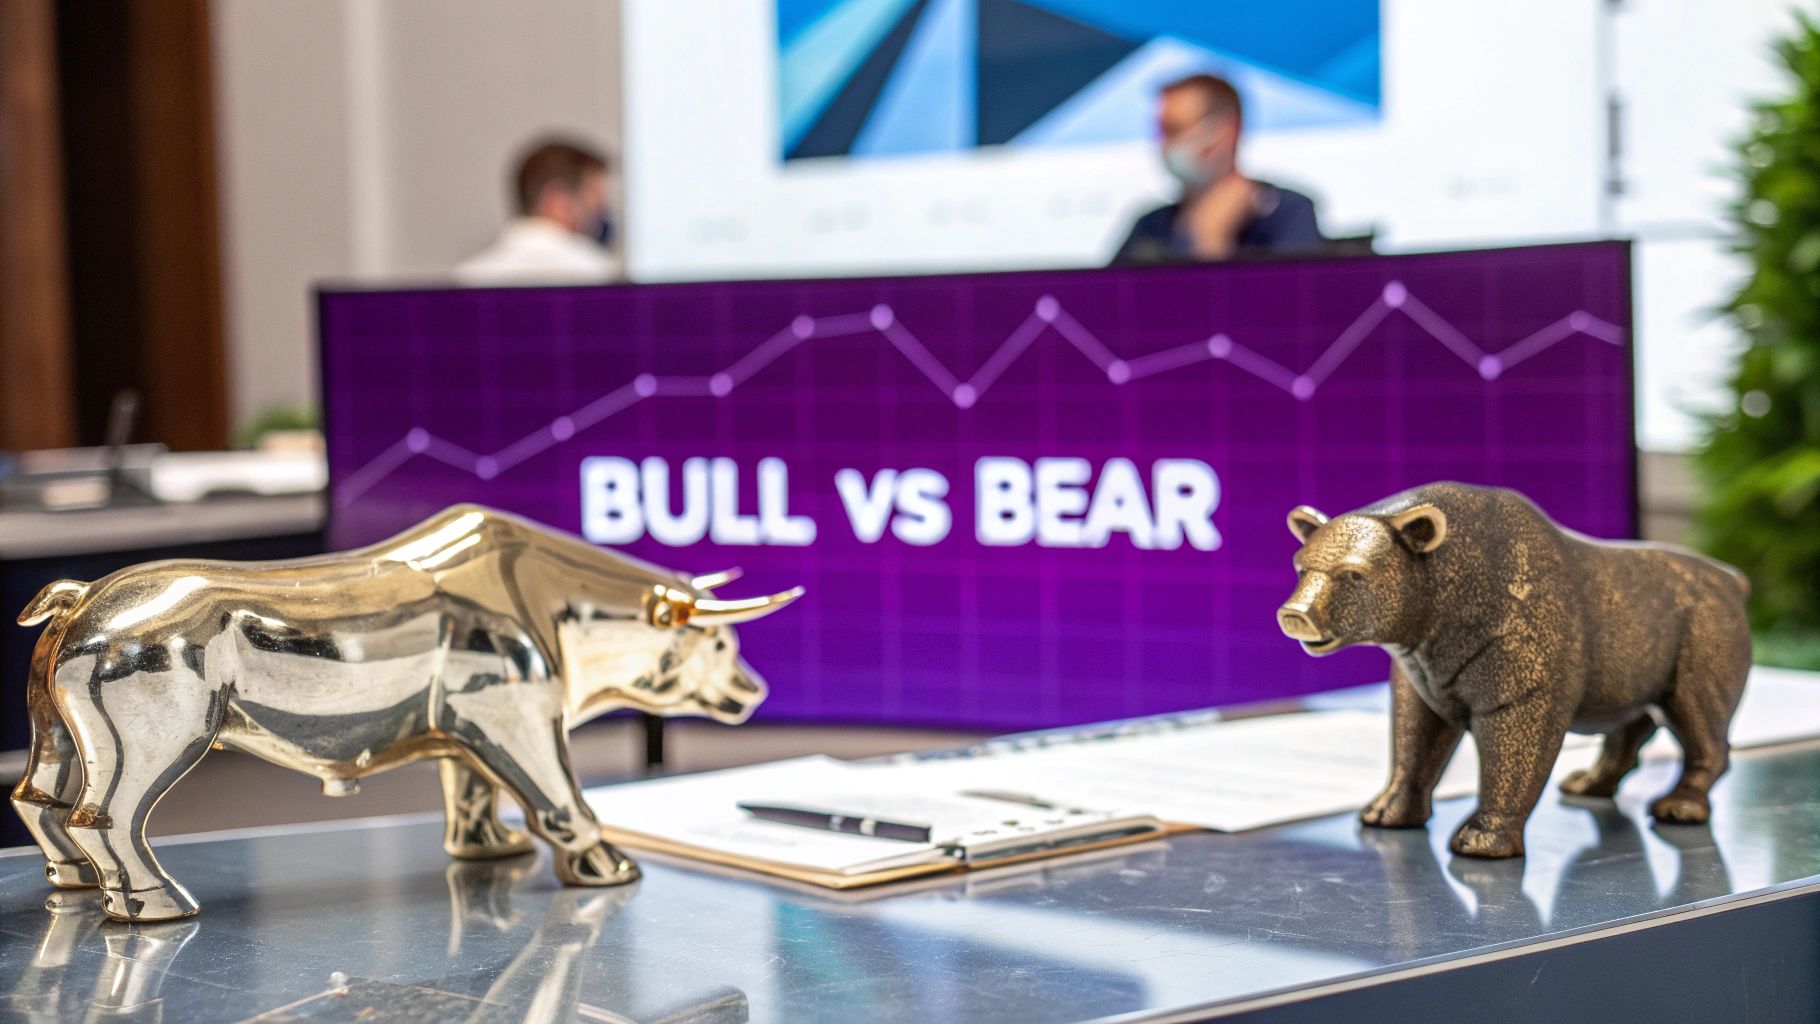
When you boil it down, the main difference between a bearish flag vs bullish flag comes down to one thing: market direction. A bullish flag acts as a green light for an existing uptrend to continue, while a bearish flag signals that a downtrend is probably about to kick back into gear.
Both patterns are really just the market taking a quick breather. Think of it as a brief pause in a strong price move before the trend picks up where it left off.
Understanding Bullish and Bearish Flags
In the world of technical analysis, flag patterns are some of the most dependable continuation signals you’ll find. They’re a sign that the current trend isn't over; it’s just catching its breath. It's like a pit stop in a race—the car is still pointed toward the finish line, but it’s refueling for the next leg.

These patterns have two key parts you need to spot: the flagpole and the flag. Getting a handle on these components is everything if you want to identify and trade them correctly.
The Flagpole and The Flag
The flagpole is the initial, explosive move that sets the whole pattern in motion. For a bullish pattern, this is a sharp, aggressive rally on high volume. For a bearish one, it’s the opposite—a steep nosedive in price, also on heavy volume. This first leg shows real conviction from either the buyers or the sellers.
After that big move, the market settles into a consolidation phase, which creates the flag. This part looks like a small, sloping rectangle or channel that drifts against the main trend. So, in a bullish flag, you'll see the channel angle downward. In a bearish flag, it angles up.
What's really telling is that this consolidation almost always happens on lower volume. That's your clue. It suggests there’s no real power behind the counter-move and that the dominant players are just waiting for their moment to jump back in. The difference between the two patterns is all about their structure and the story they tell about what’s happening behind the scenes.
For a quick breakdown, here’s how the two patterns stack up against each other.
Core Differences Between Bullish and Bearish Flags
This table gives you a quick side-by-side look at the fundamental distinctions, from the market context that creates them to what they mean for your next trade.
| Characteristic | Bullish Flag | Bearish Flag |
|---|---|---|
| Preceding Trend | A strong, established uptrend. | A strong, established downtrend. |
| Flagpole | A sharp, high-volume price surge. | A sharp, high-volume price drop. |
| Flag Direction | A downward-sloping consolidation. | An upward-sloping consolidation. |
| Volume Pattern | High volume on the pole, low on the flag. | High volume on the pole, low on the flag. |
| Trading Signal | A breakout above the flag's resistance. | A breakdown below the flag's support. |
| Market Outlook | Signals more bullish momentum is likely. | Signals more bearish momentum is likely. |
Ultimately, both patterns tell a similar story of a trend that's pausing, not reversing. Recognizing which direction the flagpole points is your key to anticipating the market's next big move.
Anatomy of a Bullish Flag Formation
A bullish flag formation is a classic sign that an uptrend is just taking a breather. I like to think of it as the market catching its breath after a big sprint up before launching into the next leg of the race. If you can learn to spot its components on a chart, you've got a powerful tool in your arsenal.
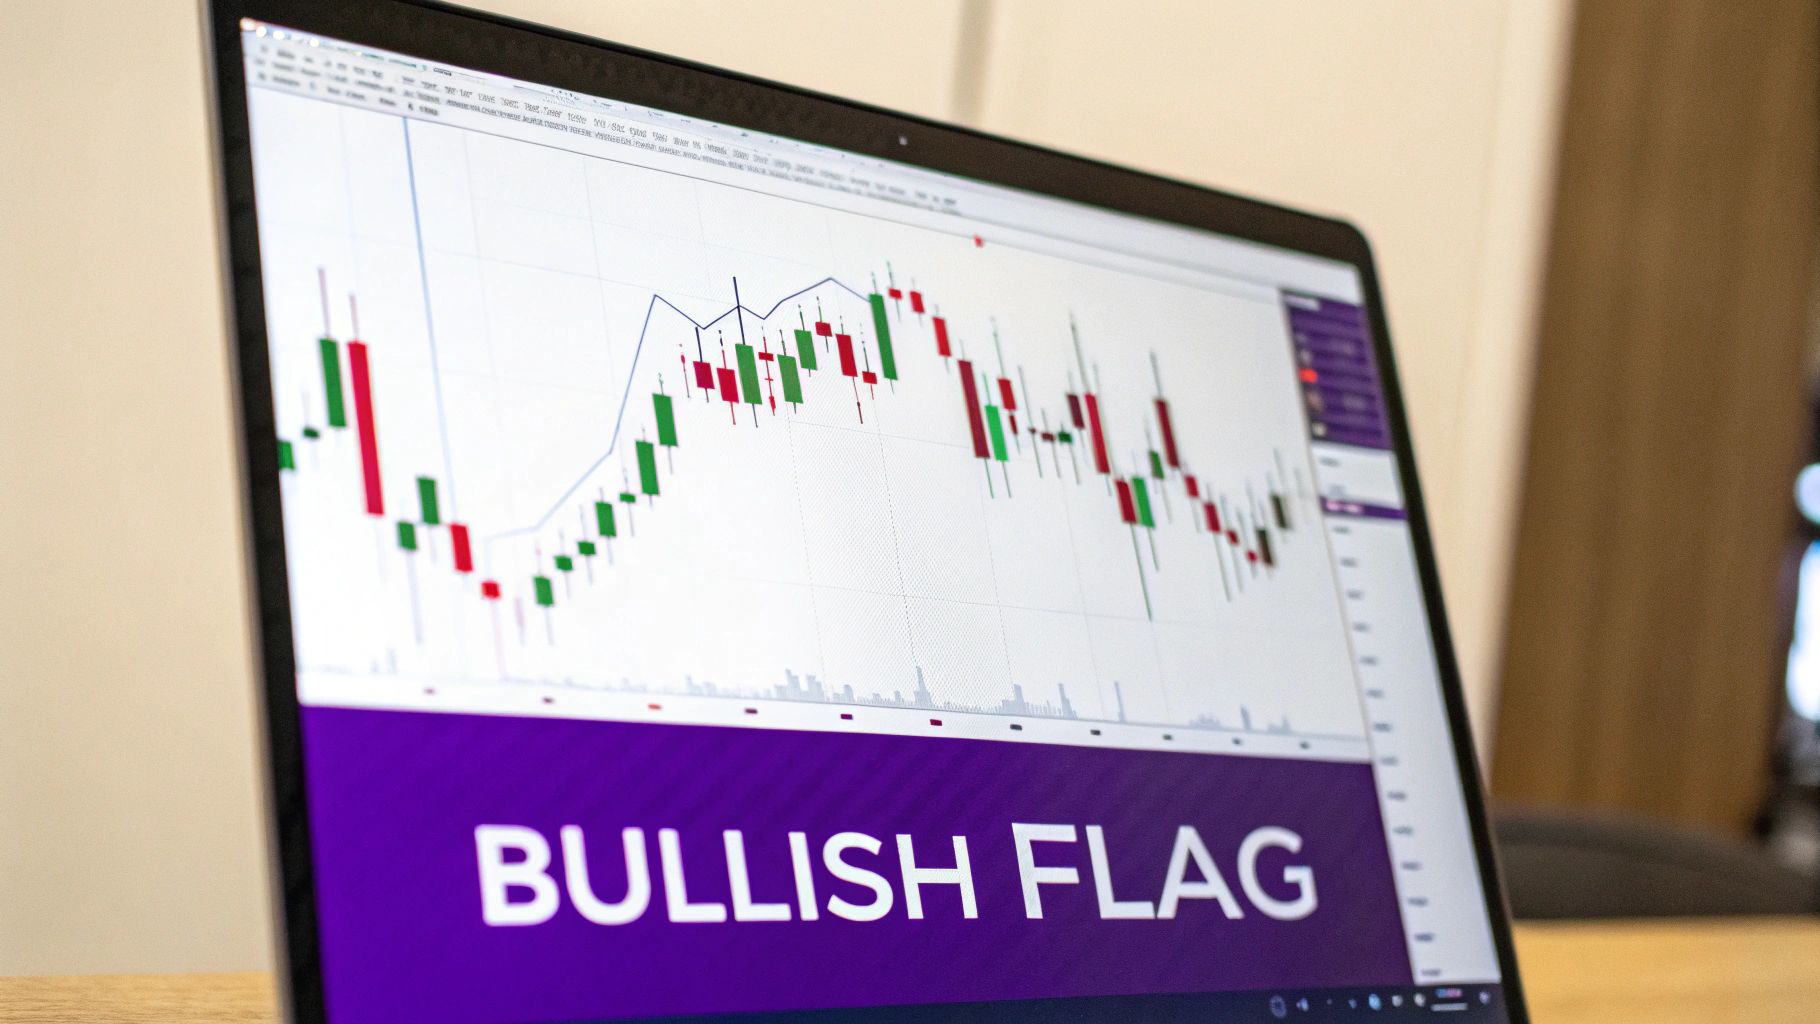
The entire pattern really comes down to two key parts: the flagpole and the flag. Each one tells you something specific about what buyers and sellers are doing at that moment.
The Flagpole: A Sign of Strong Momentum
It all starts with the flagpole, which is a sharp, almost vertical climb in price. This isn't just a slow, steady rise; it's a sudden burst of energy fueled by aggressive buying. One of the key things to look for here is a big spike in trading volume as the price shoots up.
That high volume is your confirmation. It shows that there's real conviction behind the move and that a large number of traders are jumping in, creating the powerful momentum that sets the stage for the rest of the pattern.
The Flag: A Period of Consolidation
Right after that explosive move, the price action calms down and enters the flag phase. This part looks like a small, downward-sloping rectangle or channel on the chart. What's happening here is that the initial buying frenzy has cooled off, and some of the early birds are starting to cash in on their profits.
The most telling sign during this consolidation is a significant drop in volume. This is a huge clue. It suggests sellers don't have enough strength to push the price down and reverse the trend. The market is just absorbing the recent gains, not gearing up for a nosedive.
This low-volume pullback is exactly what you want to see in a healthy consolidation. It tells you the underlying bullish sentiment is still very much alive. The psychology is simple: optimism is just taking a quick pause, not giving way to pessimism. You can see these patterns play out all the time when tracking major assets; our guide on the current BTC price shows how to monitor these movements in real-time.
The Breakout: Confirmation of Continuation
The grand finale of the bullish flag is the breakout. This is when the price decisively pushes through the upper trendline of the flag channel. A true breakout almost always comes with another big spike in trading volume, confirming that the buyers are back in control and ready to push the price higher.
Of course, not every flag works out perfectly. One analysis of thousands of trades showed that "loose" bull flags can fail about 55% of the time. However, a much cleaner, more defined version called a "high-tight" flag has an impressive 85% success rate, often leading to gains around 39% in bull markets. You can find more on these bull flag success rates in detailed studies. This breakout is the trigger that many traders wait for to open a long position, betting that the original uptrend is about to continue.
Deconstructing the Bearish Flag Pattern
If a bullish flag signals a quick breather in an uptrend, its opposite, the bearish flag, tells us a downtrend is just pausing before the next leg down. This is a classic continuation pattern that hints sellers are about to retake control after a short-lived consolidation. Being able to spot this pattern gives you a serious edge in anticipating more downward pressure.
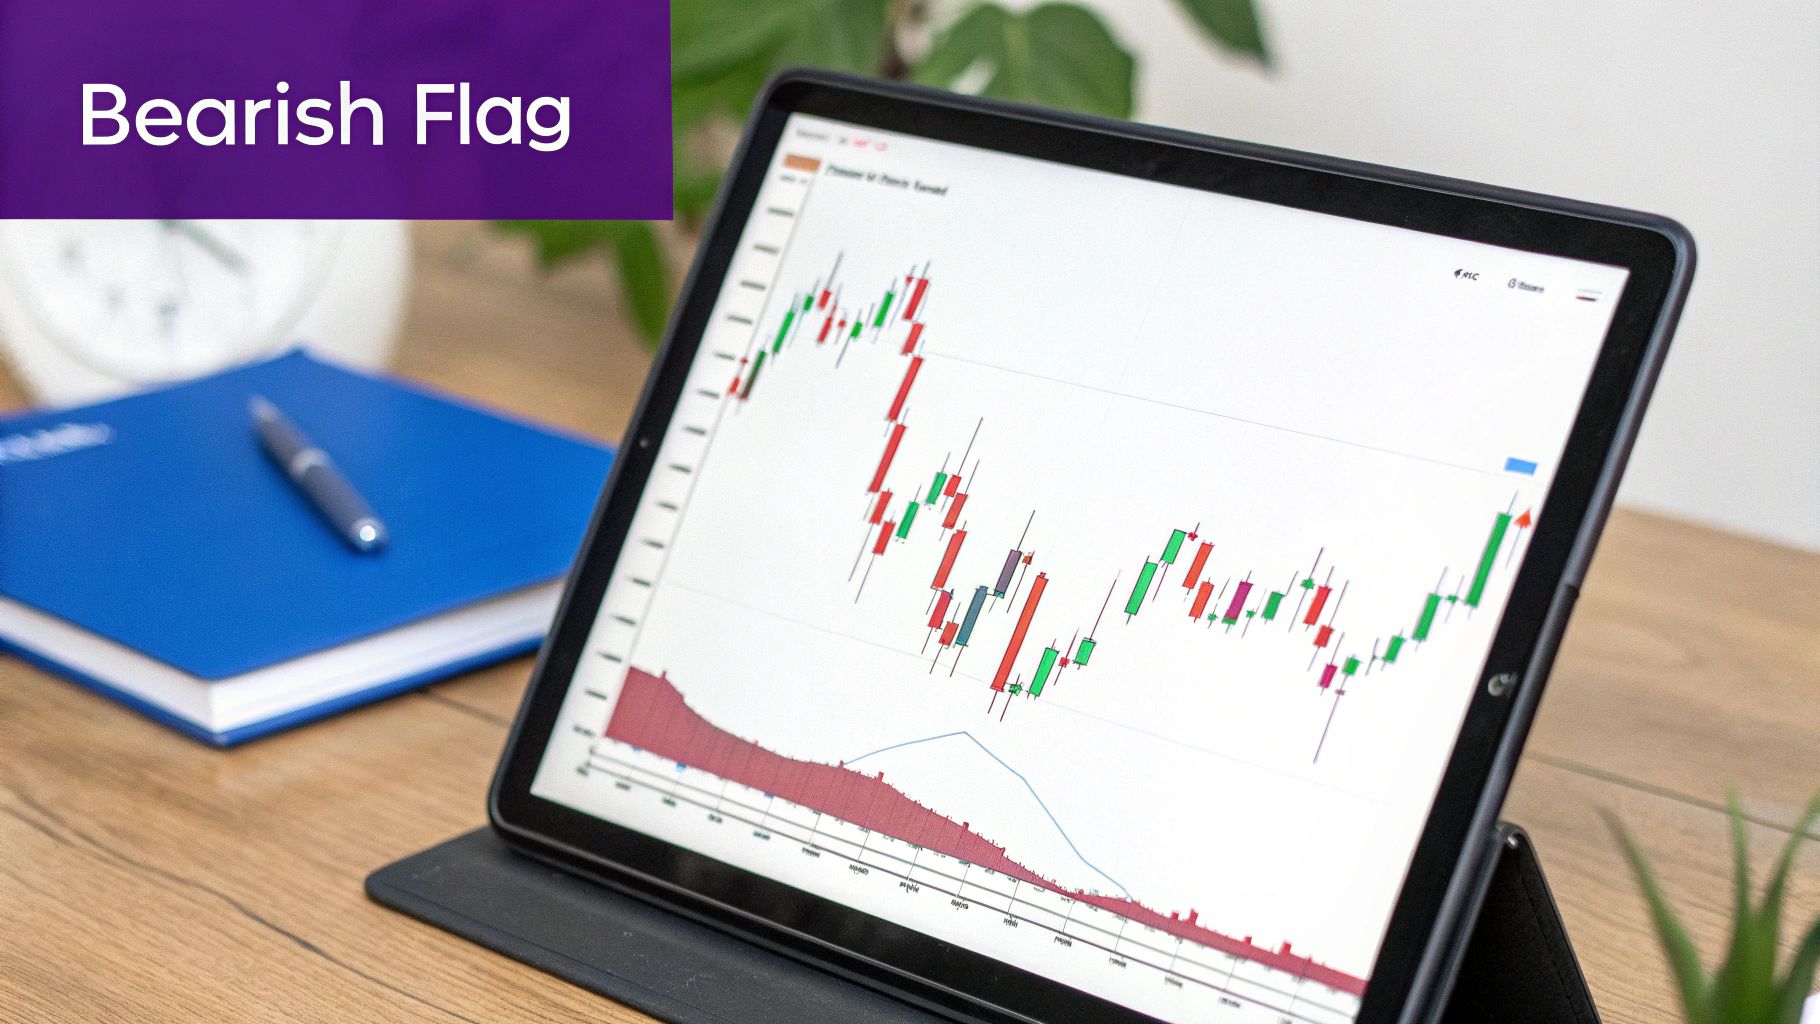
The bearish flag is essentially a mirror image of the bullish one. The components are the same, but they tell a story of aggressive selling followed by a weak, unconvincing rally that ultimately fails.
The Flagpole: A Sharp Downward Move
The whole thing kicks off with the flagpole, which is a steep, significant drop in price. This isn't a slow drift; it's a sharp decline on high trading volume, which screams strong selling pressure and an almost complete lack of buyers. This initial plunge sets the bearish tone and paves the way for the brief consolidation that comes next.
Think of it as a sudden shock to the market. Sellers come in hard, overwhelming any buying interest and sending the price plummeting. The high volume is your confirmation that this is a serious, decisive move.
The Flag: A Weak Upward Drift
Right after the flagpole, the market takes a break in a phase called the flag. This part looks like a slightly upward-sloping channel or rectangle on the chart. What's absolutely critical here is that trading volume usually dries up completely during this period.
This low-volume upward drift is a dead giveaway. It shows the rally has no real strength behind it. It’s not a true reversal, just a momentary pause as sellers cash in some profits and a few hopeful buyers try to push the price up with little conviction. The underlying bearish sentiment hasn't gone anywhere.
This half-hearted rally is a defining feature of the pattern. It’s a timid bounce within a powerful downtrend. Data backs this up, too. One study showed that in downtrends, bear flags tend to form after an 18% average decline and are followed by another 17% drop after the breakout, confirming just how reliable they can be.
The Breakdown: Resuming the Downtrend
The final piece of the puzzle is the breakdown. This is the moment the price slices below the flag's lower trendline, usually with a big spike in volume. This confirms the consolidation is over, and the sellers are back in the driver's seat, ready to push the price lower.
For many traders, this is the signal to enter a short position, betting on further declines. In the crypto world, recognizing this pattern can be incredibly useful for assets like the current Ethereum price, where high volatility can create very clean flagpole and flag formations.
Comparing Market Psychology and Volume Signals
Beyond the chart's geometry, the real story of a flag pattern lies in market psychology and volume. These two elements reveal the conviction—or lack thereof—behind the price moves, giving you a much deeper read on who’s really in control. Getting this right is what separates a calculated trade from a wild guess.
The dynamics behind bull and bear flags tell two very different stories about market sentiment. Bull flags, for instance, pop up after a strong buying frenzy creates a sharp rise. This is followed by a brief consolidation where early buyers take some profits off the table. As detailed in discussions about flag pattern dynamics on coingecko.com, this pause often happens on lighter volume, signaling that the optimism is still very much alive.
On the flip side, bear flags form after a steep price drop. They’re followed by a weak, unconvincing upward bounce, which shows that sellers are just taking a quick breather before pushing the price down again.
Bullish Flag Psychology: The Confident Pause
A bullish flag tells a story of overwhelming optimism. That initial flagpole surge on high volume is your first clue—buyers are in the driver's seat, pushing the price up with serious intent. Then the consolidation phase kicks in, and the price starts to drift down on noticeably lower volume.
That drop in volume is the critical psychological signal here. It tells you that sellers just don’t have the muscle to reverse the trend. The market isn't turning bearish; it's just taking a healthy, confident pause. Early buyers are cashing in some profits, and new buyers are waiting for a decent entry point, but the underlying positive sentiment is still firmly intact.
A bull flag is a confident pause in an uptrend, where buyers are regrouping before the next push higher. The lack of selling pressure during consolidation confirms their control.
Bearish Flag Psychology: The Hesitant Rally
In stark contrast, a bearish flag is all about prevailing pessimism. The flagpole's sharp nosedive on high volume means one thing: aggressive, widespread selling. Sellers are running the show, and any buyer confidence has evaporated. The consolidation that follows—the flag itself—is just a weak, upward drift on very low volume.
This anemic rally is a classic bear market giveaway. It shows buyers are far too hesitant to stage any meaningful recovery. That slight price increase isn't a reversal; it's just a minor bounce while sellers take a short break. The low volume confirms there's no real buying power to back the move, and the dominant bearish sentiment is ready to take over again. Keeping an eye on market news from vTrader can give you the broader context for this kind of sentiment.
Actionable Trading Strategies for Flag Patterns
Spotting a flag pattern on your chart is a good start, but it’s just the beginning. The real skill lies in turning that observation into a well-executed trade, and that requires a solid strategy.
Both bull and bear flags give you clear signals for getting in and out of a trade, but your success ultimately comes down to discipline. It's about moving from simply seeing the pattern to acting on it with confidence. You need a clear plan before you risk a single dollar.
Bullish Flag Entry and Exit Strategy
With a bullish flag, the trade is triggered by a breakout above the flag's upper resistance line. Some traders jump in the moment the price pushes through, but I prefer a more cautious approach. I wait for a candle to close above that line. This extra step helps confirm the move has real momentum and isn't just a fakeout.
Once you’re in the trade, risk management is everything.
- Stop-Loss Placement: Tuck your stop-loss just below the flag’s lower support line. If the price drops to this level, the pattern is invalidated. It’s your signal to get out and protect your capital.
- Profit Target: To set your target, use the flagpole projection method. Just measure the height of the initial flagpole and project that same distance up from the breakout point. This gives you a logical, data-driven target to aim for.
Bearish Flag Entry and Exit Strategy
The bearish flag strategy is just a mirror image. Here, your entry signal is a breakdown below the flag’s lower support line. And just like with the bull flag, waiting for a candle to close below that line—ideally on higher volume—gives you much stronger confirmation that the downtrend is back on.
Protecting your downside is equally important here.
- Stop-Loss Placement: Your stop-loss goes just above the flag’s upper resistance line. A break above this level tells you the bearish signal has failed, and it's time to cut the trade.
- Profit Target: The flagpole projection works the same way here, but in reverse. Measure the length of that initial sharp drop (the flagpole) and project that distance down from the breakdown point to find your profit target.
The secret ingredient for a successful breakout or breakdown is a big spike in volume. Think of volume as the fuel for the price move. Without it, even the most perfect-looking pattern is more likely to fizzle out.
The decision tree below breaks down the key ingredients—trend and volume—that separate a bullish flag from a bearish one.
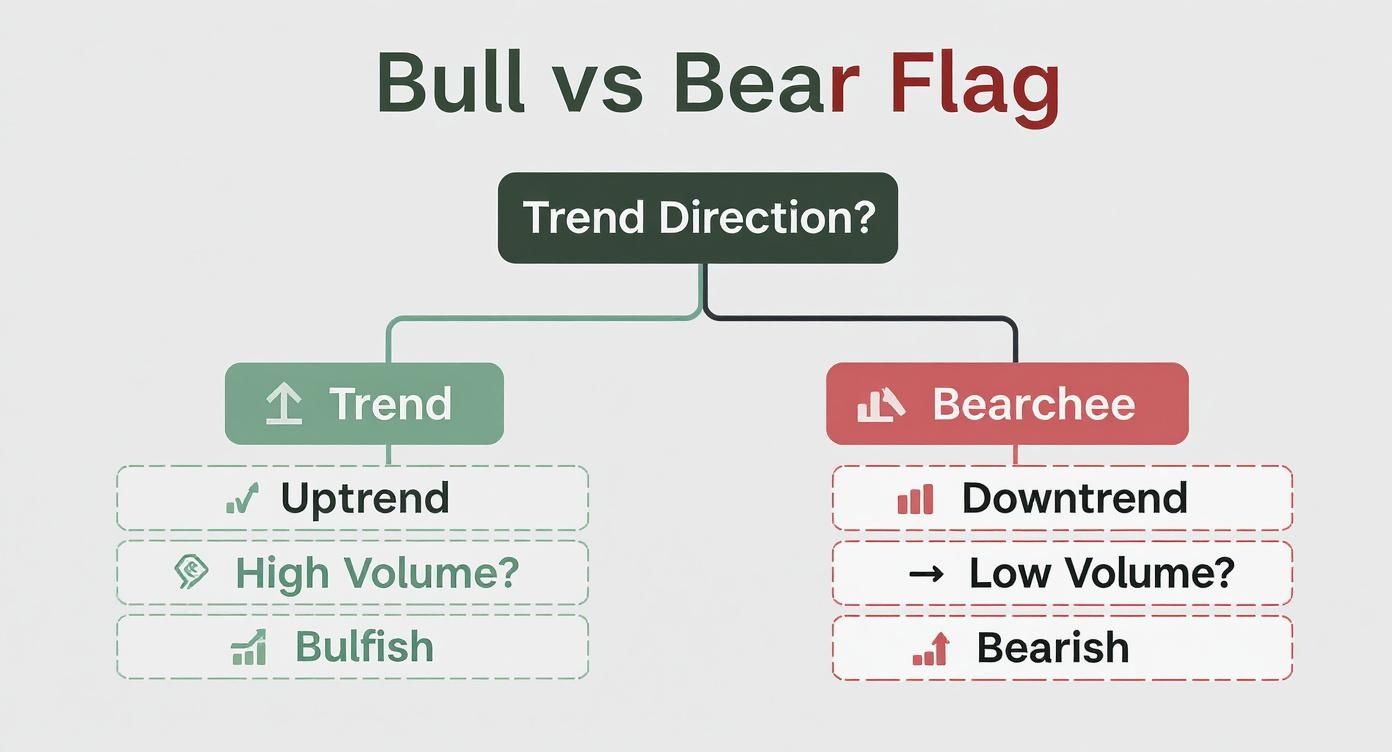
This graphic drives home the point that a strong prior trend is non-negotiable for either pattern to be valid.
Trading Checklist for Bull and Bear Flags
To make this even more practical, here’s a step-by-step checklist. Think of it as your pre-flight routine before entering a flag pattern trade. It helps ensure you've covered all your bases.
| Trading Step | Bullish Flag Action | Bearish Flag Action |
|---|---|---|
| 1. Identify the Trend | Confirm a strong prior uptrend (the flagpole). | Confirm a strong prior downtrend (the flagpole). |
| 2. Spot the Consolidation | Look for a downward-sloping channel (the flag). | Look for an upward-sloping channel (the flag). |
| 3. Plan Your Entry | Set an entry order just above the flag's upper resistance line. | Set an entry order just below the flag's lower support line. |
| 4. Check Volume | Wait for a volume spike on the breakout to confirm the move. | Wait for a volume spike on the breakdown to confirm the move. |
| 5. Set Your Stop-Loss | Place the stop-loss just below the flag's lower support line. | Place the stop-loss just above the flag's upper resistance line. |
| 6. Determine Profit Target | Project the flagpole's height upward from the breakout point. | Project the flagpole's height downward from the breakdown point. |
This checklist keeps your trading systematic and removes emotion from the equation, which is crucial for long-term success.
Once you’ve got a handle on your flag pattern strategies, it's absolutely critical to backtest your trading strategies to see how they perform with historical data. For more in-depth training on technical analysis, check out the vTrader Academy courses.
Common Mistakes to Avoid When Trading Flags
Spotting flags in a hurry can cost you real money. Beginners often lump pennants and flags together and end up in trades that don’t materialize. Confusion between bearish flag vs bullish flag patterns can also throw your entries off-track.
- Misidentifying Pattern: Rushed chart reads create false signals.
- Ignoring Volume: Skipping volume confirmation invites fake breakouts.
- Tight Stop-Losses: Stops placed too near the pattern lead to whipsaws.
Trading flags against the main trend is another classic stumble. Continuation setups thrive on prevailing momentum, so picking counter-trend flags often produces frustration. Going long on a bearish flag in a multimonth downtrend almost always backfires. And if you jump in without a clear risk-reward plan, minor mistakes quickly snowball into big drawdowns.
Quick Checks Before Entry
| Check | Why It Matters |
|---|---|
| Align With Market Trend | Flags signal continuation—ride the primary momentum. |
| Assess Volume Patterns | Declining volume in consolidation reduces fakeouts. |
Validate Patterns Before Entry
Before you pull the trigger on a flag, make sure the flagpole is sharp and the consolidation channel has the right tilt. A bearish flag, for example, shows a steep drop followed by an upward-sloping channel. That slope is what separates it from a bullish pause.
- Confirm Trend Direction
- Verify Volume Decline During Consolidation
- Wait for Candle Close Beyond Boundary
Waiting for a clean candle close is a simple step that cuts through about 73% of premature breakouts.
Manage Risk With Smart Stops
Your stop-loss placement can make or break your P&L. Tuck your stop just beyond the pattern’s extreme to avoid small retracements. Resist the urge to move it when things get uncomfortable—your discipline matters more than any single trade.
“Patience and confirmation are the cornerstones of flag trading success,” advises veteran trader Alex M.
By running through this checklist every time you scan for flag patterns—bearish or bullish—you’ll reduce false signals, stay aligned with the trend, and protect your capital with robust stops.
Frequently Asked Questions About Flag Patterns
Now that we’ve broken down the bearish flag vs bullish flag, you probably have a few questions. Let's clear up some common points to make sure you're ready to trade these patterns with confidence.
What Is the Main Difference Between a Bearish and a Bullish Flag?
The biggest difference comes down to two things: the trend that came before it and the direction the flag is pointing. A bullish flag shows up after a big price spike (the uptrend) and looks like a small, downward-slanting channel. Its appearance signals the uptrend is just taking a breather and is likely to continue higher.
A bearish flag is the exact opposite. It forms after a sharp price drop (the downtrend) and has an upward-slanting channel. This pattern tells you the downtrend is probably not over. Think of them as mirror images of each other, each telling a story about opposite market sentiment.
How Reliable Are Flag Patterns in Trading?
Flag patterns are generally seen as one of the more reliable continuation signals out there, but no pattern is a sure thing. Their success rate climbs when you see the right ingredients come together. A very sharp, clear flagpole is a must, but you also want to see volume confirm the move and make sure the pattern aligns with the bigger market picture.
Remember, a flag pattern's reliability is all about context. If you see high volume on the flagpole and the eventual breakout, but low, quiet volume during the consolidation, your odds of a successful trade go way up.
For example, a bearish flag that appears when the entire market is in a downtrend is a much stronger signal than one that forms randomly against the prevailing trend.
Can I Trade a Flag Pattern Before the Breakout?
You could, but it’s a high-risk move that most traders should probably avoid. Trying to trade inside the tight channel of the flag is tricky because the consolidation phase can be choppy and unpredictable. The pattern could easily fail and reverse on you without any warning.
The smarter play is to wait for confirmation. That means waiting for a candle to close decisively outside the flag’s boundaries, preferably on a spike in volume. Jumping in before you have that confirmation is just asking for trouble, as you could get caught in a false move and take an unnecessary loss. For more answers to common trading questions, feel free to explore our detailed vTrader FAQ page.
Ready to put what you've learned into practice? With vTrader, you can trade Bitcoin, Ethereum, and over 30 altcoins with zero commission fees. Our platform gives you the advanced tools and real-time data you need to spot and trade flag patterns like a pro. Sign up today and start trading smarter.

Steve Gregory is a lawyer in the United States who specializes in licensing for cryptocurrency companies and products. Steve began his career as an attorney in 2015 but made the switch to working in cryptocurrency full time shortly after joining the original team at Gemini Trust Company, an early cryptocurrency exchange based in New York City. Steve then joined CEX.io and was able to launch their regulated US-based cryptocurrency. Steve then went on to become the CEO at currency.com when he ran for four years and was able to lead currency.com to being fully acquired in 2025.