The shooting star pattern is a classic bearish reversal signal that often pops up on candlestick charts, pointing to a potential end of an uptrend. Think of it less as a guarantee and more as a warning flare fired off by the market. It suggests the bulls, who were firmly in control, might be losing their momentum to the bears.
What Is the Shooting Star Pattern

Picture this: a stock has been on a tear, climbing steadily for several days. Buyer confidence is high, pushing the price to new heights. But then, in a single trading session, the dynamic shifts. The price opens, rallies to a new peak, but then sellers jump in with overwhelming force. They drive the price all the way back down, forcing it to close near its opening price.
This intense, one-session battle is what the shooting star visually represents. It tells a powerful story of a failed rally.
The pattern’s most obvious feature is its long upper wick (or "shadow"), which marks the high point that buyers simply couldn't hold. Down at the bottom, you'll see a small real body, showing that by the time the market closed, sellers had dominated the session.
At its core, a shooting star screams one thing: rejection. The market tried to push higher but was decisively smacked back down, signaling that the bullish energy is fading and a downward turn could be next.
The Story Behind the Shape
Learning to spot this pattern isn’t just about memorizing a shape; it's about reading the psychology of the market. A shooting star reveals a critical moment of indecision and a clear power shift from buyers to sellers.
To make sure you're looking at a true shooting star, here are the key ingredients:
- It Needs a Preceding Uptrend: This pattern only matters if it appears after a noticeable price advance. Without that context, it's just another candle.
- It Shows a Failed Rally: The long upper shadow is the evidence. It shows buyers tried to keep the party going but were ultimately overpowered.
- It Confirms Seller Dominance: The small body at the lower end of the candle proves that sellers pushed the price down significantly from its peak.
To help you quickly spot this pattern on a live chart, here’s a quick reference guide.
Shooting Star Pattern Quick Identification Guide
| Characteristic | Description |
|---|---|
| Location | Must appear at the top of an established uptrend. |
| Upper Wick | Very long, at least 2x the length of the real body. |
| Real Body | Small, located at the lower end of the trading range. |
| Lower Wick | Little to no lower wick should be present. |
| Color | The color of the body (red/bearish or green/bullish) is not critical, but a red body is considered a stronger signal. |
This pattern acts as an early warning that an asset's upward climb might be running out of steam. For traders, recognizing this signal is the first step toward anticipating a potential reversal and adjusting their strategy.
The teams behind today's trading platforms know how vital these signals are. It’s why many, like those detailed in the vTrader company profile, focus on providing top-tier educational resources to turn a simple chart into a dynamic story of market sentiment.
Deconstructing the Shooting Star Candlestick
To really get a feel for the shooting star pattern, you have to understand the story it's telling. Think of each part of the candlestick as a chapter in a short, intense battle between buyers and sellers. By breaking down its anatomy, you can start to read the market psychology and spot a real shift in momentum before it takes off.
The first thing you’ll notice is the long upper shadow, or wick. This is the high-water mark of the bulls' ambition. For a moment, buyers were in complete control, pushing the price way up. But their victory was brief. That long wick is the smoking gun—it’s evidence of a failed rally where sellers jumped in and aggressively smacked down those higher prices.
Reading the Market Psychology
Now, look at the small real body huddled at the bottom of the day's trading range. This tiny body shows that even after that big upward surge, sellers had enough muscle to drag the price right back down to where it started. It’s a clear signal that the bears had the final say, wiping out almost all the progress the buyers had made.
Don't get too hung up on whether the body is red (bearish) or green (bullish). While a red body adds a little more weight to the bearish case, the main story doesn't change. The real drama is the rejection at the top, which that long upper shadow makes impossible to ignore.
This isn't just trader folklore; there's data to back it up. A study analyzing over 60 years of S&P 500 data confirmed that the shooting star's predictive power shot up when traders focused on how long that upper shadow was. If you’re curious about the numbers, you can dive into these candlestick analysis findings and see the statistical proof for yourself.
Key Takeaway: The long upper shadow is everything in a shooting star pattern. It’s a visual gut-punch showing a powerful rejection of higher prices and a clear win for the sellers in a single session.
Finally, a true shooting star has little to no lower shadow. This confirms that once sellers pushed the price back down, the buyers were too exhausted to mount any kind of counter-attack before the trading session closed.
Getting a handle on this buyer-seller dynamic is the foundation of good technical analysis. To sharpen your chart-reading skills, the vTrader Academy offers a ton of resources to build your confidence in spotting these kinds of patterns.
How to Accurately Identify a Shooting Star
Knowing the theory is one thing, but spotting a genuine shooting star pattern in the heat of the moment is another game entirely. To move from the textbook to the trading screen, you need a reliable checklist to separate a true bearish signal from simple market noise.
Think of it like being a detective at the scene of a potential market top. For a shooting star to be the real culprit behind a reversal, four specific clues must be present. If even one is missing, it’s a false alarm.
Here’s the essential checklist every trader should memorize:
- A Clear Preceding Uptrend: Context is everything. The pattern is only meaningful if it shows up after a solid run-up in price. It signals a potential end to that bullish momentum.
- A Small Real Body: The distance between the open and close price should be small. This candle body needs to be located near the low of the session, showing that sellers ambushed the buyers and erased most of their progress.
- A Long Upper Wick: This is the smoking gun. The upper shadow, or wick, must be at least twice the size of the real body. It's a stark visual representation of prices being slammed back down.
- Little to No Lower Wick: A tiny (or nonexistent) lower shadow is crucial. It confirms that buyers were too stunned to even attempt a comeback before the session closed.
This chart makes it easy to see what you should be looking for.
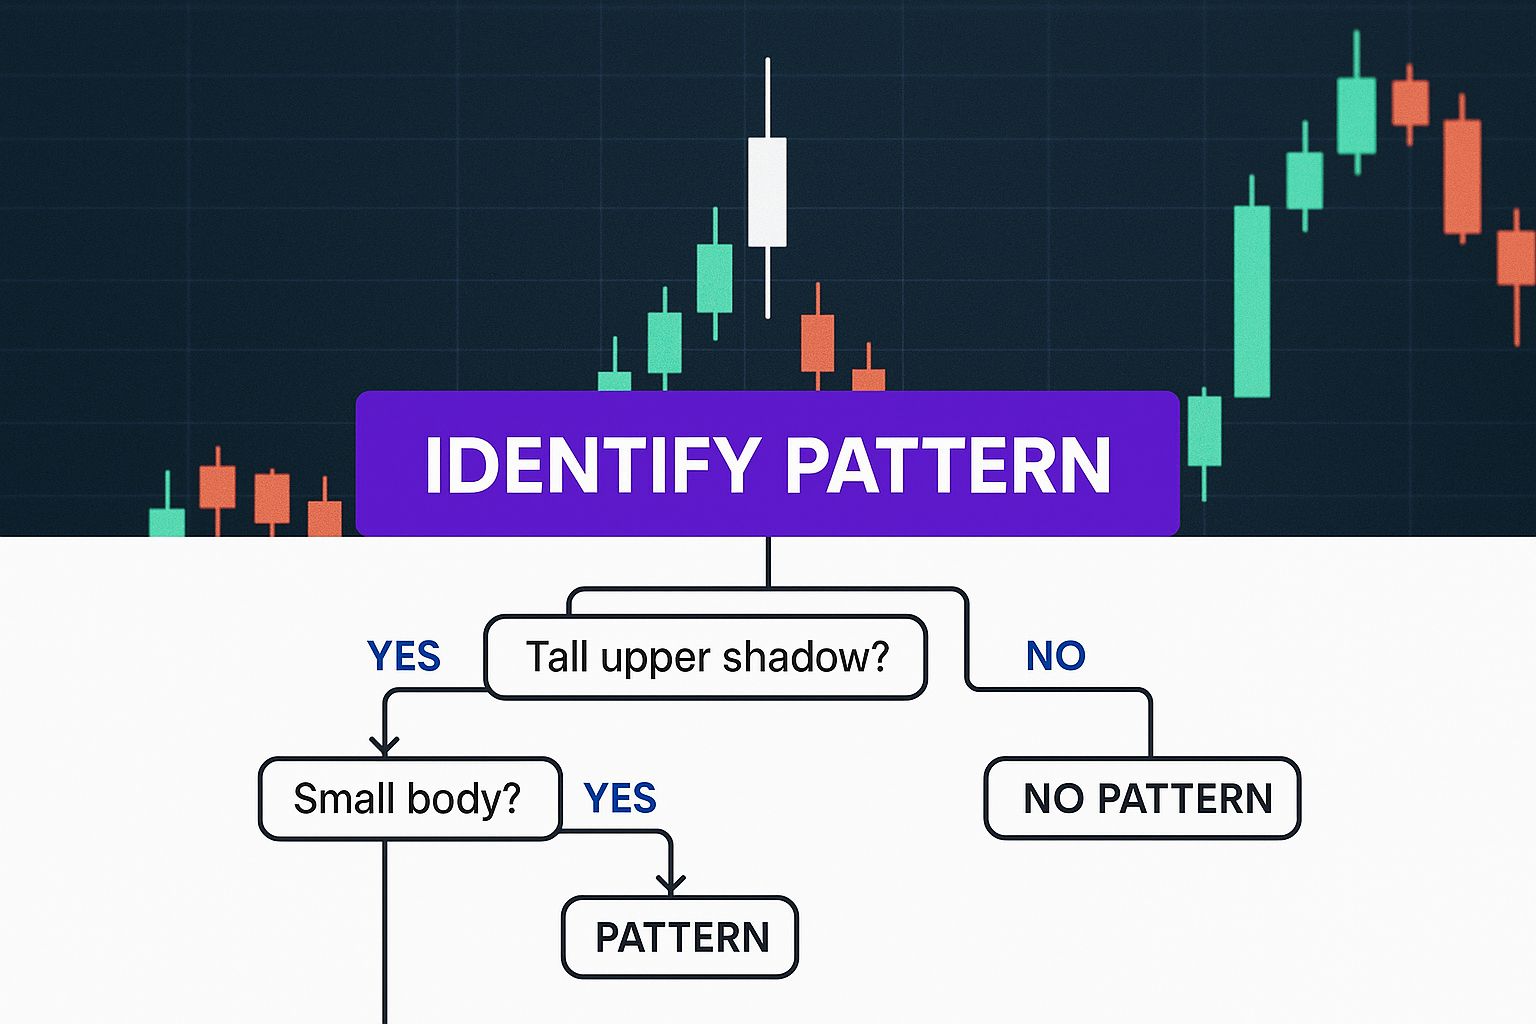
As the image shows, that long upper wick is the star of the show—it’s the first thing that should catch your eye.
Distinguishing from the Inverted Hammer
To really sharpen your pattern recognition skills, you have to know the difference between a shooting star and its bullish twin, the inverted hammer. They look identical—small body, long upper wick. The only thing that separates them is their location on the chart.
A shooting star is a bearish warning found at the peak of an uptrend. An inverted hammer is a bullish signal found in the trough of a downtrend.
By focusing on the trend that came before the candle, you can easily tell them apart and make sure you’re acting on the right signal. Improving your ability to read charts is a core trading skill, and you can build on it by exploring general data analysis techniques that help you interpret market data with more precision.
Trading Strategies for the Shooting Star
Spotting a shooting star pattern on a chart is a good start, but it's not a complete trading plan. Turning that observation into a profitable trade takes discipline and a clear strategy. If you just jump in and short the asset the moment you see the pattern, you're setting yourself up for a world of pain from false signals.
The golden rule here is simple: always wait for confirmation.
Confirmation is your proof that sellers are actually stepping in and taking charge. A solid, time-tested way to get this proof is to wait for the next candle to close below the low of the shooting star. This follow-through tells you the selling pressure isn't just a one-off event, giving you a much stronger reason to pull the trigger on a trade.
Setting Up Your Trade
Once you have that confirmation, it's time to map out your trade. The shooting star is a staple in technical analysis, and most experienced traders approach it with one of two entry methods. For a more aggressive play, you could enter as soon as the next candle opens. If you're more conservative, you might wait for the price to decisively break and close below the shooting star's low. For a deeper dive into how these tactics fit into a broader trading system, you can check out this detailed forex trading blueprint.
Whichever entry you choose, your risk management has to be locked in.
Crucial Insight: Think of your stop-loss as your ultimate safety net. You should always place a protective stop-loss order just a few ticks above the high of the shooting star's wick. This clearly defines your maximum risk and ensures one bad trade doesn't wipe you out if the reversal fizzles.
Planning Your Exit
With your entry and stop-loss set, the final piece is figuring out where to take your profits. A smart approach is to scan the chart's recent past for previous support levels. These are the price zones where the market previously found a floor and bounced.
Here’s a simple framework for taking profits:
- First Target (T1): Aim for the nearest swing low or a minor support level. This is your first logical place to cash in some gains.
- Second Target (T2): If the selling momentum is strong and you blow past T1, your next target could be a more significant, longer-term support zone further down the chart.
This kind of structured plan turns the shooting star from a simple observation into a complete, risk-managed trading strategy. It’s all about combining pattern recognition with sound rules for entry, exit, and risk. In the same way, effectively managing your crypto portfolio requires understanding various strategies; you can learn more by reading our comprehensive guide to staking cryptocurrencies.
A Real-World Shooting Star in Action
Theory and checklists are great, but there’s nothing like seeing a shooting star pattern appear in the wild to truly grasp its power. Let’s step away from the textbook diagrams and look at a real-world example where this single candlestick telegraphed a massive trend reversal for a major company.
Take a look at the chart for Shopify (SHOP) back in November 2021. The e-commerce giant was riding a massive, sustained uptrend. Bullish momentum was in full swing, pushing the stock to one all-time high after another. It was the perfect storm for a reversal signal to appear.
Right at the peak, a textbook shooting star formed. That one candle tells a whole story: buyers initially drove the price up to a new high, full of confidence. But then, sellers slammed on the brakes, shoving the price all the way back down before the close.
The Anatomy of the Reversal: That long upper wick on Shopify's shooting star was a red alert. It was a visual cue that the bullish conviction driving the trend was finally hitting a wall and getting rejected at a critical peak.
The Aftermath and Confirmation
What happened next was crucial. In the following trading sessions, the price couldn't recover. It stalled, then broke below the low of the shooting star candle, confirming that sellers had wrestled control away from the buyers.
That single bearish candlestick marked a major turning point. Throughout 2022, Shopify’s stock price spiraled into a brutal downtrend, plummeting by nearly 70%. The shooting star had called the top. You can see more details of this trade in this insightful trading analysis.
This case study proves a shooting star isn't just a random shape; it’s a snapshot of a critical shift in market power. While we looked at a stock here, the principle is universal. You’ll find the same patterns unfolding on crypto charts, like Uniswap. In fact, you can explore the UNI/USD chart yourself to practice spotting these signals in a different market.
Common Questions About the Shooting Star Pattern
Even when you feel you have a good grip on the shooting star pattern, some nuances can trip you up in the heat of the moment. Getting these common questions answered is key to building the confidence you need to act decisively when this signal flashes on your chart. Let's clear up any lingering confusion with some straightforward answers.
The most common point of confusion? The difference between a shooting star and its look-alike cousin, the inverted hammer. They look identical—small body, long upper shadow—but they mean completely different things. It all boils down to context.
A shooting star is a bearish signal that pops up at the top of an uptrend. An inverted hammer is a bullish signal that forms at the bottom of a downtrend. Same shape, opposite meaning, all determined by where it appears.
Getting this right is absolutely critical. If you mistake one for the other, you could end up placing a trade in the exact opposite direction of where the market is likely headed.
How Reliable Is This Pattern?
Let's be clear: no single candlestick pattern is a crystal ball, and the shooting star is no different. Its reliability gets a massive boost when you find other evidence to back it up. Think of the shooting star as a strong clue, not the entire case file.
Smart traders always look for confirmation. Here’s what gives the signal more weight:
- High Trading Volume: A big spike in volume when the shooting star forms tells you a lot of traders were involved in that price rejection. It adds serious credibility.
- Supporting Indicators: Seeing an overbought reading on the RSI or a bearish MACD crossover at the same time? That’s powerful confirmation.
- Key Resistance Levels: When a shooting star forms right at a major, known resistance level, it’s a much stronger sign that the bulls have hit a wall.
Another question that comes up a lot is about the candle's color. Does a green (bullish) body cancel out the bearish signal? Not at all. While a red (bearish) body is definitely a bit stronger, the real story is told by that long upper wick. That wick is the visual proof of sellers stepping in and shoving prices back down.
What Is the Best Timeframe?
The shooting star is a versatile pattern you’ll see on all charts, from the fast-paced one-minute to the slow-and-steady weekly. But here’s the thing: the longer the timeframe, the more significant the signal. A shooting star on a daily or weekly chart represents a much bigger, more meaningful battle between buyers and sellers, which can often trigger a more powerful and lasting reversal.
Nailing down these details is what separates guessing from effective technical analysis. If you have more questions, you can always explore a broader range of topics in our detailed vTrader FAQ section to deepen your market knowledge.

Steve Gregory is a lawyer in the United States who specializes in licensing for cryptocurrency companies and products. Steve began his career as an attorney in 2015 but made the switch to working in cryptocurrency full time shortly after joining the original team at Gemini Trust Company, an early cryptocurrency exchange based in New York City. Steve then joined CEX.io and was able to launch their regulated US-based cryptocurrency. Steve then went on to become the CEO at currency.com when he ran for four years and was able to lead currency.com to being fully acquired in 2025.