Unlocking the Power of Crypto Candlestick Patterns
Crypto candlestick patterns are visual representations of price action over specific timeframes. They provide valuable clues about market sentiment and potential future price movements. This listicle dissects eight essential crypto candlestick patterns, equipping you with the knowledge to make more informed trading decisions. Each pattern is explained clearly, illustrated with charts, and analyzed for its trading implications. Learn how to identify these patterns and apply them to your crypto trading strategies.
Mastering these patterns will enhance your ability to:
- Spot potential trend reversals: Identify early signs of bullish or bearish shifts in the market.
- Confirm trend continuation: Validate existing trends with candlestick pattern confirmations.
- Time your entries and exits: Optimize your entry and exit points for maximizing profits and minimizing losses.
- Enhance risk management: Make more calculated trading decisions based on probabilistic outcomes.
This list covers key patterns like the Doji, Hammer, Engulfing patterns, Morning and Evening Stars, Shooting Star, Harami, Three White Soldiers/Black Crows, and Dark Cloud Cover/Piercing Line. By understanding these visual cues, you can gain a significant advantage in the volatile crypto market. For traders interested in diversifying their income, understanding SaaS Affiliate Programs can be beneficial. Check out the best SaaS Affiliate Programs in 2025 to maximize your income from Refgrow. We'll explore practical applications of these patterns to Bitcoin, Ethereum, and other altcoins, giving you actionable tools to refine your trading approach.
1. Doji
The Doji candlestick pattern is a powerful tool for spotting potential trend reversals or periods of consolidation in cryptocurrency markets. It’s formed when the opening and closing prices of an asset are virtually the same, creating a cross-like or plus sign-like shape on a candlestick chart. This signifies market indecision, where neither bulls nor bears have gained control. Learning to identify and interpret Doji patterns can significantly enhance your crypto trading strategies. Understanding candlestick patterns is a key skill, and you can further develop your abilities by learning how to read stock charts.
Understanding the Doji
The Doji's distinct appearance, with its minimal body and often long wicks, represents a moment of equilibrium between buyers and sellers. The long wicks indicate price fluctuations throughout the trading period, but the near-identical open and close suggest a stalemate. This makes Dojis particularly relevant in volatile crypto markets. Learn more about Doji patterns and their implications in technical analysis.
Examples of Doji in Action
Several historical examples showcase the Doji's predictive power. Bitcoin's Doji formation at the $60,000 resistance level in April 2021 preceded a significant price pullback. Conversely, a Dragonfly Doji (a type of Doji with a long lower wick) at the $1,700 support level for Ethereum in June 2022 marked a temporary price bounce. Multiple Doji patterns also appeared during Bitcoin's consolidation phase around $40,000 in late 2021, highlighting the market's uncertainty.
The following infographic summarizes the key visual features to look for when identifying a Doji candlestick pattern.
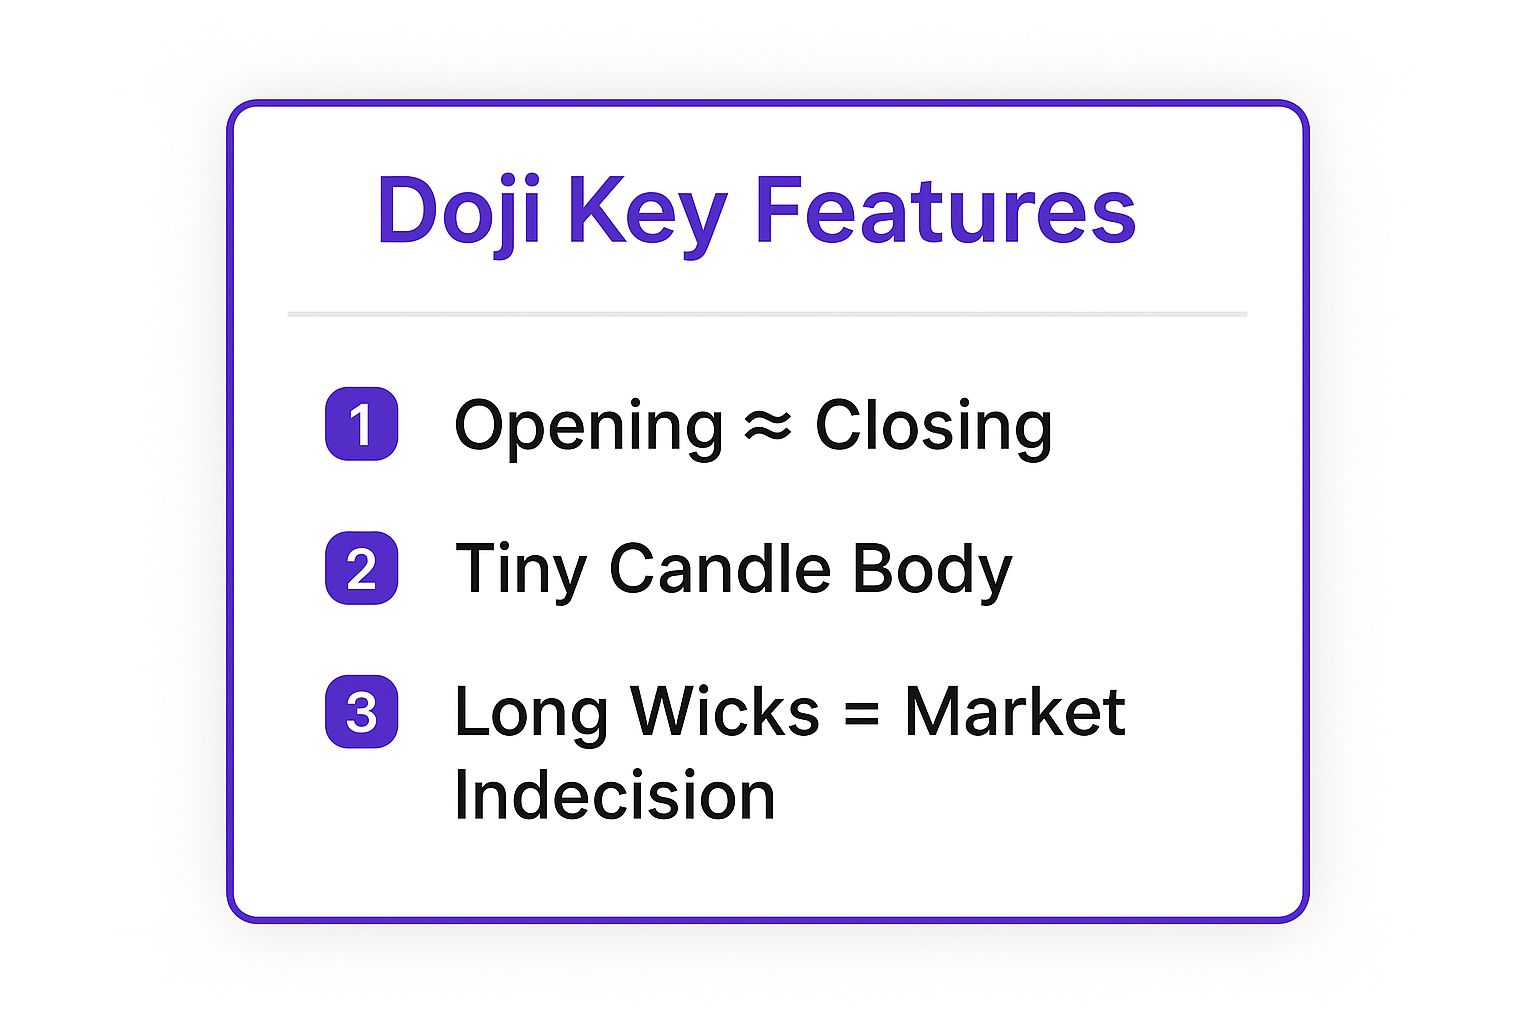
As the infographic highlights, the defining characteristics of a Doji – the matching open and close prices, small body, and extended wicks – visually represent the market's indecision. This pause in the ongoing trend provides traders with a potential signal for a change in momentum.
Practical Tips for Using Doji Patterns
- Confirmation is Key: Avoid rushing into trades based solely on a Doji. Wait for the next candle to confirm the potential reversal or continuation.
- Volume Matters: Dojis accompanied by higher trading volume carry more weight and suggest a stronger potential shift in market sentiment.
- Strategic Locations: Dojis are most effective when appearing at key support or resistance levels, reinforcing their significance.
- Context is Crucial: Always consider the overall trend and other technical indicators when interpreting Doji signals. A Doji in an uptrend might signal a temporary pause, while a Doji in a downtrend could indicate a potential bottom.
This pattern, popularized by Steve Nison in Western markets, traces its origins back to Homma Munehisa's development of candlestick charting in 18th-century Japan. Its enduring relevance in modern crypto trading underscores the power of understanding these time-tested techniques.
2. Hammer and Hanging Man
The Hammer and Hanging Man candlestick patterns are essential tools for spotting potential trend reversals in cryptocurrency markets. Both patterns feature a small body and a long lower wick, resembling a hammer or a hanging man. The key difference lies in their position within a trend. A Hammer appears at the bottom of a downtrend, suggesting buying pressure. Conversely, a Hanging Man appears at the top of an uptrend, indicating potential selling pressure. Mastering these patterns can significantly enhance your crypto trading strategies, especially when combined with other technical analysis knowledge like reading stock charts.

Understanding Hammer and Hanging Man
The long lower wick of both patterns indicates that sellers pushed the price down during the trading period. However, buyers stepped in and drove the price back up, resulting in a small body and a higher close (or near the open in the case of a hammer). This struggle between buyers and sellers is visually represented by the long wick. The location within a trend determines whether this struggle signals a potential reversal. For more information on these patterns, explore resources on crypto technical analysis.
Examples of Hammer and Hanging Man in Action
Historical examples demonstrate the potential predictive power of these crypto candlestick patterns. Bitcoin formed a Hammer at the $28,800 support level in July 2021, which preceded a rally to $45,000. Conversely, Ethereum's Hanging Man pattern at $4,200 in November 2021 preceded a major price correction. Solana exhibited multiple Hammer patterns during its accumulation phase in October 2021, foreshadowing an upward price move.
Practical Tips for Using Hammer and Hanging Man Patterns
- Confirmation is Crucial: Never trade solely on the appearance of a Hammer or Hanging Man. Always wait for the next candle's price action to confirm the potential reversal.
- Volume Adds Validity: Increased trading volume accompanying these patterns strengthens the signal, indicating greater conviction.
- Location Matters: Hammers are more reliable at established support levels, while Hanging Man patterns gain significance at resistance levels.
- Context is Key: Consider the broader market trend and other technical indicators alongside these candlestick patterns for a comprehensive analysis.
- Combine with RSI: Using the Relative Strength Index (RSI) to identify oversold/overbought conditions can further enhance the accuracy of these patterns. Look for Hammers during oversold conditions and Hanging Men during overbought conditions.
These patterns, popularized by Steve Nison, have roots in the candlestick charting methods developed by Japanese rice traders. Their continued relevance in modern crypto trading highlights the enduring value of understanding these techniques.
3. Engulfing Patterns (Bullish and Bearish)
Engulfing patterns are a powerful two-candle formation in crypto candlestick charts that signal potential trend reversals. They occur when the second candle's body completely engulfs the first candle's body, indicating a significant shift in market sentiment. This pattern can be either bullish or bearish, providing valuable insights into potential price movements. Mastering engulfing patterns can significantly enhance your ability to identify trend reversals and make informed trading decisions.
Understanding Engulfing Patterns
A bullish engulfing pattern appears after a downtrend, characterized by a large green candle completely engulfing a smaller red candle. This suggests that buyers have overwhelmed sellers, potentially signaling an upward trend reversal. Conversely, a bearish engulfing pattern occurs after an uptrend, with a large red candle engulfing a smaller green candle. This indicates sellers have taken control, possibly initiating a downward trend reversal. Learn more about Engulfing Patterns (Bullish and Bearish) and how they influence trading psychology.
Examples of Engulfing Patterns in Action
Several notable examples demonstrate the predictive power of engulfing patterns in crypto markets. Bitcoin's bullish engulfing pattern at the $29,000 support level in July 2021 marked the end of a major correction and the beginning of a substantial upward move. Ethereum formed a bearish engulfing pattern at the $4,300 resistance level in May 2021, preceding a sharp price decline. Cardano showcased a powerful bullish engulfing pattern during its August 2021 breakout to new all-time highs.
Practical Tips for Using Engulfing Patterns
- Confirmation Candle: Always wait for the engulfing candle to close completely before entering a trade. This confirms the pattern and reduces the risk of false signals.
- Volume Significance: Engulfing patterns accompanied by high trading volume are more reliable and indicate stronger conviction behind the price move.
- Key Levels: These patterns are most effective when they appear at significant support or resistance levels, reinforcing their potential to trigger reversals.
- Candle Size: Consider the size of the engulfing candle. A larger engulfing candle generally indicates a more powerful reversal signal.
Engulfing patterns, like many other candlestick techniques, have their roots in traditional Japanese candlestick charting methods. Their widespread use in modern crypto trading highlights the enduring relevance of these time-tested techniques.
4. Morning Star and Evening Star
The Morning Star and Evening Star are powerful three-candle reversal patterns in crypto candlestick patterns that signal potential trend changes. The Morning Star appears at market bottoms, suggesting a bullish reversal. Conversely, the Evening Star forms at market tops, indicating a potential bearish reversal. Recognizing these patterns can significantly improve your ability to anticipate market shifts and make informed trading decisions. Understanding effective risk management strategies is crucial when trading these patterns. Learn more about mastering the art of setting stop-loss and take-profit orders today.
Understanding Morning Star and Evening Star
The Morning Star pattern consists of a bearish candle, followed by a small-bodied middle candle (often a Doji), and finally a strong bullish candle. This sequence signifies a shift from selling pressure to buying pressure. The Evening Star is the inverse, featuring a bullish candle, a small middle candle, and a bearish candle, indicating weakening buying pressure and potential price decline.
Examples of Morning Star and Evening Star in Action
Historical data reveals several instances of these patterns accurately predicting trend reversals. Bitcoin formed a Morning Star pattern at the $30,000 support level in the summer of 2021, which preceded a significant price recovery. Ethereum's Evening Star at $4,400 in November 2021 signaled the start of a major market correction. Binance Coin also displayed a textbook Morning Star during its accumulation phase in February 2021, leading to a substantial price surge.
Practical Tips for Using Morning Star and Evening Star Patterns
- Confirmation Candle: Wait for the third candle to close decisively above (Morning Star) or below (Evening Star) the midpoint of the first candle's body for confirmation.
- Gaps between Candles: Gaps between the candles strengthen the reversal signal. A gap down between the first and second candles of a Morning Star, or a gap up between the first and second candles of an Evening Star, enhances the pattern's reliability.
- Volume Confirmation: Increasing volume on the third candle confirms the strength of the reversal. Higher volume signifies greater conviction from buyers or sellers.
- Trend Context: These patterns are most reliable when they appear after extended uptrends (Evening Star) or downtrends (Morning Star).
These patterns, like many others, originated in 18th-century Japan with Homma Munehisa's work on candlestick charting. Steve Nison later brought these techniques to Western markets, further solidifying their role in technical analysis, particularly in the dynamic world of crypto trading.
5. Shooting Star and Inverted Hammer
The Shooting Star and Inverted Hammer candlestick patterns are valuable tools for identifying potential trend reversals in crypto markets. These single-candle patterns share similar visual characteristics but appear in different trend contexts, offering distinct trading signals. Mastering their interpretation can significantly enhance your ability to anticipate price movements and make informed decisions. Learning these patterns, and how to interpret them alongside other indicators like Bollinger Bands, can substantially improve your trading capabilities.
Understanding the Shooting Star and Inverted Hammer
Both patterns feature a small body at the lower end of the price range and a long upper wick. This wick indicates price rejection at higher levels. The Shooting Star appears after an uptrend, suggesting a potential bearish reversal, while the Inverted Hammer forms after a downtrend, hinting at a possible bullish reversal. These crypto candlestick patterns highlight the dynamic interplay between buyers and sellers, providing valuable insights into potential shifts in market sentiment.
Examples of Shooting Star and Inverted Hammer in Action
Bitcoin's Shooting Star formation near $65,000 in April 2021 marked the beginning of a major correction. Ethereum, on the other hand, formed an Inverted Hammer at the $1,750 support level in June 2022, which preceded a price bounce. Dogecoin also exhibited a Shooting Star pattern at its peak around $0.70 in May 2021, foreshadowing a significant decline. These examples underscore the importance of recognizing these patterns in volatile crypto markets.
Practical Tips for Using These Patterns
-
Confirmation is Crucial: Never trade based solely on a Shooting Star or Inverted Hammer. Wait for the next candle to confirm the reversal. A bearish confirmation for a Shooting Star is a subsequent candle closing below the small body. For an Inverted Hammer, a bullish confirmation comes with the next candle closing above the small body.
-
Location Matters: These patterns are most effective when they form at established resistance (Shooting Star) or support (Inverted Hammer) levels.
-
Volume Adds Weight: Higher trading volume on the pattern day amplifies the signal's significance.
-
Wick Length is Key: The longer the upper wick, the stronger the rejection of higher prices, indicating a potentially more significant reversal.
These patterns, though simple in appearance, offer valuable clues about potential price action in the crypto market. Understanding their nuances, along with other crypto candlestick patterns, can be a significant advantage in navigating the complexities of this volatile asset class. This knowledge, popularized by Steve Nison in Western markets, originates from traditional Japanese rice trading practices and emphasizes the enduring value of these time-tested techniques.
6. Harami (Bullish and Bearish)
The Harami candlestick pattern, meaning "pregnant" in Japanese, offers valuable insights into potential trend reversals in crypto markets. This two-candle pattern appears after extended moves and signals a possible shift in momentum. A Bullish Harami forms after a downtrend, featuring a small green candle completely engulfed by a preceding large red candle. Conversely, a Bearish Harami emerges after an uptrend, with a small red candle contained within a larger green one. Understanding Harami patterns can significantly enhance your crypto trading strategies, especially when combined with other technical indicators. You can learn more about the nuances of staking and yield farming compared to simply holding your assets, which might offer another approach to managing your crypto portfolio, in this article about staking vs. hodling.
Understanding the Harami
The Harami pattern suggests a slowdown in the prevailing trend. The smaller second candle indicates reduced price volatility and a potential weakening of the previous move. This visual representation of indecision allows traders to anticipate possible reversals. In the Bullish Harami, the small green candle reflects buying pressure emerging within the downtrend. The Bearish Harami's small red candle, on the other hand, hints at selling pressure entering the uptrend.
Examples of Harami in Action
Several historical examples highlight the Harami's predictive power. Bitcoin showed bearish Harami patterns during its consolidation around $45,000 in September 2021, foreshadowing further downward movement. Ethereum formed a bullish Harami at the $2,800 support level before recovering in late 2021. Solana displayed multiple Harami patterns during its sideways movement in early 2022, indicating ongoing market uncertainty. These instances showcase the importance of recognizing Harami patterns in various cryptocurrencies.
Practical Tips for Using Harami Patterns
- Confirmation is Essential: Look for confirmation from subsequent price action and increased trading volume before entering a trade based on a Harami pattern.
- Trend Context Matters: Harami patterns are most effective after extended trending moves. They suggest a potential exhaustion of the prevailing trend.
- Candle Size is Relevant: Consider the relative size difference between the two candles. A significantly smaller second candle strengthens the reversal signal.
- Combine with Indicators: Use Harami patterns in conjunction with momentum indicators like the Relative Strength Index (RSI) for added confirmation. Learn more about Harami (Bullish and Bearish) patterns and their role within broader technical analysis strategies.
The Harami pattern, originating from Japanese candlestick charting tradition, remains a valuable tool for modern crypto traders. Recognizing these formations can improve your ability to identify potential reversals and make informed trading decisions.
7. Three White Soldiers and Three Black Crows
The Three White Soldiers and Three Black Crows candlestick patterns are valuable tools for identifying strong momentum and potential trend continuation in crypto markets. These patterns are readily identifiable on candlestick charts and offer clear signals for traders. They consist of three consecutive candles, either bullish (white/green) or bearish (black/red), providing crucial insights into market sentiment. Understanding these patterns can enhance your ability to analyze crypto candlestick patterns and make informed trading decisions.
Understanding Three White Soldiers and Three Black Crows
Three White Soldiers are characterized by three consecutive bullish candles with progressively higher closing prices. This pattern typically emerges after a downtrend, signaling a potential bullish reversal. Conversely, Three Black Crows feature three consecutive bearish candles with progressively lower closing prices, often appearing after an uptrend and suggesting a potential bearish reversal. These patterns demonstrate the prevailing market sentiment, whether strong buying or selling pressure.
Examples of the Patterns in Action
Historical examples illustrate the effectiveness of these patterns. Bitcoin displayed Three White Soldiers during its October 2020 breakout above $12,000, signaling the start of a significant bull run. Ethereum showed Three Black Crows during the May 2021 correction from $4,000, foreshadowing further price declines. Similarly, Chainlink formed Three White Soldiers during its February 2021 rally phase, indicating strong bullish momentum.
Practical Tips for Using These Patterns
- Volume Confirmation: Increased volume during the three-candle sequence strengthens the pattern's validity and suggests conviction behind the move.
- Consolidation Context: These patterns are particularly powerful when appearing after periods of consolidation, signaling a decisive breakout.
- Exhaustion Warning: Be cautious if these patterns appear after extended trends, as they could signal potential exhaustion and a possible reversal.
- Trend Confirmation: Use pattern completion as confirmation for your existing trend-following strategies.
These patterns, documented in Western technical analysis by Steve Nison, draw from traditional Japanese market analysis techniques. Their continuing relevance in modern crypto trading highlights the enduring value of these time-tested methods.
8. Dark Cloud Cover and Piercing Line
The Dark Cloud Cover and Piercing Line are two-candle reversal patterns valuable for spotting potential trend shifts in crypto markets. They appear at trend extremes, providing clues about impending reversals. The Dark Cloud Cover signals a bearish reversal after an uptrend, while the Piercing Line suggests a bullish reversal after a downtrend. Mastering these patterns can significantly enhance your ability to anticipate market movements and make informed trading decisions. Further explore these patterns to enhance your understanding of technical analysis.
Understanding Dark Cloud Cover and Piercing Line
The Dark Cloud Cover forms when a bearish candle opens above the previous bullish candle's high but closes below its midpoint. This suggests weakening bullish momentum as bears push prices lower. Conversely, the Piercing Line emerges when a bullish candle opens below the previous bearish candle's low but closes above its midpoint, signaling resurgent buying pressure. Learn more about Dark Cloud Cover and Piercing Line and their practical application in live trading at this link.
Examples in Action
Several historical examples demonstrate the effectiveness of these patterns. Bitcoin formed a Dark Cloud Cover at the $58,000 resistance level in February 2021, preceding a significant price correction. Ethereum displayed a Piercing Line pattern near the $2,500 support level during its July 2021 recovery, signaling a bullish resurgence. Similarly, Cardano showed a Dark Cloud Cover at its September 2021 peak around $3.00, foreshadowing a subsequent downturn.
Practical Tips for Using These Patterns
- Confirmation is Crucial: Look for subsequent price action to confirm the reversal signal before entering a trade. Don't rely solely on the two-candle pattern.
- Volume Validation: Increased volume on the second candle strengthens the reversal signal, indicating conviction behind the price move.
- Strategic Placement: These patterns are most effective when they occur at established support or resistance levels, adding weight to their predictive power.
- Context Matters: Consider the broader market context and other technical indicators when interpreting these patterns. A pattern within a strong prevailing trend might be less reliable than one appearing after an extended move.
These candlestick patterns, popularized in Western markets by Steve Nison, have their roots in classical Japanese charting techniques. Their continued relevance in the dynamic crypto market highlights the enduring value of understanding these time-tested methods.
Crypto Candlestick Patterns Comparison Table
| Pattern | Implementation Complexity 🔄 | Resource Requirements ⚡ | Expected Outcomes 📊 | Ideal Use Cases 💡 | Key Advantages ⭐ |
|---|---|---|---|---|---|
| Doji | Low – single candle | Low – minimal data | Moderate to High reliability | Trend reversals and indecision signals | Clear visual indecision indicator |
| Hammer and Hanging Man | Low – single candle | Low – basic volume needed | High when confirmed | Reversal signals at key support/resistance | Early reversal detection |
| Engulfing Patterns | Moderate – two candles | Moderate – volume important | Very High with volume confirmation | Strong reversal setups | High reliability, clear signals |
| Morning Star and Evening Star | High – three candles | Moderate – volume helps | Very High when fully formed | Major trend reversals | Strong confirmation over time |
| Shooting Star and Inverted Hammer | Low – single candle | Low – volume benefits | Moderate to High with confirmation | Reversals after up/downtrends | Clear rejection signals |
| Harami (Bullish and Bearish) | Moderate – two candles | Low to moderate | Moderate, needs confirmation | Early signs of trend exhaustion | Common, multiple opportunities |
| Three White Soldiers/Black Crows | High – three candles | Moderate – volume ideal | High for trend continuation | Momentum confirmation after consolidation | Strong trend continuation signals |
| Dark Cloud Cover and Piercing Line | Moderate – two candles | Moderate – volume helps | High with volume confirmation | Reversals at trend extremes | Early reversal with defined risk |
Elevate Your Crypto Trading with vTrader
This comprehensive guide has explored eight key crypto candlestick patterns, providing insights into their formations, interpretations, and potential trading implications. From the simple yet powerful Doji to the more complex Morning Star and Evening Star patterns, understanding these visual representations of price action is crucial for any crypto trader. Recognizing these patterns on a chart can provide valuable clues about potential trend reversals or continuations, enabling you to make more informed trading decisions. Remember, these patterns are not foolproof predictors, but rather valuable tools to enhance your market analysis.
Mastering Crypto Candlestick Patterns: A Summary of Key Takeaways
Let's recap the essential takeaways from our exploration of crypto candlestick patterns:
- Context Matters: Candlestick patterns shouldn't be interpreted in isolation. Consider them alongside other technical indicators, market trends, and fundamental analysis for a more holistic view.
- Practice Makes Perfect: Identifying these patterns takes practice. Study historical charts and real-time market data to hone your recognition skills.
- Risk Management: No trading strategy guarantees profits. Always implement appropriate risk management techniques, such as setting stop-loss orders, to protect your capital.
- Continuous Learning: The crypto market is dynamic. Stay updated on new patterns and evolving market conditions to maintain your trading edge.
Why Understanding Crypto Candlestick Patterns is Crucial
Mastering crypto candlestick patterns provides a significant advantage in the volatile world of cryptocurrency trading. These patterns offer a visual language for understanding market sentiment, allowing you to anticipate potential price movements and capitalize on emerging opportunities. By incorporating this knowledge into your trading strategy, you can move from reactive trading to proactive decision-making, increasing your chances of success.
From Theory to Practice: Applying Your Knowledge
Learning about crypto candlestick patterns is only the first step. The real power comes from applying this knowledge in real-world trading scenarios. Begin by practicing on a demo account or with small amounts of capital. As your confidence and experience grow, gradually increase your trading size and explore more complex strategies.
Enhance Your Trading with vTrader
Understanding and applying these powerful crypto candlestick patterns gives you a significant edge in navigating the complexities of cryptocurrency markets. Combine this knowledge with advanced charting tools on vTrader for even better results. Trade Bitcoin, Ethereum, and 30+ altcoins securely and confidently, utilizing vTrader’s robust platform and benefit from additional educational resources to sharpen your trading skills and unlock greater potential. Start your journey toward financial success in the crypto space today. Explore the power of crypto candlestick pattern analysis with vTrader's advanced charting tools and comprehensive trading platform. Visit vTrader to learn more and elevate your crypto trading experience.

Steve Gregory is a lawyer in the United States who specializes in licensing for cryptocurrency companies and products. Steve began his career as an attorney in 2015 but made the switch to working in cryptocurrency full time shortly after joining the original team at Gemini Trust Company, an early cryptocurrency exchange based in New York City. Steve then joined CEX.io and was able to launch their regulated US-based cryptocurrency. Steve then went on to become the CEO at currency.com when he ran for four years and was able to lead currency.com to being fully acquired in 2025.