
Table of Contents
Can XRP Reach $10,000? Feasibility, Market Cap Math, and Scenarios
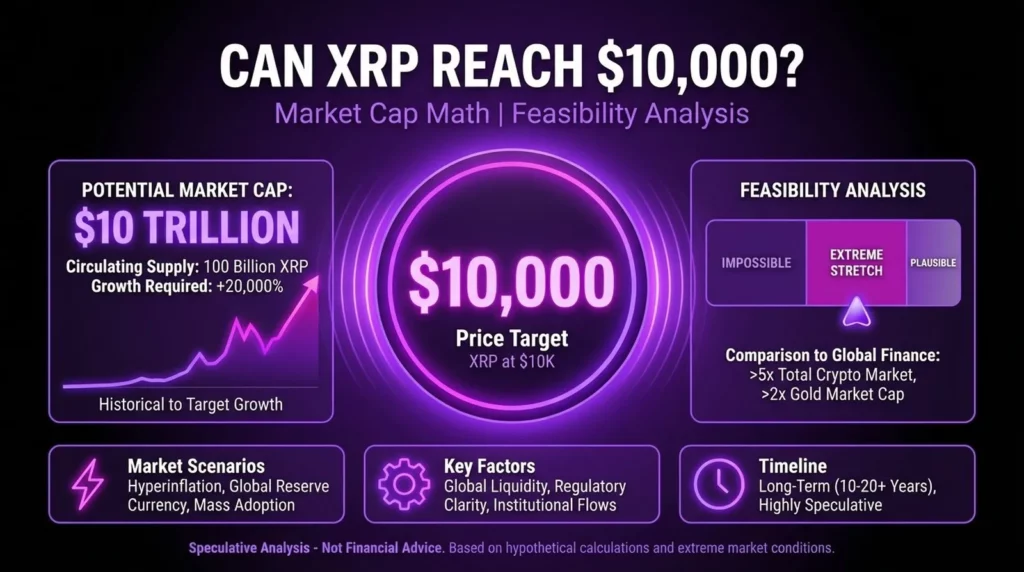
What market cap would XRP need to reach $10,000?
At $10,000, XRP’s market cap equals $10,000 × supply: ~50B XRP implies ~$500T; 100B implies ~$1,000T. That’s far above today’s largest asset markets, so it would require extreme adoption and/or a major monetary regime shift.
A $10,000 price target for XRP is one of the most extreme projections in the cryptocurrency space. Rather than dismiss or endorse it, this article applies market-cap math, liquidity constraints, and scenario analysis to test whether such a price is feasible—and what conditions would need to be true for it to happen.
The framework is straightforward: multiply the target price by XRP’s supply to get the implied market cap, compare that to existing asset classes, identify what constraints sit beyond market cap, and then build scenarios around the preconditions that would need to change. Every assumption is explicit and testable.
This page is part of the XRP price targets ladder. For the full forecast framework, see the XRP price prediction pillar page. For the next step down, see Can XRP reach $1000?.
Quick Answer — Is $10,000 XRP Realistic?
Summary of Feasibility (Math-First)
Under current market structures and monetary conditions, $10,000 per XRP is not feasible. The implied market capitalizations exceed the total value of all global asset classes combined. Even under aggressive adoption scenarios and favorable regulation, the target requires conditions that have no historical precedent in financial markets.
The math is the starting point. At a circulating supply of approximately 58 billion XRP, a $10,000 price implies a market capitalization of roughly $580 trillion. At the maximum supply of 100 billion XRP, the implied market cap rises to $1 quadrillion ($1,000 trillion). For comparison, the entire global equity market is valued at approximately $110–120 trillion, and the total above-ground gold supply is worth roughly $18–20 trillion.
Market Cap Requirement Table
| Supply Assumption | Price Target | Implied Market Cap | Comparison Reference |
| ~58B (circulating) | $10,000 | ~$580 trillion | ~5× global equities |
| ~100B (max supply) | $10,000 | ~$1,000 trillion | ~50× gold market cap |
| ~50B (reduced float) | $10,000 | ~$500 trillion | ~4× global equities |
What Would Need to Be True (Top 5 Conditions)
For $10,000 XRP to become even theoretically possible, several conditions would need to converge simultaneously:
- Extreme global adoption. XRP would need to become a primary settlement layer for a large share of global cross-border payments, trade finance, and institutional value transfer.
- Full regulatory access. XRP would need unrestricted legal status across all major jurisdictions, including the United States, European Union, and Asia-Pacific markets.
- Deep institutional infrastructure. Spot ETFs, custody solutions, derivatives markets, and prime brokerage services would all need to be operational and widely adopted.
- Major monetary regime shift. A sustained period of currency debasement, hyperinflationary pressures, or a fundamental restructuring of the global monetary system could inflate nominal prices far beyond current norms.
- Significant supply reduction. A combination of token burns, permanently lost coins, and long-term holder lockups would need to reduce effective circulating supply well below current levels.
Market Cap Math for XRP at $10,000
Formula and Definitions (Market Cap, Circulating vs. Max Supply)
Market capitalization is calculated as: Market Cap = Price per Token × Total Supply. This is the standard metric used to gauge the total implied value of a cryptocurrency at a given price.
Two supply figures matter for XRP. Circulating supply refers to the tokens currently available on the open market, approximately 58 billion XRP as of mid-2025. Maximum supply is the hard cap of 100 billion XRP, which includes tokens held in Ripple’s escrow accounts and those not yet released. The choice of supply figure significantly changes the implied market cap, so both are shown throughout this analysis.
Market Cap Required Under Different Supply Assumptions
The table below shows how XRP’s implied market cap changes across a range of price targets and supply assumptions. This allows direct comparison at every step of the target ladder.
| Price Target | ~50B Supply | ~58B Supply | ~75B Supply | ~100B Supply | Difficulty |
| $10 | $500B | $580B | $750B | $1T | Achievable |
| $50 | $2.5T | $2.9T | $3.75T | $5T | Difficult |
| $100 | $5T | $5.8T | $7.5T | $10T | Very difficult |
| $500 | $25T | $29T | $37.5T | $50T | Extreme |
| $1,000 | $50T | $58T | $75T | $100T | Extreme |
| $10,000 | $500T | $580T | $750T | $1,000T | Not feasible* |
*Under current monetary and market structures.
Comparisons: Largest Asset Classes (Equities, Gold, Broad Money)
To understand the scale implied by a $10,000 XRP price, it helps to compare against the world’s largest asset pools. These figures are approximate and based on mid-2025 estimates.
| Asset Class | Estimated Value | XRP at $10K as Multiple |
| Gold (above-ground) | ~$18–20 trillion | ~29–32× |
| Global equities | ~$110–120 trillion | ~5–5.3× |
| US Treasury market | ~$27–30 trillion | ~19–21× |
| Global broad money (M2) | ~$100–110 trillion | ~5.3–5.8× |
| Global real estate | ~$330–380 trillion | ~1.5–1.8× |
| Global derivatives (notional) | ~$600–700 trillion | ~0.8–1.0× |
Note: XRP at $10,000 (~$580T at circulating supply) would exceed the value of global equities, gold, and broad money combined. Only the notional value of derivatives is in the same order of magnitude.
The Constraint Layer (Why Market Cap Isn’t the Whole Story)
Liquidity vs. Market Cap (Marginal Buyer, Depth, Slippage)
Market cap tells you the implied total value at a given price, but it does not tell you how much capital is required to reach that price. Price is determined at the margin—by the last trade executed in available liquidity—not by the aggregate market cap figure.
This distinction matters enormously for extreme price targets. A thin order book means that even modest buy pressure can move the price significantly, while deep liquidity requires larger flows to achieve the same movement. For XRP to sustain a $10,000 price, the market would need persistent, deep liquidity at that level—meaning large volumes of buy and sell orders clustered around that price with minimal spread.
Slippage—the difference between the expected price and the actual execution price—would be a critical constraint. At current liquidity levels, even large institutional orders face meaningful slippage. Sustaining a $10,000 price would require order-of-magnitude improvements in market depth across all major trading venues.
Flows Required and Time Horizon (Order-of-Magnitude Estimates)
Estimating the exact capital inflow needed to move XRP to $10,000 is not possible with precision because it depends on how much supply is for sale at each price level, the speed of inflows, and the market’s liquidity response. However, order-of-magnitude framing is useful.
If XRP’s market cap needs to increase from roughly $130 billion (at ~$2.25 per token) to $580 trillion, that represents a ~4,400× increase. Historical crypto market cycles suggest that approximately $1 of net inflow generates $3–$10 of market cap increase (the so-called “multiplier effect”), but this ratio compresses significantly at larger scales. At extreme valuations, the multiplier approaches 1:1 or less.
Flow Math Table (Order-of-Magnitude)
| Time Horizon | Net Inflow Required | Liquidity Assumptions | Comment |
| 10 years | $50–580T+ | Low multiplier (1:1–1:10) | Requires sustained capital inflows far exceeding any historical asset |
| 20 years | $25–290T+/decade | Moderate multiplier + compounding | Still requires multi-trillion annual inflows |
| 30+ years | $15–190T+/decade | Higher multiplier if adoption is organic | Only plausible with major monetary regime change |
Supply Distribution and Float (Locked/Escrow/Long-Term Holders)
Not all XRP is equally available for trading. Ripple holds a significant portion in escrow (currently releasing up to 1 billion XRP per month, with unused portions re-escrowed). Long-term holders remove additional supply from active circulation, and some tokens are effectively lost (inaccessible wallets, burned fees).
The effective float—the XRP actually available for trading at any given time—is substantially smaller than either the circulating or maximum supply figures. This matters because price is determined by trades in available float, not by total supply. A lower effective float means that each dollar of net buying pressure has a larger price impact, but it also means that large sell orders from previously inactive holders can create sharp reversals.
What Would Need to Happen for $10,000 XRP (EAV Preconditions)
Global Adoption and Settlement Demand Scenarios
For XRP to approach $10,000, the XRP Ledger would need to become a dominant global settlement layer. This means processing a significant percentage of the world’s cross-border payment volume (currently estimated at $150+ trillion annually), trade finance, remittances, and potentially central bank settlement.
Adoption at this scale would need to go far beyond Ripple’s current On-Demand Liquidity (ODL) corridor model. It would require native integration into banking infrastructure globally, with XRP serving as a preferred bridge asset across dozens of currency corridors simultaneously.
Regulatory Access Expansion (US + Major Regions)
Legal clarity is a prerequisite for institutional adoption at scale. In the US, the resolution of the SEC’s case against Ripple was a significant step, but full regulatory access means more than a single legal outcome. It includes clear classification frameworks, bank-friendly custody rules, and cross-border regulatory coordination. For detailed coverage of legal developments, see the XRP SEC lawsuit and legal analysis hub.
Beyond the US, XRP would need favorable regulatory treatment across the European Union (MiCA framework), Japan, Singapore, the UAE, and other key financial centers. Any major jurisdiction restricting or banning XRP usage would significantly limit the addressable market for institutional flows.
Institutional Product Stack (ETFs, Custody, Derivatives)
Institutional capital requires institutional infrastructure. The pathway includes spot XRP ETFs (providing regulated exposure for asset managers and retirement accounts), qualified custody solutions (regulated entities holding XRP on behalf of institutions), regulated derivatives (futures, options, and structured products), and prime brokerage services (lending, margin, and settlement).
Each layer of institutional infrastructure increases the addressable capital pool and improves liquidity. However, even with all of these in place, the scale required for $10,000 exceeds what institutional infrastructure alone can deliver.
Macro Regime Shift (Risk Appetite, Inflation, Currency Debasement)
Perhaps the most plausible pathway to $10,000 XRP—at least in nominal terms—involves a fundamental change in the global monetary system. If major fiat currencies experience sustained, severe debasement (high inflation, loss of reserve currency status, or coordinated monetary expansion), nominal prices of hard assets and alternative stores of value could rise dramatically.
In such a scenario, $10,000 XRP might be nominally achievable, but the purchasing power of those dollars would be substantially lower than today. This is the distinction between nominal and real price targets, and it is critical for honest analysis. A $10,000 XRP in a world where a loaf of bread costs $200 is a fundamentally different outcome than $10,000 XRP in today’s dollar terms.
Supply-Side Changes (Burns, Lost Coins, Float Reduction)
Every XRP transaction burns a small fee (currently 0.00001 XRP per transaction), which is permanently destroyed. While this burn rate is minimal at current transaction volumes, significantly higher network usage could accelerate supply reduction over decades.
Additional supply-side factors include permanently lost tokens (inaccessible wallets), Ripple’s escrow release schedule (which controls the rate of new supply entering circulation), and the possibility of community-supported burn initiatives. For $10,000 to become less unrealistic, the effective float would need to contract meaningfully, reducing the denominator in the market-cap equation.
Preconditions Checklist
| Condition | Why It Matters | Observable Proxy | Threshold | Notes |
| Global settlement adoption | Drives persistent demand | ODL volume, XRPL tx count | >$1T/year settled | Currently <$50B/year |
| Full regulatory access | Unlocks institutional capital | Jurisdictions with clear status | All G20 nations | Partial access today |
| Institutional infrastructure | Broadens investor base | ETF AUM, custody assets | >$100B AUM in XRP products | ETF filings pending |
| Monetary regime change | Inflates nominal prices | USD M2 growth, CPI, gold price | Sustained >10% annual M2 growth | Historical precedent in specific countries |
| Supply reduction | Reduces denominator in market cap calc | Burn rate, escrow balance, lost coins | Effective float <30B | Burns currently negligible |
Scenarios for XRP to Reach $10,000
Base Case (Current System Constraints) — Probability Framing
Under the base case, the global monetary system continues along its current trajectory. Central banks manage inflation within target ranges, the US dollar retains reserve currency status, and cryptocurrency adoption grows incrementally but does not replace traditional financial infrastructure.
In this scenario, $10,000 XRP is not feasible. Even with strong adoption growth, regulatory clarity, and institutional products, the implied market cap exceeds realistic capital allocation by orders of magnitude. The probability assessment under this scenario is effectively zero within any conventional investment horizon.
Bull Case (High Adoption + Favorable Regulation) — Still Extreme
The bull case assumes maximum adoption: XRP becomes the dominant bridge asset for global payments, all major regulators provide clear and favorable frameworks, multiple spot ETFs attract hundreds of billions in assets, and the XRP Ledger processes trillions of dollars in annual settlement volume.
Even under these optimistic conditions, $10,000 remains out of reach because the math still requires a market cap exceeding global equities. The bull case might support prices in the hundreds or potentially low thousands (see the analysis in
Can XRP reach $100? and Can XRP reach $500?), but the gap between “extreme bull case” and $10,000 is still measured in orders of magnitude.
Tail-Risk Case (Monetary Regime Change / Hyperinflation Style)
This is the only scenario under which $10,000 XRP becomes nominally conceivable. If the global monetary system undergoes a fundamental restructuring—sustained hyperinflation in major economies, collapse of reserve currency frameworks, or a coordinated global shift away from fiat currencies—then nominal asset prices could increase by orders of magnitude.
In such a regime, all hard assets and alternative stores of value would reprice dramatically. XRP at $10,000 in this context would not represent the same purchasing power as $10,000 today. The target becomes a statement about monetary conditions rather than about XRP’s intrinsic value or adoption.
This scenario has no reliable probability estimate. It falls into the category of tail risks—low probability but high impact—that responsible analysis can describe but not forecast.
“Unit Bias” Warning and Denomination Effects
Investors frequently anchor to round numbers ($10, $100, $1,000, $10,000) without considering what those numbers require in terms of market cap and capital flows. This is known as unit bias—the tendency to evaluate price targets based on the number itself rather than the economic conditions required to reach it.
XRP has a relatively large supply compared to Bitcoin (100B max vs. 21M max), which means each dollar of price increase requires proportionally more capital. A $10,000 XRP is not comparable to $10,000 Bitcoin from a market-cap perspective. Always convert price targets to implied market caps before assessing feasibility.
Sensitivity Tables (Make the Assumptions Explicit)
Supply Sensitivity (Circulating vs. Max)
The table below shows how implied market cap changes with different supply assumptions at the $10,000 target.
| Supply Assumption | Implied Market Cap at $10,000 | Context |
| 30B (extreme float reduction) | $300 trillion | ~2.7× global equities |
| 50B (reduced float) | $500 trillion | ~4.5× global equities |
| 58B (current circulating) | $580 trillion | ~5.3× global equities |
| 75B (moderate release) | $750 trillion | ~6.8× global equities |
| 100B (full max supply) | $1,000 trillion | ~9× global equities |
Adoption and Flow Sensitivity (Annual Settlement or Inflow Requirements)
This table estimates the order-of-magnitude annual net inflows required to reach $10,000 under different time horizons and multiplier assumptions.
| Time Horizon | Multiplier 1:1 | Multiplier 1:3 | Multiplier 1:10 | Comment |
| 10 years | ~$58T/yr | ~$19T/yr | ~$5.8T/yr | Exceeds global GDP |
| 20 years | ~$29T/yr | ~$9.7T/yr | ~$2.9T/yr | Still extreme by any standard |
| 30 years | ~$19T/yr | ~$6.4T/yr | ~$1.9T/yr | Only with regime change |
Time Horizon Sensitivity (10y, 20y, 30y+)
Extending the time horizon makes extreme targets marginally less impossible, primarily because longer periods allow for compound growth in adoption, potential monetary regime changes, and cumulative supply reduction. However, longer time horizons also introduce more uncertainty and more opportunities for competitive alternatives to emerge.
At a 10-year horizon, $10,000 is not feasible under any set of assumptions that does not include monetary regime change. At 20–30+ years, the scenario becomes less impossible if multiple tail-risk conditions materialize simultaneously—but it remains firmly in the speculative category.
What to Watch (Milestones That Move This Target From Impossible to Less Impossible)
Legal and ETF Milestones
Key legal and product milestones to monitor include final resolution of all Ripple–SEC proceedings (including any remaining appeals or settlements), approval and launch of spot XRP ETFs in the US and other major markets, regulatory classification clarity in the EU (under MiCA), Japan, and Singapore, and bank-charter or payment-license approvals that allow direct XRP settlement.
On-Chain and Network Usage Metrics
Usage metrics provide ground truth for adoption claims. Watch for XRPL daily transaction count and unique active addresses, ODL corridor volume (total value settled per month/quarter), number of active corridors and geographic coverage, and developer activity (new projects, AMM usage, sidechain deployment). For deeper analysis of these metrics, see the XRP fundamentals analysis hub.
Liquidity and Market Structure Metrics (Depth, OI, Funding, Spreads)
Market structure tells you whether the infrastructure can support higher prices. Key indicators include order book depth at major exchanges (bid-ask spread at various depths), open interest in XRP futures and options, funding rates across perpetual swap venues, and spot volume concentration and exchange diversity. For ongoing monitoring, see the XRP sentiment and liquidity analysis hub and the XRP technical analysis hub.
Frequently Asked Questions
What market cap would XRP need to reach $10,000?
Multiply the target price by supply. At $10,000, a ~50B circulating supply implies roughly $500 trillion in market cap; at 100B supply, it implies roughly $1,000 trillion (one quadrillion dollars). Both figures exceed the total value of all current global asset classes, so always use your preferred supply assumption and keep the math explicit.
Is $10,000 XRP possible with the current supply?
Under today’s market structure, it is extremely unlikely because the implied market caps are far above any existing asset class. Coherent paths to $10,000 require extraordinary adoption and institutional access plus a major change in the global monetary or liquidity regime and/or significant float dynamics.
Does XRP price depend on market cap or liquidity?
Price is set by marginal trades in available liquidity, not by market cap directly. Market cap is simply price multiplied by supply and is useful for scale comparisons, while liquidity determines whether large capital flows can move the price without extreme slippage.
How much money would need to flow into XRP for $10,000?
There is no single number because it depends on liquidity depth and how much supply is actually for sale at each price level. A better approach is to estimate net inflow over a time horizon and test assumptions using a sensitivity table, such as the 10–30+ year tables in this article.
Could an XRP ETF make $10,000 more realistic?
An ETF can improve access, broaden the investor base, and increase liquidity. But $10,000 implies extreme scale far beyond what any single product can deliver. An ETF would be a supporting condition, not a sufficient one.
Would global payments adoption be enough for $10,000 XRP?
Payments adoption increases utilization, but price impact depends on value accrual mechanisms, token velocity, and how much supply is locked versus freely available. For $10,000, adoption would need to be so large that it materially changes global capital allocation and/or monetary conditions.
Could XRP reach $10,000 if the dollar loses value?
In a high-inflation or currency debasement regime, nominal prices can rise dramatically. The relevant question becomes purchasing power: did XRP rise in real terms, or did the unit of account lose value? Always separate nominal targets from real (inflation-adjusted) targets.
What’s the difference between nominal price targets and real purchasing power targets?
Nominal targets are measured in dollars as they exist at the time of measurement. Real targets adjust for inflation or changes in currency value. A $10,000 nominal target in a fundamentally different monetary regime may not represent the same purchasing power as $10,000 today.
What milestones would make the $10,000 target less unrealistic?
Look for measurable shifts: clear legal outcomes across major jurisdictions, broader institutional access and infrastructure, deep and sustained spot liquidity, persistent on-chain usage growth, and institutional product buildout. Then test whether these shifts materially change the scale constraints in your scenario analysis.
Which XRP targets are more realistic than $10,000?
Most analysts and investors start with nearer targets and work up the ladder: $5, $10, $20, $50, $100, $500, and $1,000. Each step involves its own market-cap math and preconditions. The target ladder links to those individual analyses so assumptions can be compared side-by-side.

Steve Gregory is a lawyer in the United States who specializes in licensing for cryptocurrency companies and products. Steve began his career as an attorney in 2015 but made the switch to working in cryptocurrency full time shortly after joining the original team at Gemini Trust Company, an early cryptocurrency exchange based in New York City. Steve then joined CEX.io and was able to launch their regulated US-based cryptocurrency. Steve then went on to become the CEO at currency.com when he ran for four years and was able to lead currency.com to being fully acquired in 2025.


