
Table of Contents
XRP Price Prediction March
Is March a good month for XRP?
March can be a good month for XRP when the broader market is risk-on and XRP holds key support zones. Use scenario ranges (base/bull/bear) and confirmation triggers—breakouts above resistance or breaks below support—to update the outlook through the month.
Last Updated: January 2026 (Evergreen March framework established)
March Outlook: March is the third month of the calendar year and closes out Q1. XRP’s March performance depends on how Q1 has developed, the prevailing market regime, and whether key catalysts resolve constructively or adversely. March can continue Q1 momentum, provide consolidation, or mark a turning point heading into Q2. Rather than predicting a single price, use scenario ranges with clear confirmation and invalidation rules to adapt as conditions evolve.
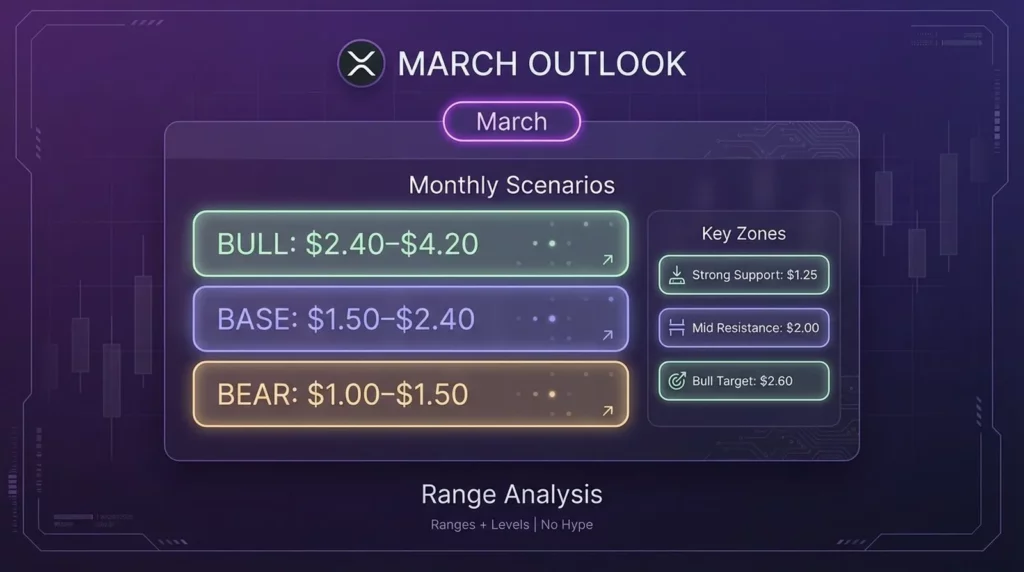
March Scenario Snapshot:
- Base Scenario: Continuation or consolidation of Q1 trend; February structure extends or stabilizes
- Bull Scenario: Breakout above Q1 resistance; momentum extension; positive Q1 close setup
- Bear Scenario: Support breakdown; Q1 reversal; risk-off rotation or macro deterioration
March Key Levels (Current Regime):
- Primary Support: Q1 established floor; February carryover structure
- Secondary Support: Q1 structural backup; major prior breakout zone
- Primary Resistance: Q1 range high / breakout trigger zone
- Extension Resistance: Bull target if Q1 breakout confirms
- Monthly Invalidation: Weekly close below primary support (base case fails)
March Catalyst Checklist:
- FOMC meeting (if scheduled) — rate guidance and Q2 outlook
- CPI/PCE inflation data — price stability and Fed policy signals
- Quarter-end rebalancing — institutional flows and positioning
- BTC regime and volatility — Q1 close implications for altcoins
- ETF flow dynamics — Q1 institutional allocation patterns
- XRP-specific headlines — legal, Ripple updates, ecosystem milestones
Navigate: XRP price prediction → XRP prediction by month → March | How we build scenarios | How key levels are selected
March XRP Forecast Summary (Base, Bull, Bear Scenarios)
| Scenario | Range Logic | Assumptions | Triggers | Confirmation | Invalidation |
| Base | Continuation | Risk-on; Q1 trend persists; normal volatility | Hold support | Range trading | Break S/R |
| Bull | Breakout | Q1 momentum; BTC strength; ETF flows; breakout | Break resistance | Weekly close >R | Rejection fail |
| Bear | Breakdown | Risk-off; Q1 reversal; macro shock; liquidations | Break support | Weekly close <S | Reclaim levels |
Base Scenario (Most Likely March Path)
The base scenario assumes March continues or consolidates the Q1 trend established in January and February. This path requires: risk-on market regime maintained (BTC stable or trending), primary support holding on retests, normal volatility without extreme catalyst surprises, and balanced positioning. March often represents Q1’s final directional push or consolidation before Q2 begins.
Bull Scenario (Conditions for Upside Expansion)
The bull scenario activates on confirmed breakout above March’s primary resistance zone. Drivers include: Q1 momentum continuation, BTC strength supporting broad risk-on sentiment, positive ETF flow data, constructive regulatory/ecosystem signals, or quarter-end positioning favoring risk assets. Confirmation requires a weekly close above resistance with volume expansion. March bull scenarios often emerge when Q1 strength carries into the quarter close.
Bear Scenario (Conditions for Downside Expansion)
The bear scenario activates on confirmed breakdown below March’s primary support zone. Drivers include: risk-off macro rotation (equity weakness, hawkish Fed surprise), BTC rejection and broader crypto weakness, Q1 reversal dynamics, or XRP-specific disappointment. Confirmation requires a weekly close below support with volume. March bear scenarios can emerge from failed Q1 breakouts or new macro concerns heading into Q2.
Key Levels to Watch in March (Support, Resistance, Invalidation)
| Zone | Type | Evidence/Rationale | Confirmation | Failure Signal |
| Primary Support | Support | Q1 floor; February carryover structure | Bounce + volume | Weekly close below |
| Secondary Support | Support | Q1 structural backup; prior breakout level | Defense on retest | Break = bear confirm |
| Primary Resistance | Resistance | Q1 range high; bull scenario trigger | Weekly close above | Rejection = range |
| Extension Target | Resistance | Bull continuation target; Q2 setup | Follow-through | Fail = retest range |
| Invalidation Level | Critical | Base scenario fails; Q1 structure flip | N/A | Weekly close below |
Macro Support Zones (Why They Matter)
March support zones derive from Q1’s trading structure (January-February). The primary support represents the established Q1 floor where buyers accumulated. The secondary support is often a prior breakout level being retested. These zones matter because they represent Q1 structural integrity—holding them confirms the base/bull scenarios; breaking them shifts to the bear scenario and changes the Q2 outlook. For level methodology, see the technical analysis hub.
Macro Resistance Zones (Breakout Confirmation)
March resistance zones are the breakout triggers for Q1 continuation into Q2. Primary resistance is the Q1 range high from prior structure—a confirmed break above triggers the bull scenario. Extension targets represent where price could travel if the breakout succeeds. Confirmation requires a weekly close above the zone with volume expansion. Watch for rejection candles at resistance as early signals that consolidation remains in play.
Invalidation Rules (What Proves the Base Case Wrong)
The base scenario invalidates when XRP breaks decisively below the primary support zone with a weekly close. This signals Q1 structure has failed and the bear scenario becomes the operating framework for the remainder of March. Conversely, a confirmed break above primary resistance invalidates the consolidation thesis and shifts to the bull scenario. Use these invalidation rules to adapt positioning as conditions change.
March Catalysts & Drivers (Entity Map)
| Catalyst | Metric to Watch | Threshold Idea | Why It Matters for March |
| FOMC/Fed Policy | Rate decision; forward guidance | Dovish = supportive | Sets Q2 rate path expectations |
| CPI/PCE Inflation | Inflation data; expectations | In-line = neutral | Affects Q2 Fed policy outlook |
| BTC Regime | BTC price; volatility; dominance | BTC strength supports XRP | Q1 close momentum signal |
| Q1 Rebalancing | Institutional flows; positioning | Net inflows bullish | Quarter-end allocation decisions |
| Leverage/Positioning | OI; funding rates; liquidations | Extremes = volatility risk | Clean positioning = healthier Q2 setup |
| XRP Headlines | Legal; Ripple; ecosystem news | Positive = bullish bias | Can override broader market |
Macro + Risk Appetite (Rates, USD, Equities Correlation)
March macro events can determine whether Q1 ends on a constructive note or reverses. FOMC meetings (if scheduled) set Q2 rate expectations. CPI/PCE data affects policy outlook. Quarter-end dynamics often create positioning volatility as institutions rebalance. Dollar strength typically pressures risk assets; weakness supports them. XRP tends to follow the broad risk-on/risk-off regime—constructive macro supports base/bull scenarios; deteriorating conditions support the bear scenario. For catalyst tracking, see the catalysts hub.
Crypto Liquidity & Leverage (OI, Funding, Liquidations)
March positioning often reflects cumulative Q1 trends. Watch for: OI levels (new leverage entering or old leverage exiting), funding rate extremes (crowded positioning), liquidation clusters (cascade risk zones), and quarter-end effects. Clean positioning after Q1 supports healthy Q2 setup; crowded positioning creates squeeze risk. For positioning analysis, see the XRP next 30 days forecast for rolling horizon tracking.
XRP-Specific Catalysts (Legal/ETF/Access, Ripple/XRPL Milestones)
XRP-specific catalysts can override broader market direction. Legal/regulatory developments affect risk premium. ETF flow data signals institutional demand. Ripple ecosystem updates (ODL volume, partnerships, XRPL metrics) affect fundamental narrative. March can feature Q1 summary reports from Ripple or milestone announcements. For fundamental analysis, see the fundamentals hub.
How to Monitor the March Forecast (Checklist)
Weekly Checkpoints
Each week during March, review:
- Price vs key levels: Where does XRP sit relative to March support/resistance zones?
- BTC regime: Is Bitcoin supportive (trending up) or pressuring (trending down)?
- Positioning: Has funding/OI reached extremes that signal squeeze risk?
- Catalyst resolution: Have major events (FOMC, CPI) resolved? What was the market reaction?
- Q1 close setup: Is volatility expanding or compressing? What’s the Q2 outlook?
For weekly updates, see: XRP weekly hub | Next month forecast
‘If/Then’ Scenario Switching Rules
Use these rules to adapt as conditions change:
- IF XRP holds support and respects resistance → THEN base scenario (continuation/consolidation) remains active
- IF XRP breaks above resistance with weekly close → THEN shift to bull scenario; target extension levels
- IF XRP breaks below support with weekly close → THEN shift to bear scenario; watch secondary support
- IF quarter-end volatility spikes → THEN widen expected ranges; anticipate rebalancing flows
March by Year (Routing Module)
For year-specific March forecasts with precise levels, scenarios, and year-bounded catalysts, see the links below:
| Year | Status | Link |
| March 2026 | Coming Soon | XRP March 2026 Forecast (when published) |
| March 2027 | Future | XRP March 2027 Forecast (future) |
| March 2028 | Future | XRP March 2028 Forecast (future) |
XRP March 2026 Forecast
The XRP March 2026 forecast will be published as March 2026 approaches. It will include specific scenario ranges, key levels reflecting the Q1 2026 context, and catalysts relevant to that period. For overall 2026 context, see the XRP price prediction by year hub.
XRP March 2027 Forecast
The XRP March 2027 forecast will be published when March 2027 approaches. It will include year-specific scenario ranges, levels reflecting the 2027 context, and catalysts relevant to that period.
Related Month Forecasts
February, April (Sibling Months)
XRP Price Prediction February | XRP Price Prediction April (next month, when published) | All months
For shorter time horizons: Next month forecast | XRP March Monthly Update
Frequently Asked Questions
What is the XRP price prediction for March?
March forecasts are best expressed as scenario ranges rather than single prices. This page provides base/bull/bear paths, the assumptions behind each, and the key levels that confirm or invalidate the outlook as price and liquidity conditions change throughout the month.
Is March typically bullish or bearish for XRP?
Month-to-month direction isn’t guaranteed by calendar patterns. Rather than assuming seasonality, evaluate March’s specific conditions: Q1 outcome, current market regime, liquidity environment, and catalysts. Use this page to map those conditions into scenario probabilities.
Is March a good month for XRP?
March can be constructive when risk appetite is positive and XRP holds key support zones. If the market turns risk-off or XRP loses support, downside scenarios gain probability. Use confirmation and invalidation triggers instead of a fixed expectation.
What are the key support and resistance levels to watch in March?
Key levels are higher-timeframe zones where price historically reacted and liquidity clustered. This page provides primary support, secondary support, primary resistance, and extension targets for March. Each zone includes rationale, confirmation signals, and failure conditions.
What catalysts most often move XRP during March?
Common March catalysts: FOMC meetings (if scheduled), CPI/PCE data, quarter-end institutional rebalancing, BTC regime and Q1 close dynamics, ETF flow patterns, and any XRP-specific headlines (legal, Ripple updates). Ecosystem updates can matter more when the broader market is stable.
How do Bitcoin and market risk sentiment affect XRP in March?
XRP often follows the broader crypto risk regime. BTC trend, volatility, and dominance influence liquidity and correlation. A risk-on regime (BTC strength, equity strength) supports XRP upside scenarios; risk-off (BTC weakness, macro concerns) raises downside probability.
How do liquidity and leverage conditions change a one-month forecast?
Thin liquidity and crowded leverage can expand ranges and increase squeeze/cascade risk. Healthier liquidity (deeper books, tighter spreads) can stabilize ranges. Track spot volume quality, bid-ask spreads, open interest, funding rates, and liquidation clusters to assess the volatility regime.
How should I use scenario ranges instead of a single price target?
Plan around ranges and triggers rather than betting on a single number. Start with the base scenario and define confirmation/invalidation rules. When a trigger occurs (e.g., breakout above resistance with volume), shift probability to the appropriate scenario. This approach adapts to changing conditions.
Where can I find XRP price predictions for March by year (e.g., March 2026)?
Use the ‘March by Year’ routing module on this page. It links to year-specific March forecasts (March 2026, March 2027, etc.) which include precise scenario logic, levels, and year-bounded catalysts. This page is the evergreen March hub; year-specific pages provide dated detail.
Update Log
| Date | Update Notes |
| January 2026 | Initial March month hub published. Evergreen framework with year-specific routing. |
This update log tracks material changes to the March framework—scenario weights, key level methodology, and catalyst additions. The page is evergreen; year-specific updates appear in the dedicated March 2026/2027/etc. posts.

Steve Gregory is a lawyer in the United States who specializes in licensing for cryptocurrency companies and products. Steve began his career as an attorney in 2015 but made the switch to working in cryptocurrency full time shortly after joining the original team at Gemini Trust Company, an early cryptocurrency exchange based in New York City. Steve then joined CEX.io and was able to launch their regulated US-based cryptocurrency. Steve then went on to become the CEO at currency.com when he ran for four years and was able to lead currency.com to being fully acquired in 2025.


