
Table of Contents
Bitcoin Price Forecast April 2026 And The Post-Tax Rally
Even though it’s in the next quarter, let’s start to think about April and why it could be a make it or break it month for Bitcoin in order to better position our portfolios. As a trader who’s been through multiple cycles since 2015, I can tell you that timing matters a lot in this market. In fact, probably the most important tool for the average investor. As of writing this, we’re sitting in early February with Bitcoin hovering around $78,000 after it hit a rough patch. But as far as the fundamentals go, April is looking to be a potential turning point.
First off, April 2026 marks the two-year anniversary of the April 2024 halving, which happened around April 19th, 2024, at a price of $64,000. What halvings do is cut the new Bitcoin supply in half, historically sparking supply squeezes that would fuel bullish rallies over the following years. One year after the halving is often when the real momentum kicks in as reduced supply meets growing demand.
On top of that, Q2 (starting in April) tends to bring in fresh institutional capital. Funds review their Q1 performance and adjust allocations based on macroeconomics and monetary policy, often ramping up their Bitcoin exposure if things look solid.
Add in the yearly US tax deadline, which is on April 15th. The tax cutoff is when many investors sell positions beforehand to cover capital gains taxes, creating a temporary pressure on price, but once that’s done, relief buying and refund money start flowing back into the markets and can spark a nice rally.
We’re also coming off what looks like a consolidation phase after 2025’s all-time high (ATH). In short, April 2026 is a combination of halving cycle timing, seasonal tax relief, and quarterly capital flows. I’ve seen this setup before, and it often delivers solid gains for well-positioned and attentive traders. Let’s dive deeper into what the best levels are and what we can learn from history.
April 2026 Bitcoin Price Forecast
Historical patterns show April as one of Bitcoin’s stronger months, especially after a halving event. If macro conditions stabilize, like if the Federal Reserve policy starts to look less hawkish, or if the M2 money supply increases (money in circulation, savings, and near-money), this could launch Bitcoin into a new growth phase. Bitcoin’s price is highly correlated with the M2 money supply. When the total amount of money in the world increases due to government stimulus or bank lending, Bitcoin almost always enters a growth phase.
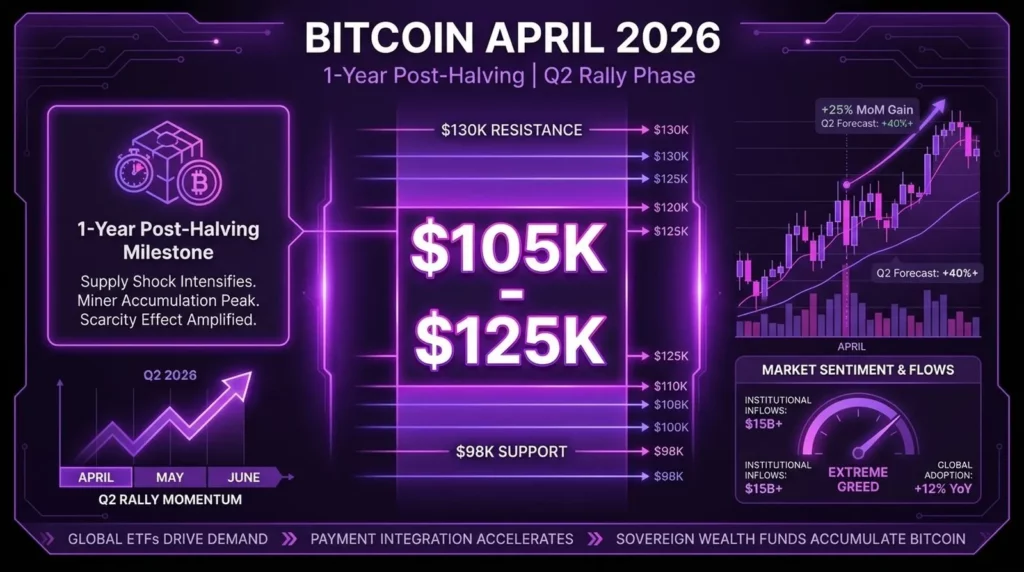
Considering the current market sentiment, historical cycles, and macro views, I see Bitcoin trading between $105,000-$125,000 in April, with a median target of around $115,000. That’s a realistic target given where we are now and the catalysts I will mention below.
The key driver would include moving to a cheap money phase, where the Fed starts to lower interest rates, a weaker US dollar, and institutional money doubling down, thanks to clarity from regulations. The fresh capital from institutions in the form of ETFs and corporate treasuries provided rocket fuel to bullish price action in the past.
We’re not in the explosive early phase anymore, but the maturity of this market means valuation increases that are easier to forecast. If demand holds, $115,000 feels achievable without too much of a stretch of the imagination.
Historical Bitcoin Performance
April Seasonal Strength
April ranks as the third-best month for Bitcoin historically, with an average return of around +12% across all available data. Post-halving Aprils tend to show even better results, averaging closer to +18%.
Why? Because the reduced supply starts showing up in the pricing, plus spring often brings renewed risk appetite in the broader market overall.
The tax window adds extra volatility to the month that you should be aware of. Pre-deadline selling creates dips in value, but once this period passes the historical rebounds can hit 5-8% in the last two weeks as money flows back in.
April 2025 as a Reference Point
Looking back, April 2025 saw Bitcoin priced at an average of around $86,000-$92,000, with a monthly gain close to +14%. It was a turnaround month while Bitcoin faced some macro noise. This will serve as a baseline for us going forward. If 2025 was a recovery/consolidation year post-halving, 2026 could extend that into stronger bullish territory as the cycle effect deepens.
Expert Bitcoin Forecasts
Bullish
Wall Street analysts mention $125,000 as the 2026 breakout target. They point to scarcity as the main factor and say that demand will be the second driver to trigger a push past the psychological and technical barriers. Other aggressive fund analysts call $122,000 as the entry into a Q2 parabolic phase, where the bullish momentum starts to feed on itself.
Moderate
This “middle” camp of analysts is also bullish and forecasts a $118,000 target. There is a lower profit target at $115,000, as a balanced bullish rally outcome, and $112,000 as the point with the highest volume turnover, as we reached ATHs.
You can expect this scenario if the institutional flow stays low and measured. It’s grounded in current technical levels and a moderate economic expansion of the US economy.
Conservative
This is the least bullish camp, and yet they still favor more upside in the future. A reserved forecast level of around $108,000 is expected if we hit sizable profit-taking after Q1 gains, with the caution mostly centered around macro risks.
Two-Year Post-Halving Analysis
Looking back at past cycles, we notice the real action often happens around the 18-24-month mark after a halving event. Let’s take a detailed look.
Historical Two Year Post Halving Patterns
For instance, the 2016 halving took place on July 9th, 2016, at about $650. Two years later, in July 2018, Bitcoin had already gone parabolic with prices at nearly $20,000 (in December 2017). That’s delivering over +2,900% from the halving price before pulling back.
The 2020 halving went live on May 11th, 2020, at a price of about $8,800. Two years later, in May 2022, the cycle had maxed out at $69,000 in November 2021 (about 18 months post-halving). This cycle gave keen traders and investors around +680% from the halving event starting level.
In both cases, the bulk of the gains came in that second year as reduced supply met surging demand from retail traders and institutions.
2026 vs. 2025 Year-Over-Year
Let’s go on to look at our current cycle. If we take the April 2024 halving price of $64,000 as the baseline, historical patterns suggest Bitcoin could be 400-800% higher two years later. That would put April 2026 targets in the $320,000-$576,000 range if we followed the exact same playbook.
But this cycle is different, a lot of the growth already happened with spot ETFs, corporate treasuries, and sovereign nation adoption already in play. Those factors have already included a lot of the demand, so most analysts expect a more reserved bullish run.
Still, April 2026 sits right in the sweet spot where previous cycles saw their tops occur. We’re likely looking at a possible range of $200,000-$350,000 by then, depending on how much fresh capital keeps flowing in.
The moderating factors include a higher starting valuation, regulatory uncertainty in some parts of the world, and the market’s growing size.
The key thing that I want to mention is that April 2026 is the point where the supply shock from the halving has had two full years to compound, at the same time, demand from institutions and everyday users has had time to build.
In past cycles, that’s exactly when the market went parabolic. This time around, we’re not expecting the same insane results, but a strong push into 100k territory still feels very much on the table.
Keep an eye on those ETF inflows and corporate balance sheet announcements. If IT companies show great earnings and add BTC to their balance, they could accelerate things faster than what we currently have.
Post-Tax Deadline Rally
Previous tax seasons have caused an ebb and flow effect of valuations in the market. Money leaves the market during the period of April 1st to 15th and then returns to the market, causing a short rise and fall of prices in BTC and other risk-on assets.
Tax Deadline Pressure Relief
Right up to April 15 every year, US traders and investors sell Bitcoin and other crypto to cover capital gains tax bills. That creates steady selling pressure in early April, often keeping prices soft or pushing them even lower.
Once the deadline passes and the tax filings are done, that selling pressure disappears very quickly. Markets breathe easier, buyers step back in, and we usually see a quick rally.
Looking at past years with similar setups, Bitcoin has averaged +5-8% gains in the two weeks after April 15th. Not every time, but often enough to make it a pattern worth watching.
Capital Redeployment Timing
After the deadline, tax refunds start flowing into bank accounts. A bunch of that money goes right back into risk assets like Bitcoin, stocks, and commodities. Especially if people feel good about the economy.
At the same time, institutions and big players who delayed new buys or rebalances until tax season, now start deploying fresh capital. Those delayed allocations add real buying power exactly when the selling pressure is gone.
In this cycle, with ETF demand already growing, the added liquidity can give bullish trends a nice start into May.
Q2 Institutional Allocation Strategies for April 2026
Institutions have been the backbone of pricing lately, and April lines up nicely as a new month for allocations.
Fresh Q2 Capital Deployment
Big funds, pensions, endowments, and asset managers wrap up their Q1 performance reviews right around the end of March. They look at returns, risk metrics, and how Bitcoin behaved during the quarter.
If Q1 delivered solid gains or showed low correlation to stocks/bonds, then they crank up Q2 Bitcoin exposure. I’ve seen this pattern before with MicroStrategy, where strong quarter results lead to bigger allocations, sometimes growing from 1-2% allocation targets to 4-5%.
They even published research that showed optimized risk-adjusted returns. Quarterly rebalancing is what you need to pay attention to here, institutions are trimming winners and adding to lagging assets in order to hit their preset weights.
Institutional April Positioning
Tax season clears the board, so the end of April becomes prime time for action. In previous years, ETF issuers would ramp up their marketing campaigns targeting advisors, family offices, and institutions after the tax season was behind them.
This would start pushing easier onboarding and education on Bitcoin as a public offering. We’ve all watched BlackRock, Fidelity, and others do exactly this in past springs. What they are doing is drawing in hesitant players with easy-to-sell products.
Corporations also keep adding to their treasuries in Q2 in big chunks. Public companies have been stacking Bitcoin aggressively, with their holdings jumping in 2025 by over 1 million BTC across publicly listed companies by late last year.
Current surveys point to even more accumulation planned for 2026. They buy in measured lots during quieter periods like April to avoid spiking prices, treating it as a long-term hedge against inflation or possible fiat currency weakness.
Endowments and pensions also do their Q2 rebalancing in April. Many of them review their portfolios quarterly, and after gauging Bitcoin’s resilience, they adjust small but meaningful positions. Early buyers like certain university endowments and cautious pensions have already made tactical buys after the start of the year.
Technical Analysis Price Targets
It’s been a rough start to the year following the pullback from ATHs, but April can act like a potential reset month. Here’s a look at the technical setup for price targets, based on the current market structure.
Support Levels
Primary support sits at $90,000-$100,000. That’s where I’d expect Q1 to close if we grind sideways or see mild recovery into the end of March, acting as a floor for any early April dips. It’s a psychological zone tied to recent consolidation highs from late 2025.
Critical support below that is $75,000-$85,000, which lines up with March 2025 lows and key support levels that held during recent corrections. A break under there would signal deeper weakness, but in this year two post-halving phase, buyers tend to defend those levels hard. You can see in the graph below that February is starting out from critical support that was held in April 2025.
BTCUSD Support and Resistance Graph for April
Fig. 1 – BTCUSD Weekly Graph With Support, Resistance, CCI, and Bullish Trendlines
Resistance Levels
The first resistance comes in at $98,000-$100,000, it’s a psychological round number where sellers often step in after an impulse. It’s the area where the value needs to prove itself to keep climbing.
The next major resistance is at $110,000-$120,000. Clearing this opens the door for Q2 continuation and breaking ATHs. A move above here would be aligned with the prior cycle and would confirm stronger institutional interest picking up.
Breakout territory is above $125,000-$130,000 and would also mean a late entry. Do not get caught here. That’s when FOMO usually makes people pile on, even though we’ve also seen similar levels trigger big runs once they were cleared in the past.
Key Technical Indicators
If momentum is to build, the RSI indicator should hover around 68-80 on the daily graph steadily as we go into April. That will be a strong bullish signal.
As long as the indicator is above 50, it confirms that bulls have taken over. But watch out for overbought signals above 80, which could mean a correction is coming soon. The CCI indicator works well for pointing out oversold and overbought conditions here as well.
MACD looks set for sustained bullish expansion at the start of February, with the histogram getting tighter on higher timeframes as buying pressure builds around the key support area.
BTCUSD Graph with MACD and RSI Indicators
Fig. 2 – BTCUSD Weekly Graph With MACD and RSI Oscillators Showing Oversold in February
Volume is the wildcard here in the forecast. It would be wise to expect a rise in open interest after April 15th as the relief buying and redeployed capital hit the markets. Higher volume on up days would mean we validate the move, but low-volume rallies get faded fast by market professionals.
April 2026 Fundamental Analysis
There are several fundamental factors worth watching closely in April. First, the halving anniversary tends to reignite media attention and momentum, often pulling capital back into the market.
At the same time, Q1 corporate earnings will give us a clearer picture of balance sheet health and could increase the risk appetite overall. Also, be on the lookout for corporate treasuries quietly increasing their crypto exposure, this was a huge boost to valuations in the past.
Not specific to April, but I also recommend that you watch for regulatory improvements, continued hashrate growth, and signs that the Fed policy is moving from tightening to stabilization. All these factors coming together will mean that the broader market sentiment looks increasingly constructive for crypto assets.
What makes this setup even more compelling is how these factors reinforce each other rather than pull in different directions. Strong earnings and steadier monetary policy reduce liquidity stress, which makes it easier for big institutions to justify making long-term Bitcoin allocations.
The rising hashrates will confirm that miner confidence is improving despite the volatility in January, while regulatory progress lowers the risk threshold for institutions to enter the market. None of these factors are explosive catalysts on their own, but together they form a steady bullish narrative that supports higher prices if market sentiment turns modestly positive.
Risk Factors Around April
February started off rough, the market was feeling the pain from macroeconomic concerns, Fed policy uncertainty, and some liquidations happening around falling prices.
Downside Catalysts
Even with the two-year post-halving setup looking solid, April could still hit some roadblocks. I mentioned the halving anniversary around April 19-20, which could trigger a “sell the news” type of market sentiment. Traders who bought the hype months earlier dump their positions, especially if media coverage includes crypto without fresh demand stepping in.
To add on top of this, we have Q2 portfolio calibration. If Q1 delivers decent gains (pushing us towards $100,000 from today), institutions and early buyers will want to lock in their gains during the April rebalances. That will add additional supply right when the momentum needs to carry us forward. Be wary of this.
Macro dips are the wildcard in this situation. If the Fed signals additional tighter policy, or if inflation stays sticky, or global risks hit (think dollar strength and stock market selloffs), Bitcoin gets dragged down hard as a risky high beta asset. In this cycle, since we are in the more mature phase of the market, it doesn’t shrug off broad sentiment as well as it used to.
Trading Strategies April 2026
Let’s talk about some strategies that could work to get the most out of April when things could flip positive.
The post-tax period from April 15th on is usually the cleanest time to enter a momentum play. Before this, selling often creates a dip early in the month as folks cash out to pay their taxes. But once April 15th passes, the relief buying tends to return fast, so position yourself for that upside impulse.
Look to buy weakness in the first half if the support area holds around $90,000-$93,000, then ride the wave as volume picks up. At this point, it’s a short-term momentum trade, not a HODL.
For longer Q2 positioning, you have to decide what you’re doing early. You can chase momentum if we break $100,000, and take your profits around $125,000 to lock in the gains before other fund managers get the same idea. In this more institutional-led cycle, grinds higher are a common theme, so put trailing stops on winners rather than set-and-forget your stop levels.
Swing trading the $98,000-$125,000 range makes more sense if we consolidate in this area. Buy near primary support, sell near major resistance. Use tight stops below critical levels like $98,000-$100,000 to avoid big drawdowns for yourself if you’re swing trading.
Around the halving anniversary, FOMO can spike hard with just generic media hype. Don’t chase these breakouts blindly, wait for confirmation, like higher volume or a clean daily candle close above resistance.
In past cycles, I’ve seen anniversary dates spark quick pumps followed by fades, so scale in small using the tips I gave you, but always have an exit plan. Patience beats FOMO buys every time.
April 2026 as Q2 Momentum Indicator
A strong close in April can sometimes act as a green light for the rest of Q2. We saw this in the previous cycle. When April delivered solid growth (of at least 10%), May and June frequently continued this move, sometimes they even turned parabolic as fresh capital came in. We’ve seen it in past cycles where spring strength built momentum into full-blown summer rallies.
On the other hand, if April stalls or pulls back hard, it warns us of weaker sentiment, maybe more chop or turning bearish instead. Track monthly closes and volume trends as these are easy to understand and tell you exactly what’s going on with the current market sentiment.
A simple rule that I follow is to let the trend pick a direction before I do. Let April show its hand, then follow the strength, whichever way it points you.
April Forecast Key Questions Answered
Here are short, straight answers to the most frequently asked questions we get from our forecasts. It’s based on the cycle we’re in, seasonal patterns, tax flows, and Q2 institutional momentum. Bitcoin sits around $77,000-$78,000 today (February 2, 2026) after a rough dip, so these targets assume recovery and build-up.
What is Bitcoin’s price forecast for April 2026?
The range sits between $105,000-$125,000, with a median target of $115,000.
Will Bitcoin reach $120,000 in April 2026?
It is possible that there is a 45% chance that the bulls will be in control. This can only happen if bullish momentum builds post-tax season.
How does the halving affect the price in April?
Historically, the price grows as scarcity effects compound. But now, we are in a market that is dictated by the overall maturity of the asset class. Big institutions, with their billion-dollar balance sheets, are usually the ones capable of causing a significant change in price, not retail, like it was in the past.
When is the post-tax Bitcoin rally supposed to happen?
Previously, it happened around April 15-30th, after the tax deadline passed.
Is April a good month to buy Bitcoin?
Statistically, yes. The usual seasonal strength plus the tax relief bump at the end of the month make it lucrative to trade around and invest for the long term.
Should I buy Bitcoin before or after April 15th, 2026?
After. This way, you could catch a relief rally. But, buying the dips before the deadline can also work if you are patient and can catch it at the right time.
How does April 2026 compare to April 2025?
This year, there will likely be stronger upside because of the cycle progression compared to 2025’s consolidation.
Putting it all together
Wrapping things up, April 2026 is likely going to present a solid trading opportunity window with a large range in play. The two-year halving milestone, the tax relief bounce, and anticipation of the Fed’s interest rate decision create real potential for growth rather than supporting a bearish narrative.
Stay attentive, watch the key economic calendar dates, and remember that even though cycles change, the supply and demand structures endure. So trade smart and keep your size small until you notice a strong trend forming.

Steve Gregory is a lawyer in the United States who specializes in licensing for cryptocurrency companies and products. Steve began his career as an attorney in 2015 but made the switch to working in cryptocurrency full time shortly after joining the original team at Gemini Trust Company, an early cryptocurrency exchange based in New York City. Steve then joined CEX.io and was able to launch their regulated US-based cryptocurrency. Steve then went on to become the CEO at currency.com when he ran for four years and was able to lead currency.com to being fully acquired in 2025.


