
Table of Contents
Today, we will be using technical, seasonal, cyclical, and fundamental analysis to forecast what Bitcoin could be worth in February 2026. We’re now sitting in mid-January 2026, with BTC hovering around the $94,000–$96,000 area after some choppy trading to start the year. This puts us roughly 22 months past the April 2024 halving (when the block reward dropped to 3.125 BTC). This is a point in the cycle where, historically, patterns change from explosive growth to more steady momentum and consolidation.
Post-halving cycles have previously delivered their biggest gains in the first 12–18 months, with supply tightening and demand building. By month 22, we typically see a continuation of momentum from previous rallies. If institutions start piling in again via ETFs, regulatory clarity holds or improves, and macro conditions stay positive (think lower rates and steady adoption) we can see a bullish continuation. But it’s not all smooth sailing from here.
We’ve seen corrections up to 78.6%, profit-taking crash prices, and occasional macroeconomic recessions. Right now, crypto market sentiment feels optimistic, with bulls pushing higher but bears watching for any dip below key support levels.
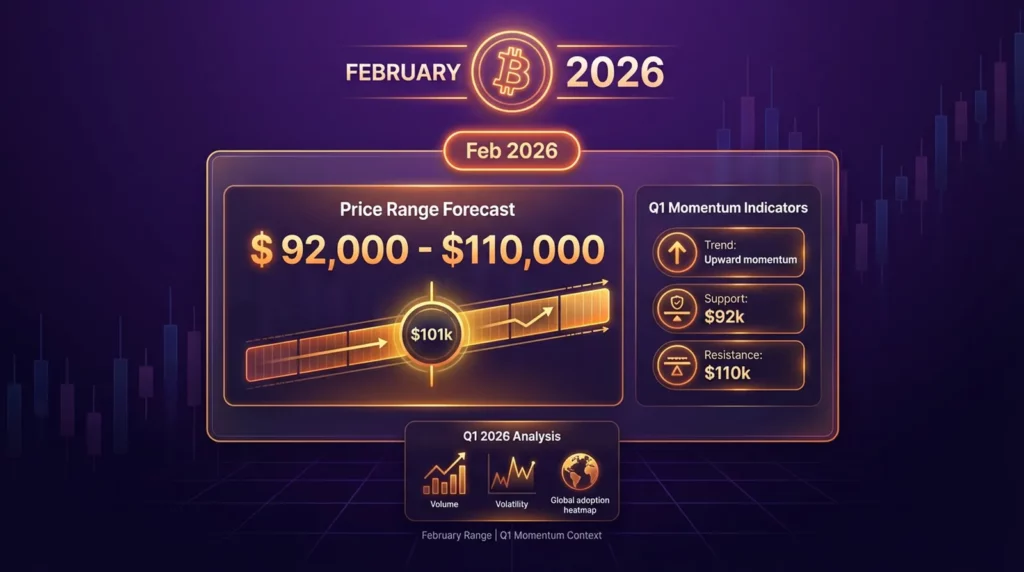
My price forecast for February is between $95,000 to $110,000. This is a realistic price range with room for upside if we break resistance around $98,000 and momentum builds, but there’s potential to correct down to $92,000 if we go flat or see some selling pressure.
One thing to watch for this month is the Chinese New Year, which falls on February 17, 2026 (it’s the year of the fire horse). Historically, this holiday does affect Asian liquidity. Trading volumes sometimes dip before the festivities, leading to short-term volatility. With global adoption of crypto growing, it might not dominate headlines like in past cycles, but I expect some two sided volatility around mid-February.
Wall Street Analysts February Forecast
Let’s start by breaking down expert sentiment. Roughly 35% of experts are bullish, pushing toward $110,000 with strong buying coming from institutions and macro statistics improving. 50% of experts think moderate and are expecting a steady grind higher to $100,000.
Finally 15% are conservative, warning us of pullbacks to $92k or below if profit-taking becomes the norm for institutions or if the market outlook turns negative due to poor macroeconomics. This is a testament to the maturing market cycle where the major players dictate the rules with less retail frenzy, and more identifiable institutional participation.
Main factors that are driving valuations:
- Q1 momentum is building. If the rallies from all-time highs (ATHs) carry over due to holiday inflows or year-end rebalancing (tax harvesting), February can sometimes grow with that momentum alone.
- Earnings season sometimes makes the market optimistic. Positive corporate earnings reports coming out in mid-January to February can cause new positive or negative volatility. With strong balance sheets and crypto exposure from big players it could fuel additional buying.
- Where we are in the halving cycle. We’re past the peak euphoria phase of 12–18 months post-halving, so now we can expect more measured moves. But scarcity still supports gradual upside unless big macro risks show up unexpectedly.
I am willing to bet on a 60% chance of BTC landing in the $95,000–$110,000 zone by month’s end. That’s the most likely outcome based on current technical levels with support holding around $90k, and resistance being near $98,000. We are currently pressing right into the resistance level in mid-January. The remaining 40% I save for bearish outcomes, such as price dips if liquidity dries up or if negative news hits the market during earnings season.
Historical Bitcoin Performance in February
Looking back at Bitcoin’s February track record from 2017 to 2025 we have solid context for what might play out in February 2026. We’re taking real data points from past cycles including growth, corrections, and everything in between. February isn’t the best growth month like October or November, but it has consistently shown up as one of the more reliable positive performers.
February’s Seasonal Patterns
On average, February has shown a positive return historically, with numbers often reaching around +13-14% from 2010 onward, though specific 2017-2025 windows show a more reserved upward bias.
Adjusting for the shorter month factor, fewer trading days mean less time for big swings, the average February return lands around +5.2% in many datasets. It’s not explosive, but it’s steady green more often than not.
If we focus only on post-halving Februarys, like 2017 after the 2016 halving, 2021 after the 2020 halving, and 2025 after 2024, the picture gets even better. These months have averaged around +10%. Some months are showing much higher returns in select cycles, like 40% across a few halving-year Februarys due to momentum. Each halving’s supply shock keeps building demand, and by February, often 10-11 months in, bullish volatility tends to persist without full blown euphoria.
The Chinese New Year adds an interesting layer. The holiday starts late January/early February and has historically influenced liquidity, especially from Asian traders. Before the festivity begins we sometimes see dips or reduced volume as people cash out or step away from their terminals. Think short-term selling pressure.
After the holiday, Bitcoin has frequently rallied, with average gains of 10-20% in the surrounding window for many years (11 out of 12 recent Februarys are positive). It’s not a guaranteed pump, but the pattern leans toward recovery and upside after the holiday period.
Characteristics of February Volatility
February isn’t the calmest month, its intra-month volatility historically runs in the 12-15% range (measured as standard deviation of returns over the month). That’s actually a moderate figure for Bitcoin. It’s enough volatility to swing trade actively. Expect chop around key psychological levels, with pullbacks that often find buyers in bullish trends.
Another factor is Valentine’s Day week (mid-February) which often sees lower volume. Traders take breaks, liquidity thins out a bit, and moves can feel muted or exaggerated on this light liquidity. It’s rarely a major driver, but it can lead to tighter ranges or surprise candles if news hits.
In this cycle’s phase, it supports the case for gradual gains rather than fireworks. Remember, past patterns guide us as traders but don’t guarantee anything. The best strategy is to watch the tape and manage your positions according to current on-chain statistics and market sentiment.
Bitcoin Price Forecast for February 2026
We’re deep into the post-2024 halving cycle, where history shows momentum often steadies. Analysts are split on February’s valuation, but the overall vibe is cautiously bullish. No “to the moon” calls, but solid upside potential if support holds and capital continues to enter the market.
The expert community clusters into three camps, bullish, moderate, and conservative. Most forecasts reflect current technical levels, ETF dynamics, and macroeconomic events like potential rate cuts in Q2.
Bullish Forecasts
The optimists see February as the start of a real acceleration phase, building on carryover from ATHs and renewed institutional interest.
- Technical analyst from Blockchain.news: Targets $110,000 by month-end. The thesis? Q1 momentum ramps up as we break key resistance around $96,635, with bullish MACD signals and renewed ETF buying pushing a medium-term range toward $105k–$115k. He highlights proximity to resistance as a breakout setup, backed by consensus from major platforms.
- Institutional focused analyst CoinDCX: Forecasts $108,000. Argues the “institutional FOMO phase” kicks in during Q1, with corporate earnings reports, ETF inflows, and post-holiday liquidity sparking a psychological push higher. If we reclaim exponential moving average (EMA) levels cleanly, this becomes the floor for further gains.
These bullish calls assume that no major macroeconomic shocks rock the market.
Moderate Forecasts
The middle ground dominates the narrative right now, about half the forecasts land here, expecting grinding higher amid typical consolidation.
- Broad consensus from platforms like CoinCodex and LongForecast: Around $100,000. This hits the psychological level, with their average models pointing to $96k–$102k short-term before a steady climb. It’s grounded in neutral sentiment, Fear & Greed index being in fear territory, but with several bullish days supporting gradual upside.
- Cycle analyst perspective: $98,000. February is seen as a consolidation before the next leg up. Post-halving patterns have shown us we might digest volatility here, then build toward stronger moves later in Q1/Q2.
- Conservative momentum estimate, Changelly/Kraken: $96,000. Analysts from these companies outline Q1 continuation if we stay range-bound. They are factoring in shorter-month effects and moderate volatility without any big catalysts.
This group of analysts bets on steady progress. This means that support around $90,000 holds, resistance gets cracked slowly, and fundamentals quietly win out and take price higher.
Conservative Forecasts
The cautious voices warn of several bearish factors: profit-taking, thinner liquidity around Chinese New Year (Feb 17), and macro jitters.
- Models from DigitalCoinPrice and technical analysis breakdowns point towards $92,000. This is if we see profit-taking reach the support levels or we simply re-test it again if we fail to break higher. Watch out for potential dips on reduced volume or negative headlines.
Overall, February looks like a transition month. It has mostly been more grind than fireworks. The bulls have the edge if ETF flows and global adoption get stronger, but if you’re day trading, keep your stops tight. Volatility remains Bitcoin’s middle name. Watch and trade the technical levels, not the headlines.
Post-Halving Cycle for February 2026
February 2026 is month 22 after the April 19, 2024 halving. At this time we will be entering a phase of high-level consolidation, new price discovery, and structural rebalancing before an extended rally or cooldown will hit the price charts.
Historical Post-Halving Data for Month 22
Prior cycles had the following traits:
- The halving on July 9, 2016. During this cycle, month 22 was in May 2018, amid the bear market drawdown, prices had peaked late 2017, then lost over 50% as leveraged positions unwound. Eventually the key support levels held for a quick recalibration.
- The halving on May 11, 2020. The 22nd month was in March 2022, after the $69,000 all-time high. Then there was about a 40% correction during Fed rate hikes. Behind the scenes, we saw accumulation build quietly below higher support levels.
The common themes we can learn from here is to put emphasis on macroeconomic factors (interest rates, risk appetite) and positioning ourselves for the next multi-year setup. Gains aren’t always obvious, sideways grinds often hide net positives if measured from cycle lows. This is one reason why sometimes the best way to trade consolidations is to buy low and HODL.
February 2026 Halving Cycle
With slashed new supply sinking in, the supply dynamic now amplifies any ETF absorption and holder conviction, potentially extending upside if inflows persist beyond the normal retail volumes.
By month 22 after the 2020 slashing, February 2022 saw $38k-$45k ranges after the November peak. We saw consolidation amid uncertainty, and then growth on fresh news of global adoption.
Miner dynamics have evolved too and are worth keeping track of. With post-halving efficiency upgrades now complete, top operators hold BTC aggressively, reducing sell pressure and signaling network stability and optimism.
This marks February as a pivot point for traders. Q1 momentum could stay above $90k floors and press against resistance levels, setting up the price action as either a bullish cycle continuation (if institutions dominate the space) or a light correction.
The Impact of Earnings Season on Bitcoin’s Price
Earnings season for Q4 2025 starts in January and spills into February, often swaying market sentiment through corporate updates on crypto exposure. These reports could either reinforce upside momentum or trigger short-term dips if the numbers disappoint investors. What you want to watch out for here is announcements around treasuries, allocations, and expansions of crypto holdings as signals of broader adoption. Any bullish news in this regard is potentially bullish for BTC as institutions double down.
Corporate Bitcoin Announcements
Companies reporting Q4 2025 results might report fresh Bitcoin buys or holdings, building on last year’s adoption wave. For example, MicroStrategy’s earnings on February 4th will reveal their latest BTC acquisitions. Analysts eagerly expect updates on their massive stack (over 250,000 BTC), which could spark rallies if they show more aggressive buying.
Trends mirroring MicroStrategy’s treasury allocations are gaining popularity among tech firms as well. Block Inc. (SQ), reporting around February 20th, has integrated Bitcoin via Cash App and holds BTC reserves. If they have a strong quarter with increased crypto revenue it could boost market sentiment, especially if they reveal they are expanding their holdings.
Similarly, Tesla’s earning report on January 28th might echo into February. Any additions to their BTC treasury (currently around 10,000 coins) amid EV sales could fuel a positive sentiment. We have seen this before in past cycles when their corporate balance sheets turned sentiment pro-crypto.
Traditional Finance Earnings Reports
Big banks and asset managers report earnings early and set the tone for institutional flows into February.
Investment bank crypto desk expansions often make headlines. Goldman Sachs which reports January 15th and JPMorgan reporting around January 14th could show growth in their digital asset holdings. Be on the lookout for more trading desks or custody services, which historically correlate with BTC inflows if they show the world their bullish outlooks.
ETF provider marketing campaigns also ramp up post-earnings. BlackRock’s report is due on January 15th and might show iShares Bitcoin ETF performance of AUM potentially going over $50B by then. This will lead to aggressive advertising from them which could potentially draw additional retail and institutional money, increasing BTC prices in February.
Institutional allocation trend reports wrap up the earnings season in the U.S. Firms like Fidelity which have their earnings mid-February or Coinbase reporting on February 12th often share data on client shifts towards crypto. Any strong numbers here, like rising allocations from pensions or funds, could sustain Q1 momentum and push BTC toward the upper end of our forecasted range.
It’s also very important to read Coinbase’s report closely for exchange volumes and revenue. If they report better than analysts expect it can lift the entire sector. Overall, positive surprises could add 5-10% growth spurts, but misses might cap gains. Market sentiment hinges on these data points which will be confirming adoption or showing us a lack of growth.
Technical Analysis Price Targets
As of writing this, we’re testing higher levels after breaking out from consolidation, but momentum needs confirmation to push toward the range of $92,000–$110,000. Technicals lean bullish overall, with room for measured growth if the following zones hold.
Support Levels
Primary support levels are at $85,000 and $92,000. This zone has acted as a strong floor multiple times recently, overlapping with recent lows, the lower Bollinger Band (20), and Fibonacci retracements. Buyers have defended it aggressively, often pushing prices higher by 5-10% on tests.
BTC/USD 1 Day Chart
Fig. 1 – Daily Chart of BTC/USD on TradingView.com with Support and Resistance Levels
Below that, critical support lies around $80,000. Some bearish analysts forecast a January close in this area and classify it as a deeper pullback target. A break below this area would signal weakness and open the door to deeper corrections lower, but the current structure visible on the graph suggests it’s a last line of defense rather than an immediate threat.
Resistance Levels
First, the major glass roof is the psychological barrier between $98,000 and $100,000. Such a round number that often sparks profit-taking or FOMO buying. Clearing it cleanly and stabilizing above there would shift sentiment firmly bullish and attract more inflows.
Major resistance sits at $110,000, near projected medium-term targets from current momentum. This band has confirmation from Fibonacci extensions and is also a prior cycle high. A push here would validate stronger bullish continuation.
If momentum stays strong, it will look like volume spikes and clean breaks. The higher take profit targets sit around $120,000. Realistically, it’s more of a stretch goal requiring additional factors to come into play like increased institutional drive and optimistic economic statistics.
Key Technical Indicators
The CCI indicator (20) currently hovers around the 153-173 zone on the daily time frame, reflecting strong and slightly overbought momentum. This range supports healthy advances without immediate exhaustion. The CCI-based moving average is still pointing up meaning price can still rise before cooling off, this is a typical signal during uptrending phases.
MACD also shows us bullish signals at this time. Positive histogram, line above signal, and recent crossovers are all confirming an upside bias. No major bearish divergence can be seen yet, pointing to sustained move higher if volume on your exchange backs it up.
Volume analysis highlights accelerating institutional accumulation. Statistics from a 24-hour period often exceed $30B with organic buying profiles, not just speculative spikes. Rising volume on up days is a big bullish confirmation, and if you see dips with a volume drop on the sell-off, this is signaling to us absorption, rather than distribution.
The bottom line is that the chart patterns we currently see, favor gradual growth towards $100,000 and possibly higher. Watch for volume confirmation on any moves you see. Fakeouts do happen, but the tape looks positive from today’s trading session. Manage your risk around S&R levels, and remember, the trend is your friend until it isn’t.
February 2026 Fundamental Factors
February is going to be a month where the fundamentals quietly do most of the heavy lifting. Supply scarcity from the halving is already many years deep, so attention turns to what other factors can keep the train moving or throw sand into the gears.
Macroeconomic Environment
Macro remains the heavyweight champ. The Fed’s cautious stance after the December 2025 rate cuts has traders betting on one more quarter-point trim by summer 2026, but February itself looks quiet unless Powell drops a surprise hawkish comment or the latest inflation statistics scare everyone.
A “steady-as-she-goes” position would let risk assets breathe. Risk assets are stocks, commodities and crypto. Anything smelling of tighter policy could quickly remind us all that gravity still exists.
Regulatory Developments
Regulatory headlines have calmed since the President Trump crypto pump of 2025, but a couple of landmines still exist. Mid-month SEC rulings on pending staking ETFs would be a nice green light for institutions if they go through. On the global front, full MiCA enforcement in Europe is live and the G7 chatter about stablecoin rules finilizing is picking up steam.
Nothing revolutionary expected in February, but any talk of coordinated restriction tends to make traders twitchy for a day or two.
Network Fundamentals
Network stats are very impressive behind the scenes. Hashrate keeps grinding higher with next-gen hardware taking over. Active addresses are climbing in a boring but healthy way, and long-term HODLer conviction looks very strong. Exchange reserves stay pinned near historic lows, which means real selling pressure is currently minimal for when the market gets nervous.
Bitcoin dominance sits in the comfortable mid-50s zone, high enough to keep the king on the throne but with enough slack that a legitimate altcoin season could happen without sinking the ship.
Bitcoin Dominance Chart and Statistics

Fig. 2 – Bitcoin Dominance in Relation to Ethereum and Altcoins
If alts start running hard in February it might siphon some capital away from BTC, but in this more mature cycle that rotation could end up pulling fresh money into the crypto space overall instead of just shuffling the deck.
Risk Factors & Downside Scenario
February may look constructive on paper, but the markets love reminding us that nothing is free. Even in a mature bull cycle, downside risks never really disappear. The good news is most of them would need a real gut-punch catalyst to push Bitcoin meaningfully lower from current levels. The bad news is those catalysts can show up unexpectedly.
Potential Downside Catalysts
Profit-taking after January gains is the most apparent risk. If we see a nice 10-15% growth spurt at the start of the year, some early entrants and leveraged players will lock in gains around mid-February, especially with Chinese New Year thinning trading desks in Asia. That kind of normal rotation can snowball into a 10-12% pullback if it hits during the low-volume holiday weeks.
Macro recession indicators would be the heavier hitter. Right now leading signals are mixed but not screaming red. If January payrolls or ISM manufacturing data surprise to the downside hard, or if consumer confidence drops, risk-off flows could become the dominant narrative. Bitcoin usually gets treated like a high-beta tech stock in those moments, so a broader equity sell-off would drag it down along with everything else.
Regulatory uncertainty remains the wildcard nobody wants to touch. A surprise SEC enforcement action against a major exchange, or leaked details of harsher global stablecoin rules, could spark short-term panic selling. These events tend to fade fast once they hit, but the initial knee-jerk reaction could cut between 8-15%.
Bear Case for February
The realistic bear case lands Bitcoin in the $80,000 to $85,000 zone by the month’s end. That would represent a 15-20% drop from where we sit today, enough to test deeper technical support levels and shake out weak hands without breaking the overall cycle structure.
The probability of this sits around 12-15%. Getting there would require a genuine negative catalyst, not just market chop. It will take coordinated bad macro data plus a regulatory headline, or a major ETF outflow spike that spooks institutions. Without that combo, the path of least resistance stays sideways and higher. Position sizing should be conservative around these risks, because the market rarely gives second chances when it decides to teach a lesson.
Trading Strategies for Bitcoin
February 2026 gives us a shorter 28-day window, where every move can feel more amplified during the holidays. With the cycle already mature and momentum tapering, the playbook shifts toward disciplined entries, tight risk, and letting winners run when they show up. Here is how I would approach it as someone who has survived several of these cycles.
Make Entries Around Accumulation Zones
Long-term accumulation zones sit between $92,000 and $98,000. This area has proven to be sticky support multiple times already, with buyers stepping in aggressively on dips. If we see a pullback into that band, especially early in the month or around the Lunar New Year, it becomes a high probability spot to add your positions.
I would use the dollar-cost average technique in small chunks rather than going all-in at once. The goal here is owning more at levels that look cheap six months from now.
Short Term Trading Opportunities
Swing trading the broader range of $92,000 to $110,000 makes sense for short term traders. Buy near the lower end on confirmed bounces (higher lows, volume picks up), target the upper band and take partial profits around $105,000 to $108,000.
Use 4-hour or daily charts to spot momentum shifts. You want to avoid forcing any trades during thin holiday weeks when fakeouts love to happen.
Breakout trading above $100,000 carries real meaning if it happens cleanly. That psychological level has flipped from resistance to support in past cycles once but it needs to be confirmed with conviction.
What is conviction in this case? Wait for a strong close above the level on above-average volume, then use trailing stops below recent swing lows. The first profit target becomes $110,000 to $112,000. Aggressive traders can scale into trades on confirmation but keep the bulk of risk per trade small.
Risk Management
Risk management always gets extra attention when we are trading crypto short-term. Stops should be tighter than usual because time works against you if a trade goes bad. Never risk more than 1-1.5% of your account per trade, and keep your total active trade risk at 4-5% across all crypto positions. Finally, use volatility-based stops (using ATR multiples) instead of fixed points on a chart to avoid getting shaken out early.
Position sizing should stay conservative overall. Scale in on strength, scale out on weakness, and always leave dry powder for the inevitable surprise dip. February historically rewards patience and discipline over hero trades. Trade small to stay alive, and let the cycle do the work.
February vs. January Momentum Analysis
January sets the stage for what might happen in February, and if it closes on a high note, that energy often carries over. Historical patterns show that a solid January finish, for example wrapping up with gains of 5-10% from the month’s open, boosts February’s odds of following the same trajectory.
Back in 2021, January ended up 30%, and February added on another 36%, riding that wave. Similarly, 2023’s January bump of 39% led to a flat but stable February. It all comes down to sentiment, as a green close for the month reinforces buyer confidence, making pullbacks shallower and recoveries quicker as folks see the trend holding.
When it comes to continuation versus reversal, data leans heavily toward keeping the party going. Over the last decade, if January posts positive returns, February has matched or exceeded that direction about 70% of the time, based on monthly stats from sources like CoinGlass.
Reversal risks drop to around 20-25% unless a big external shock hits, like an unexpected rate hike or a black swan event. In post-halving environments scarcity keeps the narrative alive without needing constant headlines to support it.
Looking at the full Q1 trajectory, we’re likely on pace for hitting outlined targets if indicators align with historical chart patterns. Q1 has averaged 25-30% returns in bull cycles, so aiming for a collective push to $105k-$115k by March feels achievable.
Indicators of Momentum and Support & Resistance
Fig. 3 – BTCUSD Daily Chart With MACD and RSI Indicators Showing Bullish Signals. Tradingview.com
Momentum indicators give us the technical background check. The relative strength index (RSI), which gauges if an asset is overbought above 70 or oversold below 30 on a 0-100 scale, should hover in the 60-70 sweet spot for sustained strength without exhaustion.
Moving average convergence divergence (MACD), a trend following indicator that helps you visualise trend changes, points bullish with a positive line crossover and growing histogram.
Volume really seals the deal for us. You want to look for rising daily turnover on green days, signaling real conviction. It would be great to get a confirmation with volume averages climbing 10-20% a week to confirm the move. Remember, always trade the signals, not your assumptions.
Key events to watch out for include FOMC meeting minutes on February 18, which will reveal the Fed’s January discussions on rates and could sway risk appetite if they signal easier policy.
Bitcoin options expiry hits February 27, when contracts settle and can spark short term squeezes as positions unwind. Stay vigilant around these dates, they often dictate the week’s tone without much warning. Trading is all about adapting, so scale in smart and protect your portfolio.
Frequently Asked Questions About February 2026
To wrap up this analysis, here are answers to some common questions based on the data and cycle patterns discussed. This section provides concise insights and answers taken from historical trends, technical indicators, and fundamental drivers.
What is the Bitcoin price prediction for February 2026?
Expect Bitcoin between $92,000 and $110,000, with most experts calling $100,000 the sweet spot. This is based on the 22 month post-halving phase when supply tightens and Q1 capital from large players enters. Past Februarys in similar cycles averaged roughly +10%. The highest probability zone sits at 60% for $95,000 to $105,000 as the market transitions into a steady accumulation phase.
Will Bitcoin reach $100,000 in February?
The odds are around 65% to 70%, this is supported by cycle history and technical analysis. Month 22 after the halving often brings a consolidation with potential upside, similar to the +15% move seen in early 2020. Corporate earnings can act as a catalyst for growth, and a clean break above $100,000 opens a path toward $108,000 to $110,000 by the end of the month.
How might the Chinese New Year affect Bitcoin prices?
Chinese (Lunar) New Year falls on February 17 and often causes a brief dip ahead of the holiday due to lighter Asian trading and people cashing out to buy gifts. Historically, Bitcoin has rebounded 9% to 11% within ten days after the holiday as traders return. With global capital now dominating flows, the effect is usually a short-lived dip rather than a trend reversal.
What are the key support and resistance levels for Bitcoin?
Strong support sits at $90,000 to $92,000, this is an area that tends to result in quick bounces. A deeper downside buffer exists near $85,000 if volatility spikes. On the upside, $100,000 acts as psychological resistance, followed by a heavier ceiling at $108,000 to $110,000. A decisive break above that zone, supported by volume, could trigger a fast move toward $120,000.
Could Q1 earnings season move Bitcoin prices?
Yes, earnings can be a meaningful factor. MicroStrategy’s early February report is closely watched for balance sheet updates that often spark rallies, while Coinbase’s mid-February earnings provide insight into trading activity and overall sector health. Strong commentary from these firms, along with large banks showing more crypto exposure, could add a 5% to 10% upside.
What downside risks should be watched in February?
Profit-taking after a strong January could cause a 10% to 12% pullback. Weak macro data, such as disappointing jobs numbers, could trigger short-term risk-off behavior, while unexpected regulations from the SEC could cause temporary panic selloffs. The bearish scenario targets $80,000 to $85,000 with only a 12-15% probability, and would likely require multiple negative factors hitting at once.
What is a smart trading strategy for Bitcoin this February?
Long-term positioning should be done on dips between $92,000 and $98,000 using scaled entries. Range traders can work in the $92,000 to $110,000 zone by buying weakness and selling strength when volume spikes or declines. Breakout trades above $100,000 should only be taken with confirmation, this is the riskiest strategy. Keep your risk tight at around 1% per trade due to February’s fundamental factors.
Where Cycle Structure Meets Real Demand
Wrapping up this look at Bitcoin prices in February, the real gem here is how we are combining post halving with first quarter bullish energy to create an unmistakingly bullish setup, think of it as the market shifting from hype driven spikes to reliable grinds higher, much like we saw in past runs where scarcity finally overpowers the volatility.
One spot to keep your eyes glued to is that $100,000 mark, the big round number that acts like a mental barrier for most traders. Breaking it often encourages a wave of fresh money chasing the move, potentially adding 8-12% in a short amount of time if volume backs it up. For what’s ahead, our next deep dive will cover March 2026 predictions, building on this month’s base to spot if the momentum turns into spring adoption.
If you want more, check the full first quarter 2026 outlook for how February fits into the bigger picture, or grab the complete 2026 guide breaking down the whole year. Remember, trading is not about nailing every call, it is about stacking odds in your favor with solid rules and analysis. The market always has one more trick up its sleeve, but cycles like this reward those who play the long game.

Steve Gregory is a lawyer in the United States who specializes in licensing for cryptocurrency companies and products. Steve began his career as an attorney in 2015 but made the switch to working in cryptocurrency full time shortly after joining the original team at Gemini Trust Company, an early cryptocurrency exchange based in New York City. Steve then joined CEX.io and was able to launch their regulated US-based cryptocurrency. Steve then went on to become the CEO at currency.com when he ran for four years and was able to lead currency.com to being fully acquired in 2025.


