
Table of Contents
XRP Price Prediction 2027
What will XRP be worth in 2027?
A realistic 2027 XRP outlook is scenario-based, not a single number. This forecast compares base, bull and bear paths with key support/resistance zones and clear triggers that would confirm or invalidate each scenario during the year.
Last Updated: January 2027 (Initial 2027 forecast publication)
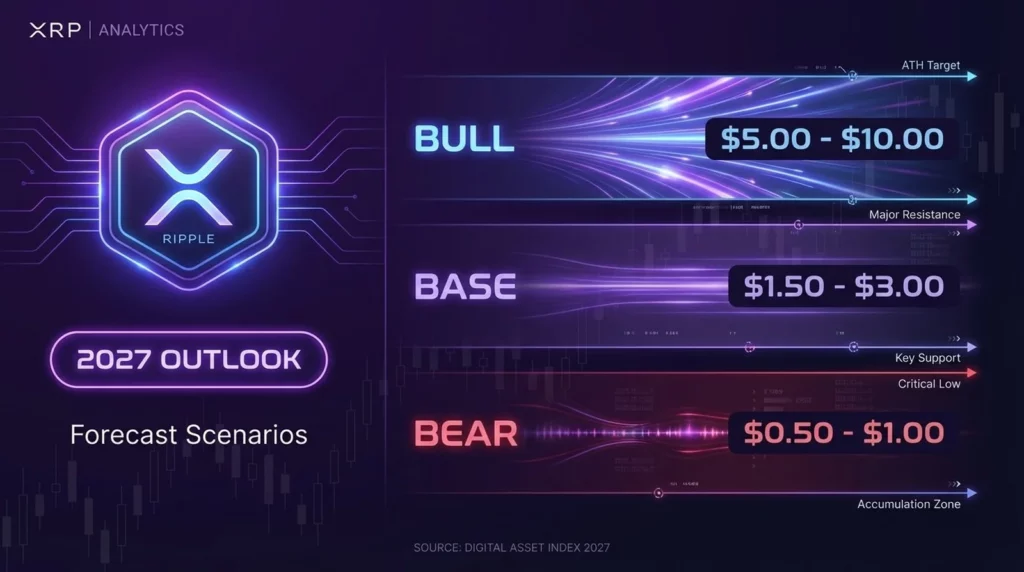
2027 Year at a Glance: XRP enters 2027 with established ETF products, full regulatory clarity post-settlement, and deepened institutional infrastructure. The base scenario ($4.00-$6.50) assumes continuation of the 2026 uptrend with periodic consolidations. The bull scenario ($6.50-$10.00) requires sustained BTC strength, expanding ETF flows, and accelerating Ripple adoption. The bear scenario ($2.50-$4.00) activates if crypto enters a risk-off regime, macro conditions deteriorate, or XRP-specific catalysts disappoint.
2027 Key Levels Snapshot:
- Major Support: $3.50-$4.00 zone (2026 breakout retest)
- Intermediate Support: $4.50-$5.00 zone (consolidation floor)
- Intermediate Resistance: $6.00-$6.50 zone (continuation trigger)
- Major Resistance: $8.00-$10.00 zone (bull target range)
- Annual Invalidation: Monthly close below $3.00 (base scenario fails)
Top 2027 Drivers:
- BTC Market Regime: $150K+ target expectations; post-halving continuation
- XRP ETF Flows: Institutional allocation cycles; AUM growth trajectory
- Ripple Ecosystem: ODL volume; XRPL DeFi growth; RLUSD adoption
- Liquidity Conditions: Stablecoin supply; market depth; leverage positioning
- Regulatory Environment: Post-settlement stability; continued policy clarity
- Macro Conditions: Rate environment; risk appetite; equity correlation
- Market Structure: Exchange depth; custody infrastructure; derivatives
- Competitive Positioning: Payments market share; cross-border settlement narrative
2027 Scenario Triggers:
| Scenario | Trigger | Confirmation | Invalidation |
| Base | Hold $4.00 support; BTC strength | Consolidation pattern; range trading | Monthly close <$3.50 or >$6.50 |
| Bull | Break $6.50 with volume; BTC $150K+ | Monthly close >$6.50; ETF inflows surge | Rejection below $6.00; risk-off regime |
| Bear | Break $3.50; macro risk-off; BTC <$80K | Monthly close <$3.50; outflow cycle | Reclaim $4.50; risk-on rotation |
Navigate: How we build scenarios | How key levels are selected | 2027 catalysts that change the outlook | XRP price prediction by year
XRP 2027 Forecast Summary (Base, Bull, Bear)
| Scenario | Range | Assumptions | Triggers | Confirmation | Invalidation |
| Base | $4.00-$6.50 | BTC strength; ETF steady; adoption continues | Hold $4.00 | Range consolidation | Break S/R |
| Bull | $6.50-$10.00 | BTC $150K+; ETF surge; XRPL expansion | Break $6.50 | Monthly >$6.50 | Fail at $6.50 |
| Bear | $2.50-$4.00 | Crypto risk-off; macro deterioration | Break $3.50 | Monthly <$3.50 | Reclaim $4.50 |
Base Scenario (Most Likely Path) — Range + Assumptions
The base scenario ($4.00-$6.50) assumes XRP continues its 2026 trajectory with periodic consolidations. Key assumptions: BTC maintains strength and trends toward $150K+ targets, XRP ETF products see steady (not explosive) inflows, Ripple ecosystem adoption continues incrementally, and regulatory environment remains stable. This path features consolidation phases, measured breakouts, and volatility around catalyst windows. Probability: ~50%.
Bull Scenario — What Expands Upside Probability
The bull scenario ($6.50-$10.00) requires multiple positive catalysts converging: BTC continuation above $150K driving broad crypto momentum, XRP ETF inflows accelerating significantly, major Ripple partnership or XRPL adoption milestone, and risk-on macro environment persisting. Confirmation requires a monthly close above $6.50 with sustained volume. The $8.00-$10.00 zone represents the upper extension if all factors align. Probability: ~25%.
Bear Scenario — What Increases Downside Probability
The bear scenario ($2.50-$4.00) activates if the crypto market enters a risk-off regime. Drivers include: BTC breakdown below $80K triggering broad deleveraging, macro recession or liquidity crisis, XRP-specific disappointment (ETF outflows, adoption slowdown), or unexpected regulatory friction. Confirmation requires a monthly close below $3.50. The $2.50-$3.00 zone represents the floor in this scenario. Probability: ~25%.
Volatility Regime Note (Range Width Drivers)
| Regime | Expected Volatility | Range Behavior | Common Catalyst Types |
| Low Vol | 25-40% annualized | Tight consolidation; tighter ranges | Quiet macro; stable BTC; balanced positioning |
| Medium Vol | 40-60% annualized | Trending within range; breakout watch | Normal catalysts; moderate flows |
| High Vol | 60-100%+ annualized | Wide swings; scenario switching | Major macro; BTC regime shift; liquidations |
2027 will likely experience all three regimes at different periods. Expect low volatility during consolidations, medium volatility during trending phases, and high volatility around major catalyst windows (FOMC shifts, BTC key levels, XRP-specific headlines). For liquidity analysis, see the sentiment and liquidity hub.
Key Levels for 2027 (Support, Resistance, Invalidation)
| Zone | Type | Rationale | Confirmation | Failure Signal |
| $3.50-$4.00 | Major Support | 2026 breakout zone; structural floor | Monthly bounce | Monthly close <$3.50 |
| $4.50-$5.00 | Intermediate Support | Consolidation floor; accumulation zone | Weekly bounce | Weekly close <$4.50 |
| $6.00-$6.50 | Intermediate Resistance | Bull trigger; continuation gate | Monthly close >$6.50 | Rejection + close <$6.00 |
| $8.00-$10.00 | Major Resistance | Bull extension target; psychological | Monthly close >$8.00 | Sharp rejection |
| $3.00 | Invalidation | Base scenario fails below this level | N/A | Monthly close <$3.00 |
Macro Support Zones (Why They Matter, What Confirms)
The $3.50-$4.00 zone represents the 2026 breakout level—where XRP transitioned from 2024-2025 consolidation into its 2026 uptrend. This zone carries structural significance; a monthly close below would signal a failed breakout and shift to the bear scenario. The $4.50-$5.00 zone is the intermediate floor for consolidation phases; weekly bounces from this zone confirm the base scenario. For level methodology, see the technical analysis hub.
Macro Resistance Zones (Breakout Confirmation)
The $6.00-$6.50 zone is the continuation gate—a confirmed break above triggers the bull scenario. Confirmation requires a monthly close above $6.50 with volume expansion. The $8.00-$10.00 zone is the bull extension target, representing the upper bound if multiple positive catalysts converge. Psychological resistance at $10.00 may require significant momentum to breach.
Scenario Invalidation Rules (When the Base Case Is Wrong)
The base scenario invalidates on a monthly close below $3.00. This level represents a structural failure where the 2026 gains would be largely erased. If invalidation occurs, the bear scenario becomes the new base with $2.50-$3.00 as the operating range. Conversely, a monthly close above $6.50 shifts to the bull scenario as the new base.
What Changes a 2027 Forecast? (Driver Map)
| Driver | Metric to Watch | Threshold Idea | Why It Matters |
| BTC Regime | BTC price; BTC dominance | $150K+ bull; <$80K bear | Sets overall crypto risk regime |
| ETF Flows | Daily/weekly net flows; AUM | +$100M/week bullish | Institutional demand signal |
| Ripple Adoption | ODL volume; XRPL activity | Consistent QoQ growth | Utility/fundamental support |
| Leverage/OI | Open interest; funding rates | Extremes = squeeze risk | Volatility regime indicator |
| Macro Conditions | Fed policy; risk appetite | Cutting cycle = supportive | Affects broad risk sentiment |
| Regulation | Policy statements; enforcement | Stable = neutral; new action = caution | Risk premium component |
Crypto Market Regime (BTC Dominance, Liquidity Cycles)
Bitcoin defines the crypto market regime. BTC trending toward $150K+ supports XRP’s bull scenario; BTC weakness below $80K pressures XRP toward the bear scenario. BTC dominance cycling lower (typically in alt season phases) can boost XRP outperformance. Watch for post-halving cycle dynamics expected to play out through 2027.
Liquidity & Leverage (Spreads, OI, Funding, Liquidations)
Liquidity depth and leverage positioning determine volatility regimes. Stablecoin supply growth supports risk-on environments; contraction creates headwinds. Elevated OI with extreme funding creates squeeze risk. Monitor liquidation clusters for potential cascade zones. For positioning analysis, see the sentiment and liquidity hub.
Market Access (ETF, Exchange/Custody Availability)
XRP ETF products established in 2026 now provide institutional access channels. ETF flow data becomes a key metric—sustained inflows support the base/bull scenarios; outflows would pressure price. Continued expansion of exchange listings and custody solutions improves market depth. For ETF tracking, see the XRP ETF hub.
Regulation/Legal Clarity (Risk Premium)
The post-settlement regulatory environment is stable entering 2027. The risk premium from regulatory uncertainty has largely compressed. However, new enforcement actions or policy shifts could reintroduce uncertainty. Monitor for policy statements that contradict the Torres ruling or affect broader crypto classification. For legal tracking, see the SEC lawsuit impact hub.
XRPL/Ripple Ecosystem Adoption Signals (Utility)
Ripple’s ODL (On-Demand Liquidity) volume, XRPL DeFi activity, and RLUSD stablecoin adoption provide fundamental support. Consistent quarter-over-quarter growth in these metrics strengthens the base/bull cases. Stagnation or decline would pressure the fundamental narrative. For ecosystem analysis, see the fundamentals hub.
Monitoring Framework (How to Track 2027 Progress)
Monthly Checkpoints (What to Review)
At month-end, review:
- Price vs key levels: Where does XRP sit relative to $4.00/$6.50 thresholds?
- BTC regime: Is BTC on track for $150K+ or showing weakness?
- ETF flows: Net positive or negative for the month?
- Ripple metrics: ODL volume trend; XRPL activity levels
- Volatility regime: Low/medium/high? What does it imply for ranges?
Monthly updates document these checkpoints. See the latest: XRP Monthly Update January 2026
Weekly Triggers (What Changes Probabilities Fast)
Probabilities can shift quickly on:
- Key level breaks: Weekly closes below $4.00 or above $6.50
- BTC regime shifts: Major BTC breakout or breakdown
- Major catalysts: FOMC surprises, macro shocks, XRP headlines
- Leverage extremes: OI/funding reaching levels that trigger squeezes
For weekly-level tracking, see: This week XRP outlook | Next week XRP scenarios
2027 Scenarios in Practice (Examples)
Scenario Switching (Trigger → Confirmation → Invalidation)
Example: Base to Bull Switch
- Trigger: XRP breaks above $6.50 on weekly close
- Confirmation: Monthly close above $6.50 with ETF inflows accelerating
- Invalidation: Rejection back below $6.00 on the retest
Example: Base to Bear Switch
- Trigger: XRP breaks below $3.50 on weekly close + BTC weakness
- Confirmation: Monthly close below $3.50 with ETF outflows
- Invalidation: Reclaim $4.50 with strength on risk-on rotation
Risk Management Notes (Range Planning vs Point Targets)
Year-level forecasts work best as ranges rather than point targets. The base case ($4.00-$6.50) is a range to plan around, not a prediction that XRP will hit exactly $5.25. Plan for volatility windows (high-vol regimes can see 50%+ swings). Use weekly and monthly updates to refine shorter-term positioning within the year framework.
Related Forecasts
2026, 2028, 2030 Year Hubs
XRP Price Prediction 2026 | XRP Price Prediction 2028 | XRP Price Prediction 2030 | XRP price prediction by year
‘This Week’, ‘Next Week’, ‘Next Month’, Monthly Updates
This week XRP outlook | Next week scenarios | Next month forecast | XRP price prediction
Frequently Asked Questions
What is the XRP price prediction for 2027?
The 2027 XRP forecast uses scenario ranges: Base $4.00-$6.50 (~50% probability) assumes continued 2026 momentum with consolidations. Bull $6.50-$10.00 (~25%) requires BTC strength, ETF surges, and adoption acceleration. Bear $2.50-$4.00 (~25%) activates on risk-off regime shifts. Each scenario has specific triggers, confirmations, and invalidations.
What are the key support and resistance levels to watch in 2027?
Major support: $3.50-$4.00 zone (2026 breakout retest). Intermediate support: $4.50-$5.00 zone (consolidation floor). Intermediate resistance: $6.00-$6.50 zone (bull trigger). Major resistance: $8.00-$10.00 zone (bull extension). Annual invalidation: monthly close below $3.00.
What would make the 2027 XRP forecast turn bullish?
The bull scenario ($6.50-$10.00) activates on: BTC continuation above $150K, XRP ETF inflows accelerating significantly, major Ripple adoption milestone (partnership/ODL growth), risk-on macro environment persisting. Confirmation requires a monthly close above $6.50 with sustained volume and positive ETF flow data.
What would invalidate the 2027 base scenario?
The base scenario ($4.00-$6.50) invalidates on a monthly close below $3.00—this would signal structural failure of the 2026 uptrend. Drivers for invalidation include: BTC breakdown below $80K, macro recession/liquidity crisis, XRP-specific disappointment (ETF outflows, adoption reversal). The bear scenario ($2.50-$4.00) becomes the new base if invalidation triggers.
How do ETF and legal developments affect XRP’s 2027 outlook?
ETF flows are a key institutional demand signal—sustained inflows support base/bull scenarios; outflows would pressure price. Legal environment is stable post-settlement; new enforcement actions would reintroduce uncertainty. ETF AUM growth and flow trends provide measurable data to track. These factors affect risk premium and market access rather than fundamental value.
How do liquidity and leverage conditions change year-long forecasts?
Liquidity depth determines how easily price can move—deep liquidity supports tighter ranges and cleaner trends. Elevated leverage (high OI + extreme funding) increases squeeze risk and can trigger sharp reversals or cascades. These conditions affect the volatility regime (low/medium/high) and therefore expected range widths throughout the year.
Why do different sites have very different XRP 2027 predictions?
Assumptions differ: cycle timing, adoption expectations, valuation methods, and risk frameworks. Some sites use single point targets; we use scenario ranges. Compare sources by whether they: (1) state assumptions clearly, (2) provide scenario logic, (3) explain triggers/invalidations, and (4) describe what evidence would change the forecast.
How often should a 2027 XRP forecast be updated?
Update when material conditions change: major level breaks, volatility regime shifts, significant catalyst events, or trend reversals that affect scenario probabilities. At minimum, refresh quarterly. Weekly and monthly updates document shorter-term changes that may eventually affect year-level scenarios.
Where can I compare 2026 vs 2027 vs 2028 forecasts?
Use the XRP Price Prediction by Year hub to compare scenarios side-by-side. Each year page follows identical structure for easy comparison. Navigate between years using the links in the Related Forecasts section above.
Update Log (2027)
| Date | Update Notes |
| January 2027 | Initial 2027 forecast published. Base: $4.00-$6.50. Bull: $6.50-$10.00. Bear: $2.50-$4.00. |
This update log tracks material changes to 2027 assumptions, levels, and scenario probabilities. Updates occur when: key levels break, volatility regime shifts, or catalysts materially affect the outlook.

Steve Gregory is a lawyer in the United States who specializes in licensing for cryptocurrency companies and products. Steve began his career as an attorney in 2015 but made the switch to working in cryptocurrency full time shortly after joining the original team at Gemini Trust Company, an early cryptocurrency exchange based in New York City. Steve then joined CEX.io and was able to launch their regulated US-based cryptocurrency. Steve then went on to become the CEO at currency.com when he ran for four years and was able to lead currency.com to being fully acquired in 2025.


