Ever wondered what’s happening behind the price you see on your screen? That single number is just the tip of the iceberg. Market depth gives you a live, real-time look at all the buy and sell orders for an asset, organized by price. It’s like getting a transparent view of the real supply and demand for a stock or cryptocurrency.
Understanding the Auction Behind Every Price
Think of the market as a massive, fast-paced auction house. On one side, you have buyers shouting out prices they’re willing to pay (bids). On the other, you have sellers yelling out the prices they’re willing to accept (asks).
Market depth is the ultimate cheat sheet for this auction. It gives you a perfectly organized list of every single one of those shouts, updated in the blink of an eye.
This list, known in the trading world as the order book, doesn’t just show you the best offers. It shows you the entire stack of orders waiting to be filled at different price levels. This is how you get a true picture of an asset's liquidity and see where the immediate supply and demand pressures are building.
The Key Components of Market Depth
To really get what market depth is all about, you need to know the moving parts. Let’s break down the essential pieces that come together to paint the full picture of the market's mood.
To give you a quick reference, here’s a breakdown of the core elements you’ll find in any order book.
| Key Components of Market Depth Data | ||
|---|---|---|
| Component | What It Represents | Why It's Important |
| Bids | Buy orders from traders who want to purchase at a specific price or lower. | Shows where the demand is. A long list of strong bids suggests high buyer interest. |
| Asks | Sell orders from traders who want to sell at a specific price or higher. | Shows where the supply is. A large volume of asks indicates significant selling pressure. |
| Price Levels | The specific prices where buyers and sellers have placed their orders. | Reveals key price points where traders are congregating to either buy or sell. |
| Order Size (Volume) | The number of shares, contracts, or coins being offered at each price level. | Helps you gauge the strength of support or resistance at different prices. |
Understanding what these components mean in a live market is what separates guessing from an informed trade.
For example, in a highly liquid market like Apple Inc. (AAPL), the order book might show 100,000 shares being bid for at $170.50. At the same time, you could see 120,000 shares available for sale at $170.75. This detailed view tells you a lot more about market sentiment than just the last traded price.
By analyzing the size and price of these orders, traders can gauge where the price might be headed next. A massive wall of buy orders, for example, can act as a temporary price floor, known as support.
Getting these fundamentals down is your first step. Before we dive deeper into reading order books and depth charts, it’s worth sharpening your skills. Explore the educational resources available in the VTrader Academy at https://www.vtrader.io/en-us/academy to master these essential trading concepts.
Decoding the Order Book: Bids, Asks, and Spreads
To really get market depth, you first have to understand the two forces that give every market its pulse: the buyers (bids) and the sellers (asks). These two sides of the order book are constantly telling a story about supply and demand.
The bid side is simply a list of all the buy orders. It shows you who wants to buy an asset, the exact prices they’re willing to pay, and how much they want to buy at each price level. Think of it as a live ranking of demand. The very top of this list is the highest bid—the absolute most any buyer is offering right now.
On the flip side, you have the ask side, which is a list of all the sell orders. This is your window into the available supply, showing the prices that current owners are willing to sell for and the quantity available at each price. The lowest price here is called the lowest ask (or "best ask"), and it's the cheapest you can get that asset for at this very moment.
Understanding the Bid-Ask Spread
That little gap between the highest bid and the lowest ask is one of the most critical metrics in trading: the bid-ask spread. This isn't just empty space; it's a direct signal of an asset's liquidity and what your immediate transaction costs will be.
The bid-ask spread is the difference between the highest price a buyer is willing to pay and the lowest price a seller is willing to accept. A narrow spread usually means high liquidity, while a wide spread suggests the opposite.
Let’s say an asset's highest bid is $100.00, and its lowest ask is $100.05. The spread here is just five cents. This "tight" spread tells you the market is humming with activity, with lots of buyers and sellers who are pretty close to agreeing on a price. Getting a trade done here is fast and cheap.
Now, picture another asset with a highest bid of $50.00 and a lowest ask of $50.75. That’s a $0.75 spread. This "wide" spread signals a much less liquid market. Fewer people are trading, creating a bigger gap between what buyers will pay and what sellers demand, which makes your trades more expensive.
What the Spread Tells You
The spread is so much more than a number—it’s a real-time health check on the market and a clue into trader sentiment. Paying attention to it helps you make much smarter moves.
- Liquidity Gauge: A consistently tight spread, like what you’ll find for major assets on the vTrader platform, is a great sign of high liquidity. It means you can likely execute larger orders without causing a major price swing.
- Volatility Indicator: Watch what happens to the spread during big news events. It often widens dramatically as traders and market makers pull back their orders, signaling that risk and uncertainty are on the rise.
- Transaction Cost: At its core, the spread is the cost you pay for making a trade right now. If you were to buy at the ask price and immediately sell at the bid price, the spread is exactly how much you'd lose.
Once you learn to read these elements, that wall of numbers on the screen transforms into a clear picture of market dynamics. You can see these concepts play out live by checking out the real-time order book for major cryptocurrencies like Bitcoin.
How to Read a Market Depth Chart
While an order book gives you a raw list of numbers, a market depth chart tells a visual story. It’s a powerful, at-a-glance snapshot of supply and demand that helps you instantly gauge market sentiment. If you really want to understand what is market depth, learning to read this chart is non-negotiable.
Most trading platforms show the depth chart with two sides, usually green and red. The green side represents all the buy orders (the bids), while the red side is all the sell orders (the asks). Think of it like a tug-of-war: price is on the horizontal axis, and the cumulative volume of orders is on the vertical axis.
This visual setup makes it incredibly easy to see where the real buying and selling pressure is hiding. The infographic below breaks down how bids and asks create the two sides of the market, with the spread being the no-man's-land in between.
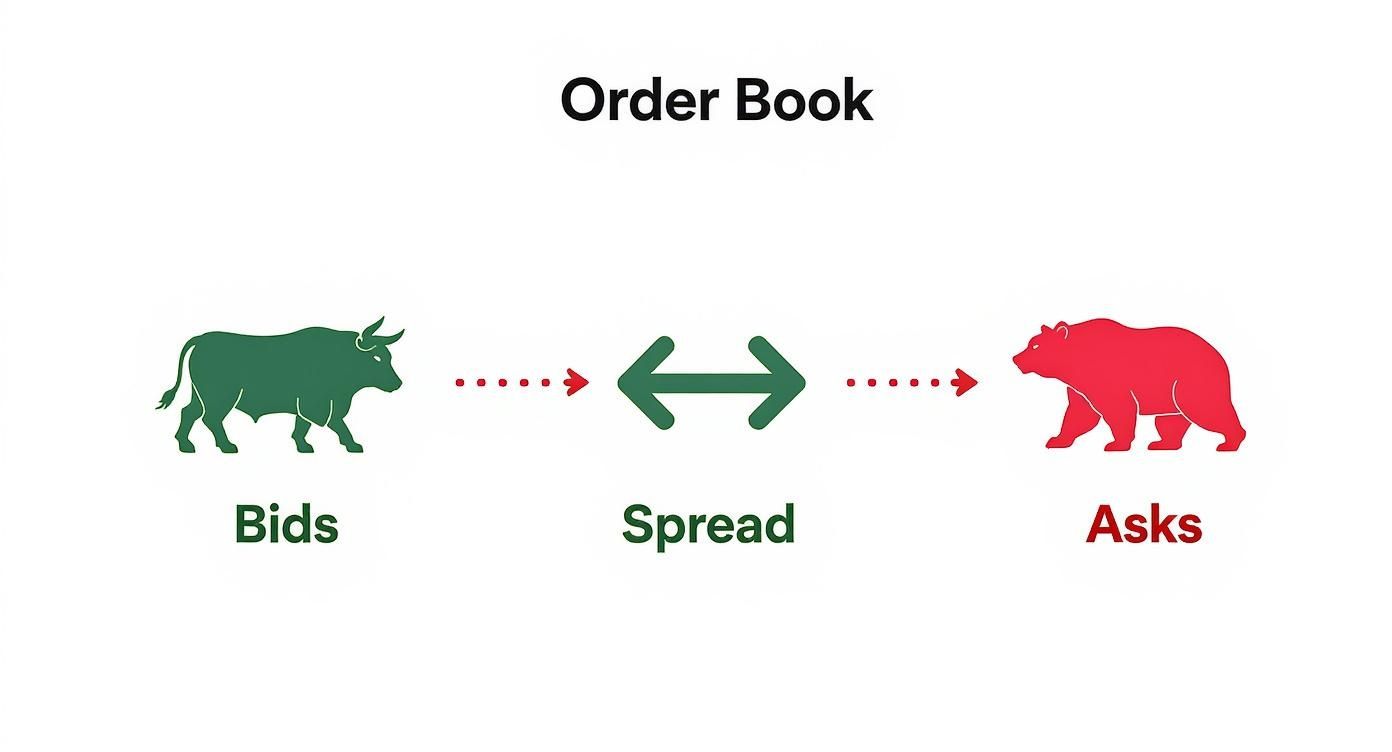
You can see the bullish interest (bids) stacked on one side and the bearish pressure (asks) on the other. That gap in the middle—the spread—is where all the action happens.
Identifying Buy and Sell Walls
One of the most valuable tricks you can learn from a depth chart is spotting "buy walls" and "sell walls." These aren't just regular orders; they're massive clusters of orders at a specific price, showing up as huge cliffs or "walls" on the chart.
A buy wall looks like a giant green mountain. It signals immense demand at a certain price, creating a strong support level. Prices will have a tough time falling below this point because a horde of buyers is ready and waiting to jump in.
On the flip side, a sell wall—a massive red mountain—tells you there’s a huge supply of the asset for sale at that price. This creates a resistance level, and the price will have to chew through all those sell orders before it can climb any higher.
The shape of the depth chart is a huge tell. If the green side is noticeably larger and steeper than the red, it’s a strong hint that buyers are getting aggressive and might be taking control of the market.
This visual shortcut gives you a real edge. You’re not just looking at the current price; you’re seeing the forces that will likely dictate the next big move. To see this play out live, you can explore crypto charts on vTrader and watch as these walls build up and break down in real-time.
Why Market Depth Is Your Secret Weapon
Knowing the parts of a market depth chart is one thing. Actually using that insight to get ahead is where the real money is made. Stop thinking of it as just a chart—it's a live look into the market's real intentions and health. For a serious trader, this isn't just data; it's the closest thing you’ll get to a crystal ball.
See What Others Can't: A True Liquidity Gauge
Its most critical job? Measuring liquidity. Let’s say you need to place a large order. A normal price chart gives you zero clues about whether there are enough buyers or sellers ready to fill it. If there aren't, you’ll get hit with slippage, which is a fancy way of saying the price will move against you before your order is even filled.
Market depth cuts through that uncertainty. It shows you the exact volume stacked up at every single price point, so you know instantly if the market can handle your trade without causing a ripple.
Uncovering the Market's Hidden Game Plan
Beyond just liquidity, the order book exposes moves that are totally invisible on a standard chart. Those "buy walls" and "sell walls" we talked about are a prime example. These massive stacks of orders often act as powerful, if temporary, support and resistance levels.
By watching how these walls build up and react when the price gets close, you can start to anticipate turning points before they actually happen. If a giant buy wall holds strong against a wave of selling, that’s a clear sign of solid demand. But if it vanishes into thin air? That could mean the big players were bluffing to manipulate sentiment.
Market depth is all about looking forward. Price charts tell you where the market has been. The order book shows you where it’s likely to run into trouble or find support next.
The Real Edge Over Most Traders
This ability to see what's coming gives you a massive advantage. The average retail trader is glued to historical price action and indicators that are, by definition, lagging behind. When you add order flow analysis to your toolkit, you’re watching the raw forces of supply and demand that actually push the price around.
It all comes down to liquidity. In super active markets, the depth is staggering. The global forex market, for example, trades over $7.5 trillion a day. Here, the biggest currency pairs can absorb trades over $100 million with barely any slippage.
On the flip side, a less liquid altcoin might only have a few thousand dollars' worth of orders on the books. You can learn more about how this impacts global finance from the Bank for International Settlements. This is the difference between reacting to old news and trading based on what's happening right now.
Navigating Volatility and Hidden Orders
Think of the order book not as a static list of numbers, but as a living, breathing thing. It shifts constantly with market sentiment. During quiet times, it might look predictable. But when major news hits or something unexpected happens, liquidity can dry up in a heartbeat, leading to wild and sudden price swings.
This is the chaotic reality of the market, and understanding it is key to managing your risk. Market depth is a real-time mirror of trader sentiment. Take the infamous May 6, 2010 flash crash. In the panic, market depth simply vanished as trading algorithms pulled their orders. Post-crash analysis revealed that the number of available shares at key price levels dropped by over 90%. Spreads blew out tenfold, and the market descended into chaos.
That sudden disappearance of liquidity is a massive risk for any trader. To stay ahead of the events that can trigger this kind of volatility, it's a good idea to keep an eye on our market news and analysis.
The Big Players and Their Hidden Tactics
While most orders are out in the open, the big institutional players have a few tricks up their sleeves to hide their true intentions. They know that dropping a massive buy or sell order on the book would send everyone running for the hills, so they get creative.
Understanding these hidden order types is like learning to spot a poker bluff. It helps you see beyond the surface-level data and recognize the more subtle games being played in the market.
Here are two common tactics you need to know about:
- Iceberg Orders: This is a classic move. A huge order is broken into dozens of smaller pieces. Only the "tip of the iceberg" is visible on the order book at any given time. As soon as one small piece is filled, the next one automatically takes its place. This masks the true size of the position until the entire order is executed.
- Spoofing: This one is both deceptive and illegal. A trader places a large order they have no intention of ever letting fill. The goal is to create a fake impression of supply or demand, baiting other traders into making a move. Once the market reacts, the spoofer cancels their fake order and trades in the opposite direction, profiting from the price they just manipulated.
By seeing how quickly liquidity can evaporate and how the big fish hide their moves, you get a much more realistic picture of market risk. It changes your understanding of what is market depth from a simple supply-and-demand chart to a complex psychological battleground.
Putting Your Market Depth Knowledge Into Practice
Okay, theory is one thing, but making it work for you is what really matters. Knowing what market depth is shifts your perspective from just watching price tickers to actually seeing the forces pushing them around. You're no longer in the dark.
The good news is that the vTrader platform puts these pro-level tools right on your dashboard. For any asset you're watching, the live order book and depth chart are right there next to the price chart. This gives you a seamless way to connect historical price action with the live supply and demand happening right now.
Turning Data Into Decisions
The trick is to make checking the market depth a non-negotiable part of your pre-trade routine. Before you even think about hitting that buy or sell button, take a moment to look under the hood.
- Look for Imbalances: Is the buy-side (green) stacked way higher than the sell-side (red)? That’s often a sign of bullish sentiment building up.
- Spot the Walls: See those huge orders sitting at a specific price? Those are the buy or sell walls that can act as short-term support or resistance. Knowing where they are helps you place smarter entry and exit points instead of just guessing.
- Gauge the Liquidity: If you’re planning a larger trade, you need to know if there’s enough volume to fill your order without causing slippage. A quick glance at the depth chart tells you exactly that.
When you combine market depth analysis with your own trading strategy, you stop reacting to the market and start anticipating it. You’re not just trading the price; you’re trading the underlying structure of the market itself.
This approach gives you a much clearer picture of potential risks and opportunities. And if you want to see how liquidity directly impacts your bottom line, check out our guide on vTrader's fee structure.
Frequently Asked Questions About Market Depth
Even after you get the hang of market depth, a few common questions always seem to pop up. Let's tackle them head-on to clear up any confusion and get you trading with more confidence.
What Is The Difference Between Level 1 And Level 2 Data?
Both show you order book data, but the difference is like seeing a single tree versus the entire forest. It's a game-changer.
Level 1 data gives you the most basic view: just the highest bid and lowest ask prices. It's the surface. Level 2 data, on the other hand, is what market depth is all about—it shows you the entire stack of buy and sell orders at different price points.
This is where you spot the hidden walls of buy orders and sell orders that Level 1 completely misses. It’s how you start to see where the real supply and demand are hiding.
Does Market Depth Work For Crypto And Forex?
Absolutely. Market depth isn't just for stocks. It's a core concept for any market that runs on an order book, and that includes both crypto and forex. The principles are exactly the same.
For huge markets like the EUR/USD pair or major cryptocurrencies like Bitcoin, you'll see massive depth. This means you can execute large trades without moving the price much. But for smaller altcoins or less common currency pairs, the depth might be "thin." That's just as important to know—it’s a clear signal that the market is more prone to volatility and slippage on big orders.
Can I Rely On Market Depth Alone To Make Trades?
Let’s be clear: there's no magic bullet in trading, and market depth is no exception. It’s an incredibly powerful tool for seeing short-term liquidity and potential price barriers, but it should never be your only tool.
Market depth gives you amazing context, but it doesn't tell the whole story. The best traders weave it into a bigger strategy. Think of it as one piece of a puzzle.
- Technical Analysis: Use charts and indicators to see the bigger trend.
- Fundamental Analysis: Know what's driving the asset’s value—news, tech, etc.
- Price Action: Watch how the price actually reacts when it hits those big walls you see on the depth chart.
When you combine market depth with these other forms of analysis, you stop just looking at data and start building a real strategic edge.
Ready to see the market like never before? On vTrader, you can access real-time market depth charts and order books for over 30 cryptocurrencies with zero commission fees. Sign up today and claim your $10 bonus.

Steve Gregory is a lawyer in the United States who specializes in licensing for cryptocurrency companies and products. Steve began his career as an attorney in 2015 but made the switch to working in cryptocurrency full time shortly after joining the original team at Gemini Trust Company, an early cryptocurrency exchange based in New York City. Steve then joined CEX.io and was able to launch their regulated US-based cryptocurrency. Steve then went on to become the CEO at currency.com when he ran for four years and was able to lead currency.com to being fully acquired in 2025.