At its core, a crypto market analysis tool is simply software designed to help traders make sense of all the noise. These platforms take incredibly complex data, from price charts to on-chain activity, and translate it into insights you can actually use. In a market this fierce, that translation is your biggest edge.
Why You Need a Compass in the Crypto Maze
Trying to navigate the crypto market without the right tools is like walking into a labyrinth blindfolded. You might get lucky, but more often than not, you'll hit a dead end. Trading on a gut feeling or a tip from social media isn't a strategy—it's a gamble.
This is where proper analysis tools come in. They act as your compass, cutting through the confusing static and turning it into clear signals. Suddenly, you're not just guessing anymore; you're trading with a plan. Think of them less as software and more as a command center for your entire trading journey.
The Growing Need for Better Tools
As the crypto market expands, so does the need for sharp, reliable analysis. The entire crypto space was valued at a staggering USD 910.3 million in 2021 and is on track to hit USD 1,902.5 million by 2028. This boom, fueled by everything from DeFi to big-money institutional interest, is making the market more volatile and complex than ever.
In a market this competitive, having the right analysis isn't just helpful—it’s the fundamental advantage that separates a calculated strategy from a costly gamble.
With the right setup, you can start to:
- Spot emerging trends long before they hit the mainstream news cycle.
- Manage your risk by identifying potential dips or assets that are getting overheated.
- Uncover hidden opportunities by digging into data that most other traders completely miss.
This guide will walk you through the essential tools of the trade, from on-chain analytics that read the blockchain's public diary to technical indicators that decode chart patterns. We’ll also look at how all-in-one platforms like vTrader bring these functions together, giving you the power to make smarter, more confident moves. For all the latest market news and deep dives, be sure to check out the vTrader news section.
Understanding the Different Types of Analysis Tools
Trying to navigate the crypto market with just one tool is like trying to fly a plane with only a compass. You might know which way you're headed, but you're missing the full picture. A good pilot uses radar, weather forecasts, and GPS to make smart decisions, and a good crypto trader needs a similar variety of tools. Knowing which one to pull out of your toolkit—and when—is the key to building a solid trading strategy.
The crypto market is growing fast, and with it, the importance of both hardware and software analysis tools. Right now, it's the exchange software—platforms for market analysis, trading interfaces, and all the analytics that come with them—that holds the biggest piece of the pie. Big names like CoinMarketCap, CoinGecko, and TradingView are essential for everything from simple price tracking to digging into social sentiment.
H3: Technical Analysis Platforms
Think of technical analysis platforms as the chart wizards of the crypto world. These tools, with TradingView being a fan favorite, are laser-focused on just two things: price action and trading volume. The whole idea is that you can predict where the price is headed by studying where it's been.
Traders live on these platforms, hunting for patterns, trends, and those all-important support and resistance levels. It’s a bit like a meteorologist studying weather charts to predict a coming storm. If you’re a day trader or a swing trader, this is where you'll spend most of your time making those quick, short-term calls.
A huge mistake I see people make is relying on just one kind of tool. A super bullish chart pattern doesn't mean much if on-chain data shows the biggest holders are dumping their bags. You need to combine insights from different tools to build a trading thesis that can actually hold up.
H3: On-Chain Analytics Tools
If technical analysis is about reading charts, on-chain tools are about being a forensic accountant for the blockchain. Platforms like Glassnode and Nansen let you dig right into a crypto's public ledger to see what's really going on behind the scenes—transaction flows, wallet activity, and the overall health of the network. This is where you can spot the "smart money" making its moves.
These tools help you answer the questions that charts simply can't:
- Are the big investors (whales) buying or selling? This is a huge indicator of institutional confidence.
- Is the number of active addresses going up? This points to user adoption and real network growth.
- How much of the total supply is currently in profit? This can be a warning sign that the market is getting overheated.
This infographic really breaks down how a platform's features are only as good as the data they're built on.
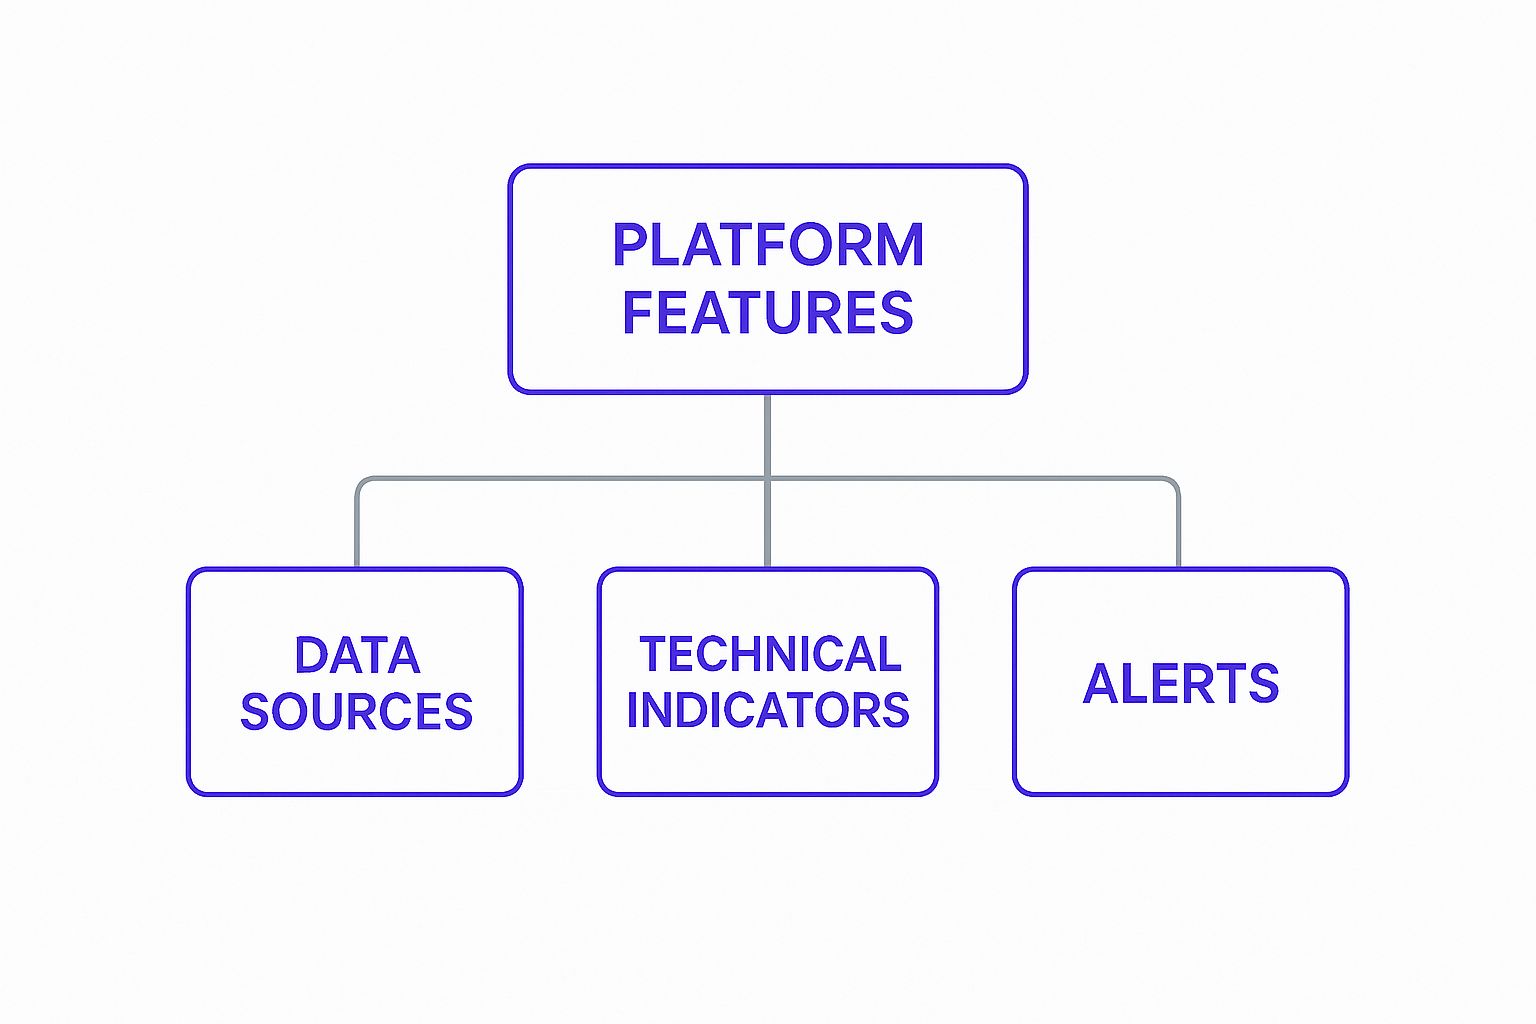
As you can see, you need solid data sources as the foundation before you can even think about building powerful technical indicators or effective alert systems.
H3: Fundamental and Social Sentiment Tools
Charts and blockchain data are critical, but two other categories fill in the rest of the puzzle.
-
Fundamental Analysis Aggregators: Think of tools like Messari as the research libraries for crypto. They pull together all the data on a project’s team, its tokenomics, how much development is happening, and the big-picture vision. This is how you figure out a cryptocurrency's intrinsic value, making it absolutely essential for long-term investors.
-
Social Sentiment Trackers: Platforms like Santiment are all about measuring the market's mood. They scan social media, news trends, and forum chatter to gauge whether the crowd is feeling hyped or fearful. These emotions are powerful market drivers, but they can also be seriously misleading if you don't take them with a grain of salt.
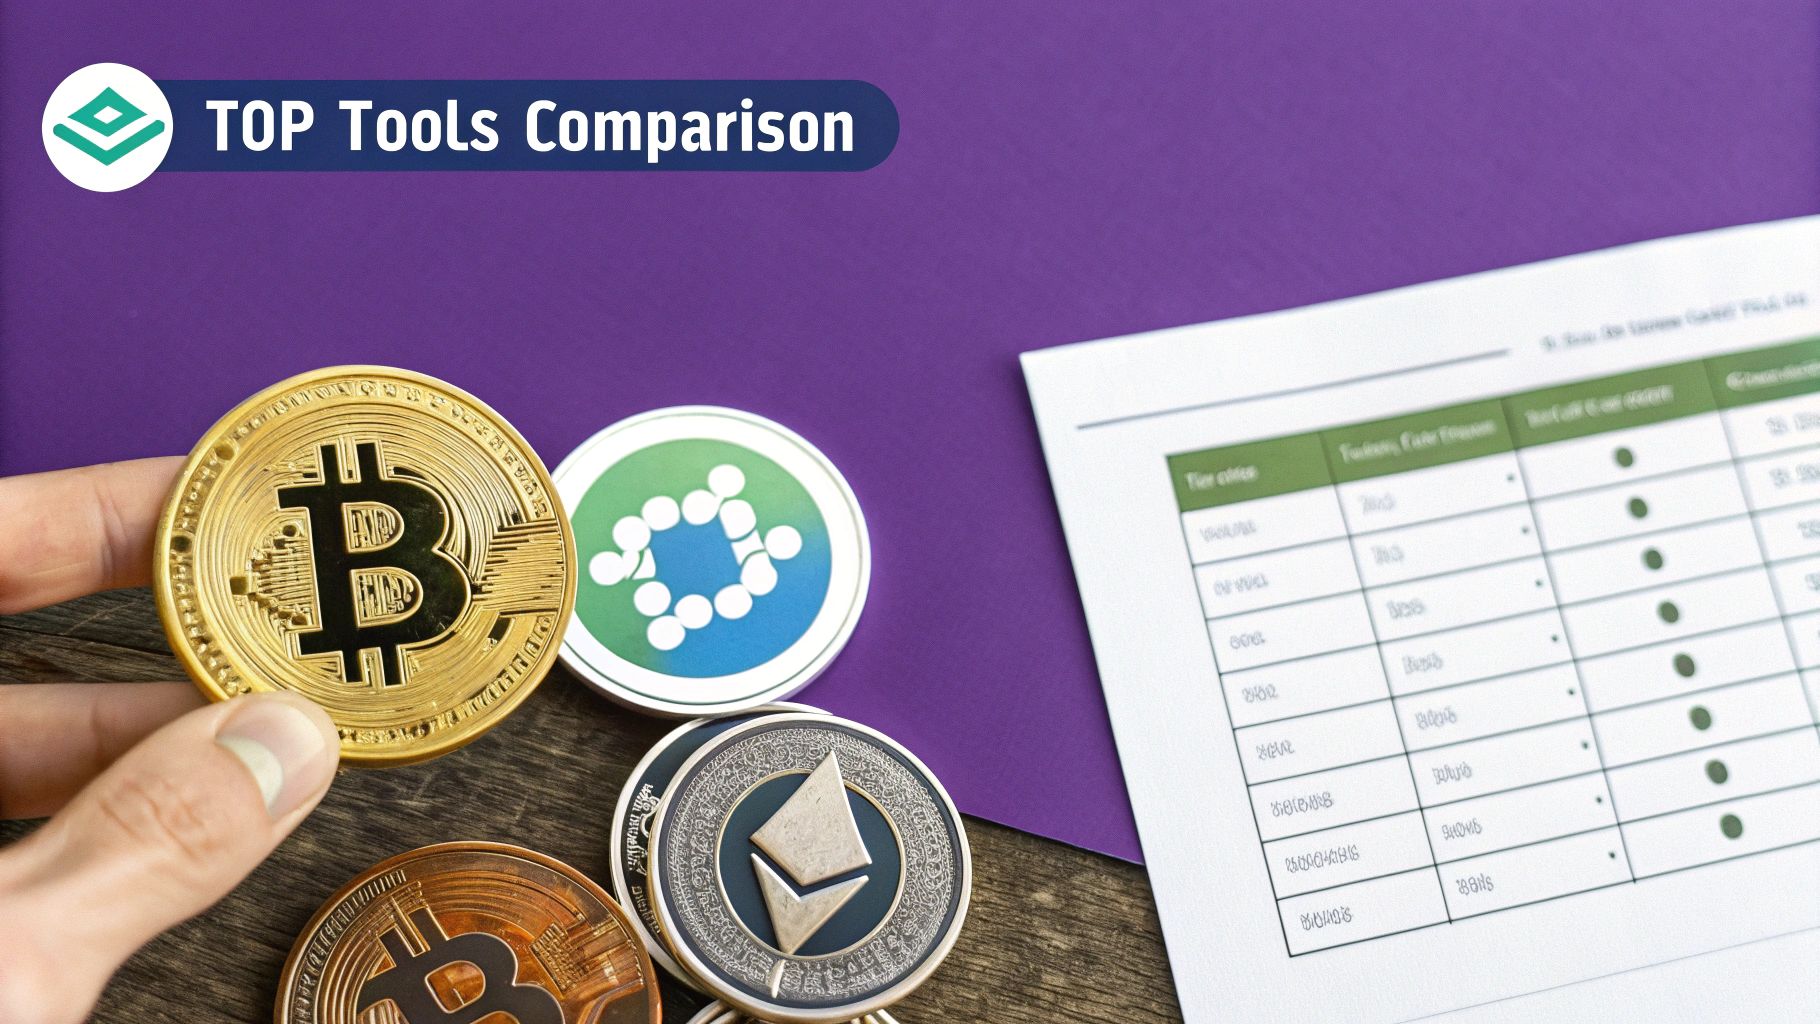
To give you a clearer picture, here’s a quick breakdown of how these tools stack up against each other.
H3: Comparison of Crypto Market Analysis Tool Types
| Tool Category | Primary Function | Data Analyzed | Best For |
|---|---|---|---|
| Technical Analysis | Price forecasting | Historical price, volume, chart patterns | Short- to medium-term trading |
| On-Chain Analytics | Network health & investor behavior | Blockchain transactions, wallet balances | Gauging institutional moves and network adoption |
| Fundamental Analysis | Intrinsic value assessment | Project team, tokenomics, roadmap, financials | Long-term investing (HODLing) |
| Social Sentiment | Market mood & hype tracking | Social media mentions, news, forum discussions | Identifying short-term market psychology |
Each of these tool types gives you a different lens to look at the market. The real magic happens when you start combining them. That’s how you stop guessing and start making informed, strategic decisions.
To get a deeper dive into how to apply these concepts, check out the resources we've put together at the vTrader Academy.
Making Sense of Key Metrics and Indicators
Jumping into crypto analysis tools can feel like trying to drink from a firehose. You’re hit with a wall of data, charts, and numbers that, without context, is just noise. The real skill is learning to see the story behind the data—turning all those complex metrics into simple, actionable insights.
Think of yourself as a market detective. Your job is to gather clues (data points), spot patterns (trends), and build a solid case (your trading strategy). This section is your magnifying glass, helping you see past the surface of a price chart and into the powerful narratives the data is trying to tell you.
Technical Indicators: The Market's Pulse
Technical indicators are basically mathematical formulas that chew through historical price and volume data to help forecast where the market might be heading next. They’re like an EKG for the market, giving you a read on its health and momentum.
Two of the most essential indicators you'll come across are Moving Averages and the Relative Strength Index.
Moving Averages (MAs)
These are your best friend for cutting through the noise. MAs smooth out the daily price swings to give you a much clearer picture of the underlying trend. It's like being on a boat in choppy water—the waves (price volatility) can be disorienting, but the underlying tide (the MA) shows you which way you're really going.
- A Simple Moving Average (SMA) treats every price point in its period equally.
- An Exponential Moving Average (EMA) gives more weight to recent prices, so it reacts faster to new market action.
A classic signal traders watch for is when a short-term MA crosses above a long-term MA—often a sign that bulls are taking control. The reverse can signal a bearish shift.
Relative Strength Index (RSI)
The RSI is a momentum indicator that measures how quickly prices are changing, plotting it on a scale from 0 to 100. Think of it as a rubber band for the market; it tells you when an asset might be stretched too far in one direction and is due to snap back.
An RSI reading above 70 is generally considered overbought. This hints that the asset might be overvalued and due for a price correction. A reading below 30 is considered oversold, suggesting it could be undervalued and ready for a bounce.
On-Chain Metrics: The Blockchain's Diary
This is where crypto analysis gets really interesting. On-chain metrics give you a direct window into a cryptocurrency’s network activity, revealing how investors are actually behaving. It’s the kind of insider information you just can’t get from a standard price chart.
One of the most powerful on-chain metrics is the Net Unrealized Profit/Loss (NUPL). This indicator is like a mood ring for the entire market, showing whether investors, as a whole, are sitting on paper profits or staring at losses.
When NUPL is high (blue/euphoria), it signals extreme greed in the market, often right before a major top. When it sinks low (red/capitulation), it points to extreme fear and a potential bottoming process.
Watching these sentiment shifts provides critical clues that price alone can’t offer. Getting a handle on these metrics is a game-changer, and learning how to read crypto charts is the first step. Platforms like vTrader bring all this together, letting you combine technical and on-chain data for a complete market view, just like in our detailed Bitcoin price prediction analysis.
How to Put Your Analysis into Practice
Knowing the theory is one thing. But translating that knowledge into a confident, real-world trade? That's a whole different ballgame. The real trick isn't just using one tool; it's about layering different types of analysis to build a complete, sturdy picture of the market.
Let’s walk through a real-world scenario to see how this all clicks together. Imagine we're scanning the markets and a potential breakout opportunity catches our eye. Our mission is to go from just watching the charts to building a rock-solid, data-backed trading thesis before a single dollar is on the line.
Step 1: Start With the Technicals
First things first, we hit the charts. Technical analysis is our immediate snapshot of price action and what the market is feeling right now. We're on the hunt for patterns that scream "a big move is coming."
For this example, we’ve spotted a classic bullish pattern: a "bull flag" forming on the daily chart. This little beauty often signals that a strong upward trend is about to continue after a quick breather. We also see the Relative Strength Index (RSI) has cooled off from being overbought and is now pointing upwards again—a great sign that momentum is rebuilding.
The vTrader platform lays these patterns out beautifully, letting you stack indicators like RSI and moving averages right onto the price chart to see the full story.
The chart above gives us our first solid clue. It clearly shows the price consolidating inside that flag pattern, almost like a coiled spring ready to pop.
Step 2: Confirm With On-Chain Data
A pretty chart is a fantastic start, but it's not the whole story. We need to look under the hood to see if the network's activity actually backs up our theory. This is where on-chain crypto market analysis tools become your best friend.
So, we switch over to an on-chain dashboard and start digging into a few key metrics:
- Exchange Outflows: Is a lot of this coin moving off exchanges and into private wallets? Big outflows often mean investors are grabbing coins for the long haul, which is a seriously bullish signal.
- Whale Activity: What are the biggest wallets—the "whales"—up to? If we see them adding to their bags, it tells us the smart money is getting positioned, adding a ton of weight to our bullish idea.
- Active Addresses: Is the number of unique wallets interacting with the network on the rise? This points to growing user adoption and a healthy, active network.
If the data shows exchange outflows picking up and whales are buying, our confidence in this trade starts to soar. On-chain data is the powerful confirmation that turns a good chart setup into a great one. And remember, when you're ready to make a move, especially on networks like Ethereum, it's smart to keep an eye on an Ethereum gas tracker to time your entry and avoid overpaying on fees.
Step 3: Gauge the Social Sentiment
Last but not least, we need to take the market's temperature. Is there a growing buzz and positive chatter around our coin, or is the vibe fearful and pessimistic?
Social sentiment is the emotional fuel that can turn a small market move into a major trend. A positive chart and strong on-chain metrics combined with rising social buzz create a powerful trifecta for a potential breakout.
Using a sentiment analysis tool, we can track the chatter in real-time:
- Social Volume: How many mentions is the coin getting on platforms like X (formerly Twitter), Reddit, and Telegram?
- Weighted Sentiment: Is the overall tone of the conversation positive or negative?
If we see social volume climbing higher alongside increasingly positive sentiment, we've found the final piece of our puzzle. We've now built a complete trading thesis, supported from every angle: technicals, on-chain data, and social buzz. This layered approach is how you stop guessing and start making informed, strategic decisions.
Choosing the Right Crypto Analysis Tools for You

Trying to pick the best crypto market analysis tools can feel like navigating a minefield. But the secret isn't that complicated: the right tool is the one that fits your trading strategy like a glove, not someone else's.
A day trader’s dream setup is often just distracting noise for a long-term investor. If you build a toolkit that’s truly your own, you’ll save a ton of time, money, and headaches down the road.
Match the Tools to Your Trading Style
Before you even look at a single platform, you need to have an honest chat with yourself about your goals. Are you trying to scalp tiny price swings that last a few hours, or are you betting on a project’s success over the next five years? The answer changes everything.
-
For Day Traders and Swing Traders: Your world moves at lightning speed. You need tools that deliver real-time data with almost zero lag. Think advanced charting with every technical indicator you can imagine and custom alerts that ping you the second a price hits your target. Speed is everything.
-
For Long-Term Investors (HODLers): You’re playing the long game, so you care more about the big picture. Your toolkit should be stacked with deep fundamental data, on-chain analytics to see how healthy the network is, and solid research reports that break down a project's tokenomics and roadmap.
The classic mistake? Paying a hefty subscription for an all-in-one platform when your strategy only really needs one or two of its features. Start lean and add to your arsenal as your trading evolves.
Key Evaluation Criteria
Once you know what kind of trader you are, you can start comparing tools with a clear head. This framework helps you cut through the marketing fluff and focus on what actually moves the needle in your analysis.
A huge factor is the quality and sheer breadth of the data. The big guns, the institutional-grade platforms, offer mind-boggling data coverage. Some pull real-time and historical data from over 10,000 coins and 300,000 trading pairs, crunching numbers from hundreds of exchanges around the globe. This lets you analyze everything from order books to social media buzz, all in one place. You can get a feel for how comprehensive data sets fuel professional strategies on platforms like CoinDesk Data.
As you're weighing your options, keep these points in mind:
- Data Accuracy and Scope: Is the tool getting its numbers from reliable sources? Does it even track the coins and exchanges you care about?
- User Interface (UI) and Ease of Use: Is the platform easy to get the hang of, or does it feel like you need a PhD just to find the chart you’re looking for? A clean, intuitive design like vTrader's can make all the difference.
- Feature Set: Does it have the specific indicators, on-chain metrics, or alert systems that your strategy absolutely requires?
- Pricing and Value: Is the price tag justified by the value it brings to your trading? Always, always take advantage of free trials to test-drive a platform before you pull out your credit card.
Feature Checklist for Selecting Analysis Tools
To make this even easier, here's a quick checklist you can use when you're comparing different platforms. It breaks down what features matter most depending on whether you're trading for the short or long term.
| Feature | Importance for Day Traders | Importance for Long-Term Investors |
|---|---|---|
| Real-Time Data Feeds | Critical. Decisions are made in seconds. | Low. Daily or weekly data is usually sufficient. |
| Advanced Charting Tools | Critical. The foundation of technical analysis. | Moderate. Useful for identifying major trend shifts. |
| Customizable Alerts | Critical. Essential for capitalizing on volatility. | Low. Price alerts are less important than fundamental news. |
| On-Chain Analytics | Moderate. Good for spotting short-term network shifts. | Critical. Key for understanding network health and adoption. |
| Fundamental Data/Reports | Low. Not a primary focus for quick trades. | Critical. The core of a long-term investment thesis. |
| Social Sentiment Analysis | High. Useful for gauging market mood and momentum. | Moderate. Helps track community engagement and project hype. |
| User Interface (UI) | High. Speed and clarity are essential for fast execution. | High. A clean interface makes complex research easier to digest. |
Using a checklist like this ensures you're looking at tools through the lens of your own strategy. It's the simplest way to avoid paying for features you'll never touch and to build a toolkit that genuinely helps you make smarter decisions.
Got Questions About Crypto Analysis Tools? We've Got Answers
Diving into the world of crypto analysis tools can feel a bit like learning a new language. You’re bound to have questions, especially when you're starting out. Getting simple, direct answers is the key to building confidence and a trading strategy that actually works.
Think of this as your no-nonsense guide. We’re skipping the jargon and focusing on what you really need to know to pick the right tools and use them well.
What Are the Absolute Must-Have Tools for a Beginner?
If you’re new to the game, the best thing you can do is keep it simple. Don't try to master a dozen complex tools at once—that’s a fast track to burnout. All you really need to get started is a powerful but user-friendly combo that won’t cost you a dime.
Here’s a great starting point:
- A solid charting platform: A free account with a service like TradingView is perfect. It gives you all the powerful charting features you need to get your feet wet with technical analysis.
- A reliable data aggregator: Sites like CoinGecko or CoinMarketCap are your go-to for the fundamental stuff—market cap, token supply, project details, you name it.
This simple one-two punch covers your technical and fundamental analysis bases without you having to spend anything. It’s the perfect way to learn the ropes and figure out what data really moves the needle for your strategy before you even think about paying for premium tools.
Can I Really Predict Prices With On-Chain Data?
On-chain data is a game-changer for spotting long-term trends and gauging the health of a crypto network. But it's not a crystal ball for telling you what the price will be tomorrow. It gives you context, not a guaranteed prediction.
For instance, if you see a huge amount of Bitcoin moving off exchanges, it’s a strong signal that people are tucking it away for the long haul—a bullish sign. But that single piece of information won't tell you if the price is going up or down in the next 24 hours.
The real magic happens when you layer on-chain analysis with technical charts and market sentiment. This multi-faceted approach gives you a much richer, more reliable view of the market, helping you build a trading thesis you can stand behind.
Are Free Crypto Analysis Tools Actually Any Good?
Yes, absolutely. For most retail investors and traders, the free tools available today are more than powerful enough to conduct some seriously high-quality analysis. Platforms like vTrader and the free version of TradingView offer charting capabilities that, just a few years ago, were only available on expensive professional terminals.
So, why would anyone pay? Paid tools typically offer niche datasets, real-time alerts for day traders, and advanced custom indicators. For a professional or a high-frequency trader, that edge can be worth the price. But if you're just starting out, you can learn an incredible amount with the free resources alone.
For more answers to your questions, you can always check out the official vTrader FAQ section for more details on our platform and key trading concepts.
Ready to put your analysis into action with zero trading fees? Join vTrader today and get a $10 sign-up bonus to start building your portfolio on a platform designed for smarter, more profitable trading. https://www.vtrader.io

Steve Gregory is a lawyer in the United States who specializes in licensing for cryptocurrency companies and products. Steve began his career as an attorney in 2015 but made the switch to working in cryptocurrency full time shortly after joining the original team at Gemini Trust Company, an early cryptocurrency exchange based in New York City. Steve then joined CEX.io and was able to launch their regulated US-based cryptocurrency. Steve then went on to become the CEO at currency.com when he ran for four years and was able to lead currency.com to being fully acquired in 2025.