Let’s cut to the chase: ATH stands for All-Time High. It’s the highest price a crypto or any other asset has ever hit. Period.
Think of it like a boxer's peak performance—the one knockout punch everyone remembers. It’s a huge deal for traders, a benchmark that sets the stage for everything that comes next.
What an All-Time High Really Tells You
When someone in a trading group asks, "What does ATH mean?" they're talking about a major milestone. An All-Time High isn't just a number; it’s the absolute peak of optimism, the point where buying pressure was so intense it pushed the price to a record.
For traders, hitting an ATH is like breaking through the ceiling. All previous resistance levels are gone. This is called "price discovery"—we're in uncharted territory, and without any historical price levels to slow it down, an asset can really take off.
Why Every Trader Watches the ATH
The ATH gives you a quick, powerful snapshot of an asset's history and potential. Knowing that Bitcoin rocketed to nearly $69,000 back in November 2021 tells you just how explosive its growth has been. To get a better handle on terms like this, the vTrader Academy is a great place to start building your knowledge.
An All-Time High is more than a stat; it’s a psychological line in the sand. When an asset smashes through it, it often triggers a fresh wave of confidence, pulling in new buyers who believe the sky's the limit.
This metric matters whether you're in it for the long haul or just making a quick trade. It shows you the maximum price the market has ever been willing to pay, which is critical info for figuring out your next move. For a deeper dive into common financial terms, you can check out this guide on financial acronyms and their meanings.html).
Here’s a simple breakdown of what an ATH means for different people in the market.
Key Aspects of an All-Time High
| Aspect | What It Means for Investors |
|---|---|
| Psychological Level | Breaching the ATH can create a "fear of missing out" (FOMO), driving more buyers in. |
| Price Discovery | With no past resistance, prices can move up quickly as traders look for the new top. |
| Market Confidence | A new ATH signals strong belief in the asset's future, attracting mainstream attention. |
| Profit-Taking Point | For early investors, an ATH is a signal that it might be a good time to sell and lock in gains. |
Ultimately, an ATH is a moment of truth—a sign of peak excitement but also a potential turning point where the market might reverse.
The Market Psychology Behind an ATH

An All-Time High isn't just a number on a screen. It’s a major psychological trigger that sends shockwaves through the market, kicking up a storm of powerful, and often clashing, emotions.
The moment an asset shatters its old record, it steps into uncharted territory—what traders call price discovery. There’s no history, no resistance, no ceiling. This creates a potent cocktail of raw excitement and gut-wrenching anxiety.
Suddenly, everyone’s talking about it. News outlets, social media, group chats—the ATH acts like a massive spotlight, pulling in traders who were just watching from the sidelines. The entire conversation flips from "Will it ever recover?" to "How high can this thing actually go?"
The Grip of FOMO
This is where FOMO (Fear of Missing Out) grabs hold. Seeing an asset blast past its old peak creates an intense feeling of urgency. New investors see the screenshots of massive gains and start to think they're missing the trade of a lifetime.
The hype machine goes into overdrive with a flood of bullish predictions and success stories. Jumping in feels not just exciting, but necessary. This fresh wave of buying pressure often pushes the price even higher, feeding a cycle of pure momentum.
You can track assets getting close to these explosive levels by checking out the vTrader news hub for real-time crypto coverage.
An ATH creates a strange paradox. While newcomers feel the magnetic pull of FOMO, the old hands often feel the chilling push of FUD. They’re left wondering if the party’s over and if it’s time to cash in their chips.
The Shadow of FUD
At the exact same time, a completely different emotion takes over for the early investors: FUD (Fear, Uncertainty, and Doubt). These are the people sitting on life-changing paper profits, and now they’re getting nervous. They start asking themselves how much longer the rocket can keep climbing.
Every tick upward forces a tough decision.
- Do I sell now and lock in these massive gains?
- But what if I sell too early and miss the next 2x?
- Is this a classic blow-off top before a brutal correction?
This constant battle between greed and fear creates an invisible wall of selling pressure. Once enough of these early holders decide to take profits, they can trigger the very crash they were afraid of. It’s a perfect example of how human psychology—not just numbers—drives the chaos around an all-time high.
How Traders Actually Use an ATH
An All-Time High isn’t just a number on a chart—it's a massive green light for experienced traders. For them, an ATH is a trigger, a clear signal to jump into action with a specific game plan. They don’t get swept up in the FOMO or FUD; they see an opportunity and execute.
Two classic plays come to mind when an asset hits its ATH: the breakout and the reversal. They're polar opposites, but both hinge on that critical price level.
The Breakout Momentum Play
This one’s straightforward. When a coin smashes through its old ATH, breakout traders jump in and buy, betting the upward rocket has just been fueled. Why? Because there's no old resistance left to stop it. The coin is literally in uncharted territory, a phase called "price discovery."
A clean break above an ATH often sucks in a flood of new buyers, which can create a self-fulfilling prophecy where the price just keeps climbing.
- The Signal: A strong, confident move above the previous ATH, ideally backed by a big spike in trading volume.
- The Action: Go long (buy) right after the breakout is confirmed.
- The Goal: Ride that momentum for as long as it lasts.
Of course, nothing in trading is a sure thing. Before you even think about trying this, you need to know how to backtest trading strategies to see if it even works historically.
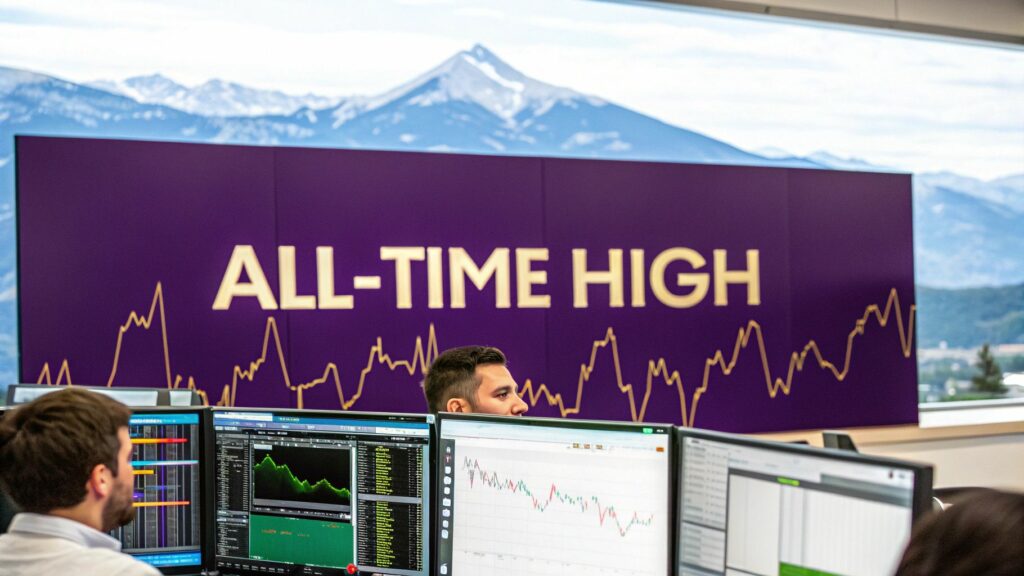
Here’s what that setup often looks like on a chart, where traders are watching for that exact moment.
Seeing the price action visually helps traders pinpoint the precise second an asset cracks its old peak.
The Reversal Resistance Play
On the flip side, some traders see an ATH as a giant red stop sign. They treat it as a ceiling—a heavy resistance level where the buying pressure is likely to fizzle out as early investors finally decide to take their profits off the table.
For them, the ATH is the peak of the party, and a correction is right around the corner.
A failed attempt to break an ATH is often a stronger signal than a successful one. It can signal that the market is exhausted and sellers are about to take control.
Instead of buying, these traders do the exact opposite: they short the asset. They open a sell position right near the ATH, betting the price is about to drop. It’s a gutsy move that requires sharp timing, but the payout can be huge if they call it right. This is the kind of signal traders might look for when making a https://www.vtrader.io/en-us/price-prediction/btc near its peak.
Trading Strategies Around an ATH
So, how do different traders approach this key moment? It really comes down to their risk tolerance and what they believe the market will do next.
| Strategy | Action | Rationale | Primary Risk |
|---|---|---|---|
| Momentum Trading | Buy after the ATH is broken. | Bet that new buyers will flood in, pushing the price higher into uncharted territory. | A "false breakout" where the price quickly reverses back below the old ATH. |
| Swing Trading | Wait for a pullback after the ATH, then buy. | The ATH becomes the new support level. Buying the first successful retest is a lower-risk entry. | The asset never pulls back and just keeps running, causing a missed opportunity. |
| Scalping | Rapidly buy and sell small price movements right around the ATH. | High volatility at the breakout point creates quick, small profit opportunities. | High transaction costs and the risk of being caught on the wrong side of a sharp move. |
| Short Selling | Sell (short) as the price approaches or fails to break the ATH. | Bet that buying momentum will exhaust and early investors will start selling. | The asset breaks out with force, leading to potentially unlimited losses on a short position. |
Each of these approaches uses the ATH as a pivot point, but the execution and mindset behind them are completely different. Ultimately, understanding both the bullish and bearish case is what separates a calculated trade from a wild guess.
Understanding ATH vs ATL for a Complete View

An All-Time High tells a thrilling story, but it's just one chapter. To get the whole book, you have to look at its polar opposite: the ATL (All-Time Low). The ATL is the absolute lowest price a coin has ever hit.
Think of it like a mountain range. The ATH is the highest, most epic peak, while the ATL is the deepest, darkest valley. You can't really grasp the height of that peak without knowing the depth of the valley it climbed out of.
This contrast between the highest high and lowest low gives you the asset’s entire life story. It paints a clear picture of its potential volatility and the price range it’s lived in. You can see this journey for yourself when you check Bitcoin's price history on vTrader.
Using Both Extremes to Analyze Risk
Knowing both numbers is a game-changer for assessing risk. A coin trading near its ATH has proven it has serious strength and market love, but it also hints that the short-term upside might be limited. The risk? Buying at the absolute peak right before a pullback.
On the flip side, an asset hanging out near its ATL presents a completely different set of possibilities.
- A Hidden Gem: It could be an undervalued coin that the market has overlooked, coiled and ready for a massive recovery. Buying near the floor offers the biggest potential rewards.
- A Sinking Ship: It could also be a failing project with major problems, bleeding out on its way to zero. The risk here is trying to catch a "falling knife."
By comparing a coin's current price to both its ATH and ATL, you get a powerful context that one metric alone just can't provide. It helps you ask the right questions: Is this a peak? Is this a bottom? Or is it somewhere in between?
Knowing what does ATH mean is just the start. When you combine that with a solid understanding of the ATL, you equip yourself with a much sharper analytical toolkit. It lets you move beyond the hype and make more calculated trades based on the asset’s full story.
Common Misconceptions About All-Time Highs
When an asset smashes its All-Time High, the noise from social media and news outlets is almost deafening. That excitement can create some powerful myths that trick even seasoned traders into making moves they later regret. To really understand what an ATH means, you have to separate the hype from reality.
One of the biggest mistakes is seeing an ATH as a giant, flashing sell signal. Yes, a lot of early investors will cash out and take profits—that’s a given. But an ATH also signals incredible strength and a wave of positive sentiment. For many assets, breaking a previous high isn’t the finish line; it's the starting gun for a whole new rally.
Myth 1: An ATH Is Always the Peak
Calling an ATH the absolute top is a classic rookie mistake. When an asset enters price discovery, there’s no old resistance to hold it back. It's in uncharted territory, and that can trigger some serious momentum as traders driven by FOMO pile in.
Instead of being a ceiling, a new ATH can be a powerful confirmation that the uptrend is the real deal. Just look at Bitcoin’s 2021 bull run. It blew past its 2017 high of around $20,000 and then more than tripled over the next few months. That ATH wasn't a brick wall; it was a launchpad.
The real signal isn't the ATH itself, but how the market reacts to it. A strong breakout with high volume suggests conviction, while a weak push followed by a quick rejection can signal exhaustion.
Myth 2: Buying at an ATH Is a Terrible Idea
It sounds completely backward, I know, but buying at an ATH isn’t always a terrible play. Momentum traders actually build entire strategies around this, betting that the psychological breakout will pull in a flood of new money and send prices soaring. It’s all about context.
Think about it: an asset hitting its ATH on the back of solid fundamental news has a much better shot at continuing its run. Of course, the risk of a sharp pullback is always there. A smarter approach is often to wait for a confirmed breakout and then look to buy if the price retests the old ATH as a new support level. At the end of the day, an ATH is just one data point—it's never the full story.
All-Time High: Your Questions Answered
After getting into the thick of ATH psychology and trading tactics, you probably have some real-world questions. I get it. Let's break down the common ones so you know exactly what you're looking at.
What Happens After a Crypto Hits a New ATH?
When a coin blows past its old record, it enters a wild phase called "price discovery." Think of it like this: you're in uncharted territory. There's no old resistance telling the price where to stop, so momentum can build fast, leading to some seriously sharp moves upward. It’s a bit like a rocket breaking through the atmosphere—less friction holding it back.
But that excitement almost always gets hit with a wave of selling. Early birds who've been sitting on huge gains see the new ATH as their cue to cash out. This profit-taking can spark a quick correction. The coin’s next move really depends on who wins the tug-of-war: the new buyers with a case of FOMO or the early sellers locking in their profits.
That moment right after an ATH is a battleground. It’s the FOMO crowd versus the profit-takers. This clash is what creates the insane volatility that traders both love and dread.
Is an All-Time High the Same on Every Exchange?
Not exactly, no. An asset's ATH can be slightly different depending on where you're looking. You'll see tiny variations in price and trading volume across platforms like Coinbase, Binance, or Kraken. A buying frenzy on one exchange might push Bitcoin to $70,100, while it only nudges $70,050 on another.
For most people, this small difference is just noise. Big data sites like CoinGecko and CoinMarketCap pull data from all over to give everyone a generally accepted ATH number. But if you’re a technical trader living in the charts, the specific ATH on your chosen exchange is the only one that really matters.
How Can I Find the ATH of a Cryptocurrency?
Finding the All-Time High for any coin is easy. Your best bet is to go straight to the major crypto data aggregators. These sites are the gold standard for market info and have interactive charts where you can see all the key stats at a glance.
Here’s where to look:
- CoinGecko: Gives you the full picture—the ATH price, the date it happened, and how far the current price is from that peak.
- CoinMarketCap: Just like CoinGecko, it’s loaded with detailed historical charts and key metrics for thousands of different assets.
Most trading platforms and crypto news sites also keep this info front and center. For more detailed guides and answers to other trading questions, you can always check the vTrader FAQ section.
Does an ATH Account for Inflation?
Good question. The ATH you see on a chart is almost always the nominal high—the raw price the coin hit on that day. It doesn't account for inflation.
An "inflation-adjusted" or "real" ATH would consider the changing value of money over time, but that's a much more complicated metric that you almost never see used in everyday crypto trading chatter.
Ready to track the next All-Time High and trade with zero fees? Join vTrader today and get a $10 sign-up bonus to start your journey. Sign up on vTrader and experience commission-free trading.

Steve Gregory is a lawyer in the United States who specializes in licensing for cryptocurrency companies and products. Steve began his career as an attorney in 2015 but made the switch to working in cryptocurrency full time shortly after joining the original team at Gemini Trust Company, an early cryptocurrency exchange based in New York City. Steve then joined CEX.io and was able to launch their regulated US-based cryptocurrency. Steve then went on to become the CEO at currency.com when he ran for four years and was able to lead currency.com to being fully acquired in 2025.