When traders talk about market volatility, they're really talking about one thing: the speed and size of price changes. Think of it like turbulence on a flight. Sometimes the ride is smooth, with just a few minor bumps. Other times, you're on a rollercoaster, with sharp climbs and even sharper drops.
While it’s easy to think of volatility as just another word for risk, it's also the very force that creates opportunities for profit.
Understanding Market Volatility From Theory to Reality
At its core, getting a handle on market volatility means understanding how quickly—and how dramatically—an asset's price can swing. It’s a completely natural, even necessary, part of any healthy market, from old-school stocks to the fast-paced world of crypto. A market with zero movement would mean zero chance for growth.
Imagine a calm sea versus a stormy one. The calm sea is a low-volatility market, where prices move slowly and predictably. It feels safe, sure, but the potential for big returns is pretty slim. Now, picture that stormy sea—that's a high-volatility market. The massive waves of price swings create both incredible risk and the chance for substantial rewards.
Volatility isn't just a measure of risk; it's a measure of uncertainty. When investors are unsure about what’s next—thanks to economic news, geopolitical events, or just a shift in mood—prices fluctuate more aggressively as everyone scrambles to react.
To give you a clearer picture, let's break down the key differences between these two market states.
Market Volatility At a Glance
| Characteristic | Low Volatility (Stable Market) | High Volatility (Uncertain Market) |
|---|---|---|
| Price Movement | Small, gradual, and predictable. | Large, rapid, and often erratic. |
| Investor Sentiment | Generally calm, confident, or even bored. | Dominated by fear, greed, and uncertainty. |
| Trading Range | Narrow price channels. | Wide and expanding price channels. |
| Potential Returns | Modest and steady. | High potential for both gains and losses. |
| Best For | Long-term, buy-and-hold investors. | Short-term traders, scalpers, and day traders. |
| Example | A blue-chip stock in a stable economy. | A new cryptocurrency during a major news event. |
This table neatly sums up the two faces of volatility. Your trading style and risk appetite will determine which environment you find more appealing.
The Two Sides of Volatility
It's crucial to see volatility from both sides of the coin. For someone investing for retirement, a few weeks of choppy markets might just be background noise—blips that don't derail a decades-long plan. But for a day trader, those blips are where the action is.
Short-term traders thrive on volatility, aiming to profit from those quick price swings. This dual nature is why understanding volatility is non-negotiable for everyone in the market. It helps you set realistic goals and match your strategy to how much risk you can stomach. A big part of this is just continuing to learn, and you can explore more essential topics over at the vTrader Academy to sharpen your skills.
Why Volatility Matters for Every Investor
Whether you’re putting money in the S&P 500 or trading Bitcoin, volatility sets the rhythm of the market. It impacts everything from how options are priced to how well your risk management tools work.
For instance, when volatility spikes:
- Risk goes up: The odds of losing money in a short timeframe get higher.
- Opportunities grow: The potential for quick, significant profits also gets a major boost.
- Emotions run high: Fear and greed can easily take over, making a cool head and a disciplined strategy more critical than ever.
Ultimately, volatility isn't something to be afraid of; it's a fundamental part of the game. It’s the market’s way of signaling uncertainty or "fear" among traders. Learning to read those signals, instead of running from them, is a true cornerstone of successful trading.
How Experts Measure Market Volatility
It's one thing to have a gut feeling that the market is turbulent, but it's another thing entirely to put a number on it. To move beyond that general sense of choppiness, professional traders and analysts lean on a few powerful metrics. These tools don't just confirm that the market is shaky; they actually quantify the expected level of movement, turning abstract fear into data you can act on.
The most famous of these is the CBOE Volatility Index, known to just about everyone in the financial world as the VIX. You’ll often hear it called the "fear gauge" or "fear index," and for good reason. The VIX measures the market's expectation of price swings over the next 30 days, using options prices on the broad S&P 500 index as its source.
Interpreting The VIX
Think of the VIX as a speedometer for market anxiety. Its value tells a story about how investors are feeling.
- VIX Below 20: This is the green zone. It generally signals low volatility, stability, and high investor confidence. The market feels calm and relatively predictable.
- VIX Between 20 and 30: Things are getting a bit more uncertain here. This range suggests investors are growing cautious, though widespread panic hasn't kicked in yet.
- VIX Above 30: Red alert. A reading this high points to significant fear and intense volatility. Traders are bracing for sharp, unpredictable price moves.
This visual breaks down the major forces that can send volatility—and metrics like the VIX—soaring.
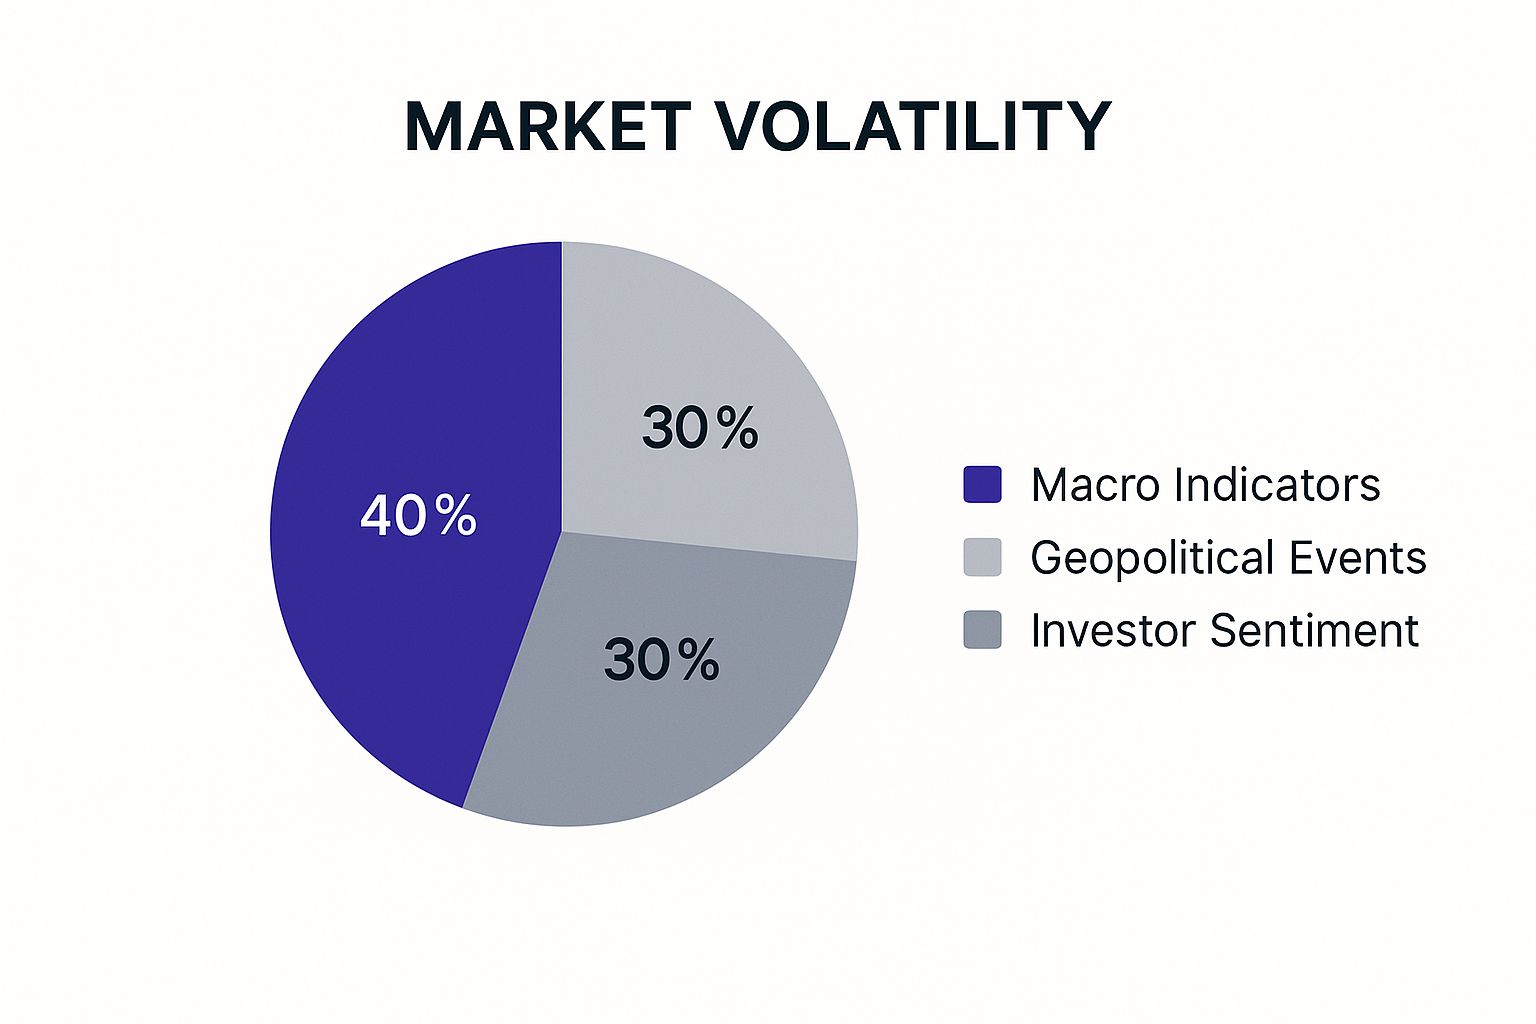
As you can see, big-picture economic factors are often the main drivers, but geopolitical shocks and a simple shift in investor mood also play a huge role in cranking up the market's uncertainty dial.
The VIX first appeared in 1993, originally tracking the S&P 100. It got a major upgrade in 2003 when it shifted to the more comprehensive S&P 500, making it a much sharper barometer of U.S. market sentiment. During historic meltdowns like the 2008 financial crisis or the 2020 pandemic shock, the VIX has rocketed to jaw-dropping levels above 80, reflecting pure, unadulterated panic in the markets.
Other Key Volatility Measures
While the VIX gets all the headlines, it's not the only game in town. Pros use a mix of metrics to get a complete picture. Two other crucial concepts are historical and implied volatility.
Historical Volatility (HV) is all about looking in the rearview mirror. It calculates how much an asset's price has actually deviated over a set period, like the last 30 or 90 days. It tells you how wild the ride has been.
Implied Volatility (IV), on the other hand, looks through the windshield. It's derived from options prices and represents the market's forecast of future turbulence. The VIX is the most famous example of an implied volatility index.
Understanding these numbers is crucial, but so is knowing how they hit your bottom line. Higher volatility can sometimes influence trading costs, making a transparent fee structure more important than ever. That's why it's a good idea to be familiar with the vTrader fee schedule. When you know exactly what your costs are, you can trade with more confidence, especially when markets get rough.
The Hidden Forces Driving Market Swings
Market volatility never just materializes out of thin air. It's the explosive result of powerful economic, political, and deeply human forces clashing on the world's financial stage. If you want to anticipate and react to those sudden surges or gut-wrenching drops, you first need to understand what's pulling the strings.
Think of the market as a massive, intricate web. Tug on one thread, and the vibrations ripple through the entire structure. These "tugs" generally come from three places: major economic reports, geopolitical bombshells, and the age-old cycles of investor psychology. Once you connect these catalysts to the price action on your screen, you start to see the "why" behind every big move.
Economic Data Releases
First up are the big economic reports. These are scheduled announcements that essentially give the economy a health check, and you can bet institutional investors are watching them like hawks. These key data points are the signals that tell big money when to hit the gas and when to slam on the brakes.
The most influential reports include:
- Interest Rate Decisions: When central banks like the Federal Reserve adjust interest rates, it ripples through the entire economy. It changes the cost of borrowing for everyone, from corporations to consumers, either juicing the economy or cooling it down.
- Inflation Reports: Data from the Consumer Price Index (CPI) and Personal Consumption Expenditures (PCE) reveals how fast prices are climbing. Spiking inflation almost always creates uncertainty, as it signals that higher interest rates could be on the horizon.
- Employment Figures: Job growth and unemployment rates are a direct pulse-check on economic health. Strong numbers can supercharge investor confidence, while weak reports can spark fears of a recession.
But here’s a twist: the link between big news and big volatility isn't always what you’d expect. Common sense says a major announcement should create a massive price swing, but reality is often more nuanced. An extensive 34-year study found something counterintuitive: major economic data releases frequently suppress market volatility rather than ignite it. The analysis showed that volatility indexes like the VIX closed higher on only 45% of data release days—less often than on a normal trading day.
Geopolitical Shockwaves
Beyond the numbers, the global political landscape is a massive engine of uncertainty. Markets thrive on stability and predictability; geopolitical events often serve up the complete opposite. A sudden international crisis can send a shockwave of fear through markets worldwide, causing a mad dash for so-called "safe-haven" assets.
These events throw wild cards into the deck that are nearly impossible to price in, leading to sharp, knee-jerk reactions. Think about events like:
- Trade Wars and Tariffs: The mere announcement of new tariffs can throw a wrench into supply chains and corporate profit forecasts, as we saw during the U.S.-China trade disputes.
- International Conflicts: Military action introduces extreme unknowns, affecting everything from oil prices to global shipping routes.
- Political Instability: An unexpected election result or political chaos in a major economy can shatter investor confidence in an instant.
Staying on top of these developments is non-negotiable for any serious trader. Keeping a reliable news source like the vTrader news hub on your radar can help you stay ahead of the headlines that might rock your portfolio.
"In the short run, the market is a voting machine but in the long run, it is a weighing machine." – Benjamin Graham
This classic quote perfectly captures the dynamic. Daily news (the "voting") can trigger short-term panic, but eventually, the market gets back to what it does best: assessing the fundamental value of assets (the "weighing"). This brings us to the final, and arguably most powerful, driver of them all.
The Human Element: Fear and Greed
At the end of the day, markets are made of people. The collective psychology of millions of investors creates powerful emotional tides that can swell market swings far beyond what the economic data alone would justify.
The two emotions that rule the floor are fear and greed. Greed is the fuel for market bubbles, compelling investors to pile into assets and inflate prices to absurd, unsustainable levels. Fear, its destructive twin, triggers panic-selling during a downturn, causing prices to crash with dizzying speed. This emotional rollercoaster is a fundamental source of market volatility.
Comparing Volatility in Stock and Crypto Markets
While volatility is a given in any market, its intensity can be worlds apart between different assets. Think of it like this: the stock market is a massive, old-growth oak tree. It’s been around for ages, its roots run deep, and while a big storm will make its branches sway, it takes a full-blown hurricane to do any real damage.
The crypto market, on the other hand, is like a young, hyper-growth sapling. It shoots up at an incredible speed, but it’s far more vulnerable to getting thrashed around by even a strong gust of wind.
For perspective, a 5% drop in the S&P 500 is front-page news, sending tremors across the global financial system. But in crypto? A 5% swing in Bitcoin’s price might not even be the biggest news before lunch. This isn’t random chaos; it’s a reflection of the fundamental DNA of each market.
The Influence of Market Maturity and Size
The stock market is a centuries-old institution with trillions of dollars locked in and a dense web of regulations. Its sheer scale and the incredible diversity of its players—from colossal pension funds to everyday retail investors—create a natural inertia. This massive ocean of capital acts like a giant shock absorber, smoothing out price fluctuations and reining in the wild, sudden swings that characterize younger markets.
Crypto is the new kid on the block. Its markets are comparatively tiny and far less mature. With fewer participants and much less capital, a single large trade from a “whale” can send massive ripples through the market, causing prices to spike or plummet in a matter of minutes. This lower liquidity means there simply aren't as many buyers and sellers ready to jump in at any given price, making the market hypersensitive to abrupt shifts in supply and demand.
The real difference comes down to stability. Stock market volatility is usually a reaction to hard economic data or proven corporate results. Crypto volatility? It’s often driven by a new tech breakthrough, a regulatory rumor, or just pure, unadulterated speculation.
Regulation and Speculation
Another massive differentiator is the regulatory landscape. Stock markets are heavily policed by government agencies like the Securities and Exchange Commission (SEC). These rules exist to protect investors and maintain market stability, which naturally puts a damper on extreme price action. Things like mandatory financial disclosures, insider trading laws, and circuit breakers that halt trading during a crash all create a more controlled arena.
Crypto, meanwhile, still operates in a regulatory gray zone in many corners of the globe. This lack of a clear, unified rulebook creates a massive amount of uncertainty, which is the perfect fuel for volatility. A whisper about a government crackdown or, conversely, news of a Bitcoin ETF approval can set off staggering price movements.
This wild-west environment also makes crypto a hotbed for speculation. A huge number of traders are in it for the potential for quick, life-changing gains, not necessarily for the underlying utility of the technology. This speculative fever can pump up volatility to insane levels, as prices get completely detached from any fundamental value and are instead fueled by social media hype and crowd psychology.
To put a number on it, World Bank data showed that U.S. stock price volatility was 24.99 in 2021. That figure represents the average annualized fluctuation of the national stock market index and gives a solid benchmark for "normal" in a mature equities market. You can dig deeper into these metrics and see what they signal about global market health by checking out the World Bank's volatility data.
Ultimately, to really get a handle on what market volatility is, you have to appreciate these critical differences. Both stocks and crypto present unique opportunities, but they’re playing two completely different games. Knowing this lets you tailor your strategy for the specific risks you're taking on.
Actionable Strategies for Volatile Markets
Knowing what volatility is gives you knowledge, but knowing how to react gives you power. Choppy markets can feel intimidating, but they also carve out unique opportunities for anyone who comes prepared. It's all about shifting your mindset from purely defensive to strategically proactive.
This isn’t about trying to perfectly predict the future—that’s a fool's errand. Instead, it’s about building a robust trading framework that can weather the storm. By blending disciplined risk management with strategies designed to work with volatility instead of against it, you can start to see market chaos as an advantage, not a threat. Let’s get into the specifics.
Master Your Risk Management Fundamentals
Before you even think about chasing profits in a wild market, you have to protect what you already have. Solid risk management is the bedrock of any trading career, and its importance is amplified tenfold when prices are swinging wildly. These aren't just suggestions; they are non-negotiable rules for survival.
First up is the stop-loss order. Think of it as your portfolio's emergency eject button. A stop-loss is a pre-set order to automatically sell an asset once it drops to a certain price, capping your losses before they spiral out of control. It takes the emotion out of a tough decision, preventing a small, manageable loss from becoming a catastrophic one fueled by hope or fear.
Next, portfolio diversification. The old saying, "don't put all your eggs in one basket," is a market cliché for a very good reason. Spreading your capital across different asset classes—like stocks, commodities, and various cryptocurrencies—helps cushion the blow if one particular sector takes a nosedive.
Discipline is your most valuable asset during market turmoil. The biggest trading mistakes are born from emotional reactions—panic-selling at the bottom or fear-of-missing-out (FOMO) buying at the top. A solid plan, built when you are calm and rational, is your best defense against your own worst instincts.
Proactive Strategies to Leverage Volatility
Once your defenses are rock-solid, you can start looking for ways to actually use that volatility to your advantage. These strategies are a bit more advanced and come with their own risks, but they offer powerful ways to generate returns precisely when the market is at its most unpredictable.
One popular method is options trading. Options contracts give you the right—but not the obligation—to buy or sell an asset at a set price in the future. Specific strategies, like straddles and strangles, are built to profit from big price moves, no matter which direction they go. If you expect a huge swing after an earnings report but aren't sure if it'll be up or down, options offer incredible flexibility.
Another angle involves VIX-linked products. The VIX is often called the market's "fear gauge" because it tends to spike when markets fall. Some traders use VIX-related ETFs and futures to either hedge their portfolios against a downturn or directly speculate on rising fear. When stocks plummet and the VIX soars, these positions can deliver serious gains that help offset losses elsewhere.
Volatility Trading Strategies Comparison
Navigating volatility isn't a one-size-fits-all game. Different strategies serve different purposes, from simple capital protection to complex profit generation. This table breaks down the core approaches to help you understand where each fits in a well-rounded plan.
| Strategy | Primary Goal | Associated Risk Level | Best Used In |
|---|---|---|---|
| Stop-Loss Orders | Capital Preservation | Low | All market conditions, especially high volatility. |
| Diversification | Risk Reduction | Low to Medium | All market conditions, as a foundational strategy. |
| Options Trading | Profit from large price moves in any direction. | High | Anticipated high-volatility events (e.g., earnings reports). |
| VIX-Linked Products | Hedge against downturns or speculate on rising fear. | High | Bear markets or periods of extreme uncertainty. |
Choosing the right mix of these strategies depends entirely on your risk tolerance and market outlook. A defensive trader might stick to stop-losses and diversification, while an aggressive one might dip into options or VIX products when they spot an opportunity.
Finally, don't overlook strategies that can generate returns regardless of what prices are doing day-to-day. In the crypto world, this often means earning passive income on your digital assets. For example, exploring the details of vTrader's staking program can show you how to put your crypto to work, earning rewards that build up steadily even when the market is a rollercoaster. This adds another layer to your potential returns that isn't tied directly to price action.
Common Questions About Market Volatility
Even after you get the basics down, a few nagging questions always seem to pop up when you try to apply the textbook definitions to the fast-moving, real-world market. Understanding what is market volatility can sometimes feel like learning a whole new language.
This section cuts right to the chase, tackling the most common questions traders have. We’re here to clear up any lingering confusion and bridge the gap between knowing the theory and trading with confidence.
Is Volatility Always a Bad Thing?
Not at all. While most people hear "volatility" and immediately think of risk and sharp losses, it's also the very thing that makes trading profitable. Think about it: a market that never moves offers zero opportunity. Price has to swing for traders to make money.
The real skill is learning to tell the difference between manageable price swings and pure, unpredictable chaos. For seasoned traders, high volatility isn't an enemy to be feared—it's just another market condition, like a weather forecast. It's not about "good" or "bad"; it's about knowing how to adjust your strategy for the climate you're in.
Can We Predict When Volatility Will Spike?
Predicting the exact moment a volatility spike will happen is impossible. No one has a crystal ball. However, what you can do is anticipate periods where a spike is highly likely. This usually comes down to scheduled events that are known to stir up uncertainty in the markets.
Keep your eyes peeled for these potential turbulence triggers:
- Major Economic Announcements: Dates for inflation reports (like the CPI), employment numbers, and central bank interest rate decisions are famous for causing big market moves.
- Company Earnings Reports: The days surrounding a company's quarterly earnings release are notoriously volatile. Investors are on edge, ready to react to the numbers and what the company says about its future.
- Geopolitical Events: Big elections, new trade deals, or escalating global tensions can put the entire market on high alert, making it primed for a sharp reaction to any headline.
You may not know which way the market will jump, but you can definitely be prepared for the storm.
Which Is More Volatile Stocks or Bonds?
As a general rule, stocks are much, much more volatile than bonds. When you buy a stock, you're buying a piece of a company. That makes its value extremely sensitive to things like corporate profits, industry shake-ups, and the health of the overall economy. Investor mood swings alone can send stock prices on a wild ride.
Bonds, on the other hand, are basically just loans you make to a government or a corporation. They’re seen as a "safer" corner of the market because they pay a fixed interest rate and promise to return your initial investment when they mature. While bond prices do move—especially when interest rates change—their fluctuations are typically far tamer than what you see in the stock market. This is exactly why many investors use bonds to add a bit of stability to their portfolios.
If you’re looking for a deeper dive into other common trading topics, the vTrader FAQ page has plenty more answers.
Ready to turn your knowledge into action? vTrader offers the advanced tools and zero-fee trading you need to navigate any market condition. Join today and start building your portfolio with confidence. Visit https://www.vtrader.io to get started.

Steve Gregory is a lawyer in the United States who specializes in licensing for cryptocurrency companies and products. Steve began his career as an attorney in 2015 but made the switch to working in cryptocurrency full time shortly after joining the original team at Gemini Trust Company, an early cryptocurrency exchange based in New York City. Steve then joined CEX.io and was able to launch their regulated US-based cryptocurrency. Steve then went on to become the CEO at currency.com when he ran for four years and was able to lead currency.com to being fully acquired in 2025.