
When you hear "crypto technical analysis," don't think of a crystal ball. Instead, picture a seasoned navigator's map for the wild, often chaotic seas of the cryptocurrency market. It's a method for charting a course through volatility.
What Is Technical Analysis in the Crypto World?
Every single price movement on a crypto chart—every spike, every dip, every frustrating sideways grind—tells a story. Technical analysis is simply the art of learning to read that story. It’s a trading discipline built on one core belief: all known information, from breaking news to investor mood swings, is already reflected in the price you see on the screen.
Think about how a meteorologist forecasts the weather. They don't just guess. They analyze historical data—temperature, atmospheric pressure, wind patterns—to make an educated prediction about whether you’ll need an umbrella tomorrow. A crypto trader using technical analysis does something very similar, just with price and volume data, to anticipate where an asset might be headed next.
This chart-first approach is an essential skill for anyone serious about trading crypto.
How It Differs From Fundamental Analysis
So, how does this differ from the other big school of thought? While technical analysis is all about when to trade by reading charts, fundamental analysis tries to figure out what to trade by evaluating a project's real-world value.
A fundamental analyst digs into a project’s whitepaper, its development team, the tech behind it, and its community to decide if it's over or undervalued. A technical analyst, on the other hand, operates under the assumption that the market has already done that homework and priced it in.
The big idea here is that markets are driven by human psychology—namely, greed and fear—and human psychology creates patterns that repeat over and over again. The job of a technical analyst is to spot those patterns on the chart and act on them.
This approach is rooted in quantitative data, relying on mathematical and statistical models of price and volume. Since crypto is such a young and fast-moving asset class compared to traditional stocks, technical analysis has become a go-to tool for traders trying to make sense of the market since Bitcoin first appeared.
Now, let's break down the core philosophies that guide every technical analyst.
Core Principles of Crypto Technical Analysis
| Principle | Explanation |
|---|---|
| The Market Discounts Everything | All public information—news, regulations, sentiment—is already reflected in the current price. There's no need to analyze it separately. |
| Price Moves in Trends | Prices don't move randomly. They follow identifiable upward, downward, or sideways trends that can be analyzed. |
| History Tends to Repeat Itself | Market patterns are driven by human psychology (greed and fear), which is predictable and tends to create recurring chart formations. |
These three beliefs form the foundation of this entire discipline. They give traders a framework for managing risk and spotting opportunities based purely on market behavior. For a deeper dive into these concepts and more, the resources at the vTrader Academy are a great place to continue learning. You can also find additional perspectives on these guiding principles over at Gemini.com.
Reading the Story of Crypto Price Charts
Every crypto price chart tells a story—a constant tug-of-war between buyers and sellers. To really get what’s happening, you need to learn how to read three key elements: trendlines, support, and resistance. These aren't just lines on a screen; they're visual clues into what the market is thinking and feeling.
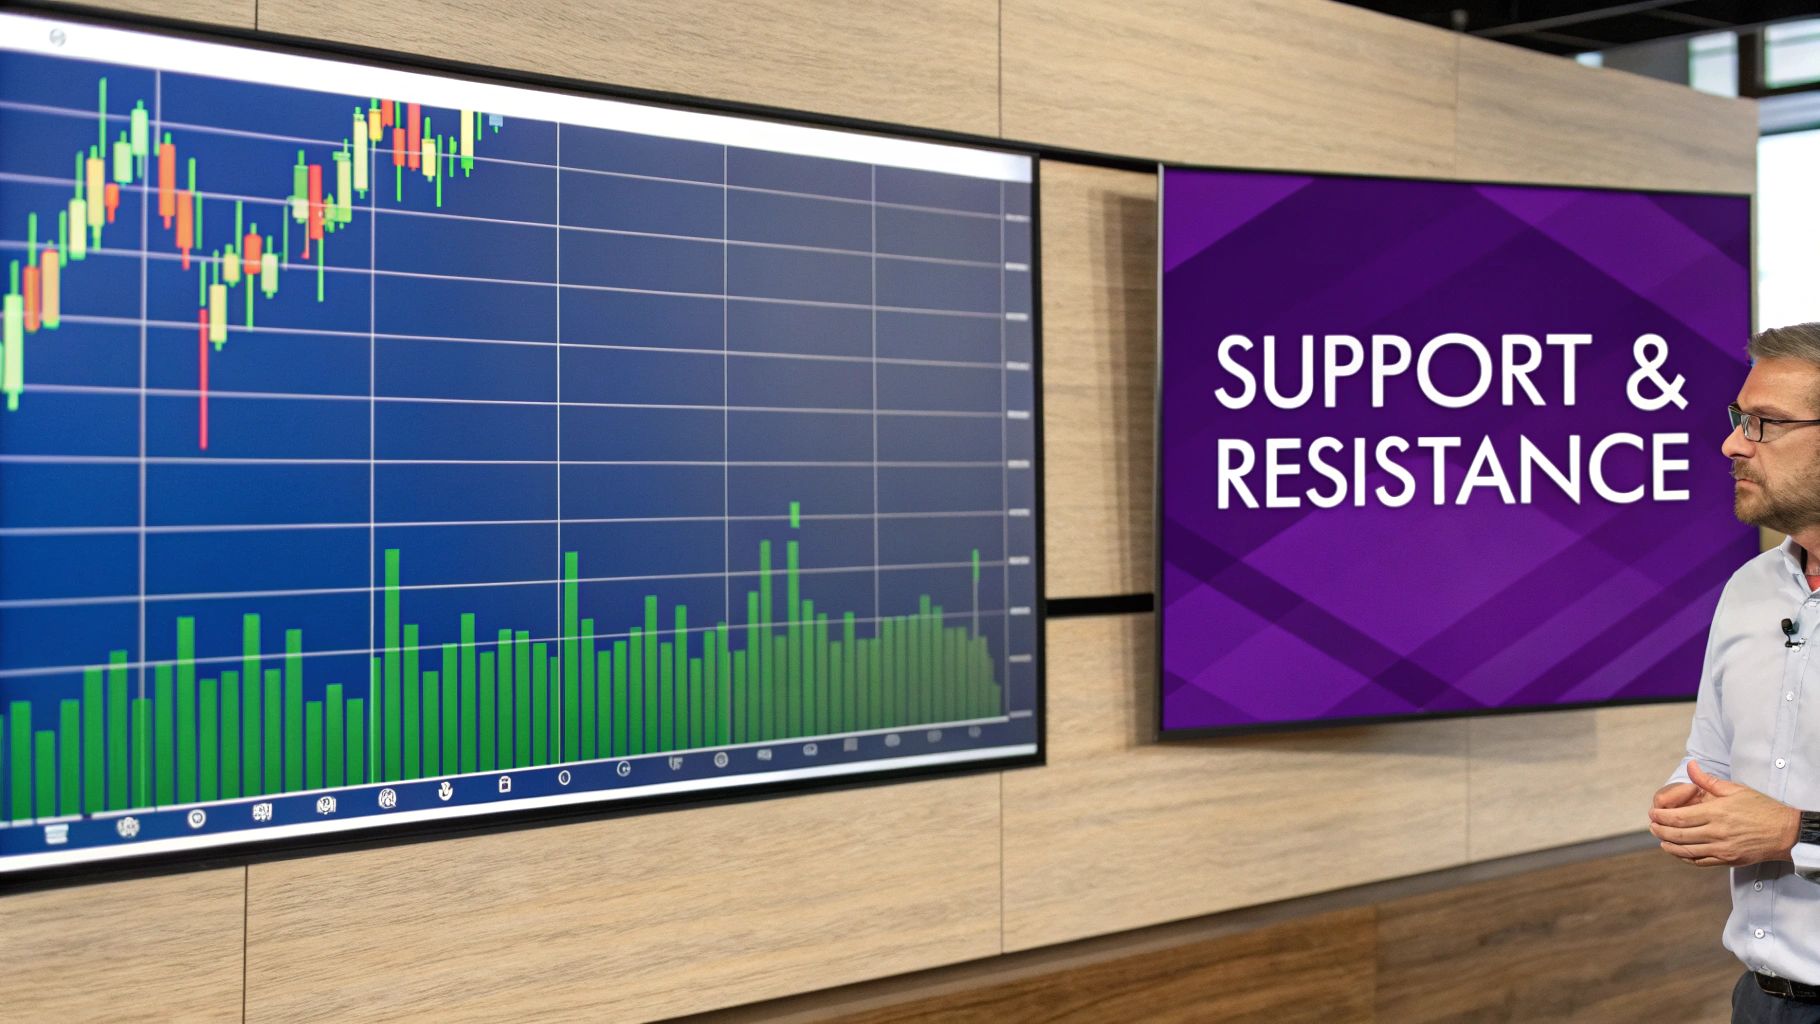
Think of a ball bouncing down a hallway. The floor stops it from falling through, and the ceiling keeps it from flying away. In technical analysis crypto, these are your support and resistance levels.
Identifying Support and Resistance
Support is the floor. It's a price level where a downtrend often hits the brakes because demand kicks in—more traders are suddenly willing to buy. It's a psychological price point where buyers feel an asset is a bargain, causing them to jump in and drive the price back up.
On the flip side, resistance is the ceiling. This is where an uptrend tends to lose steam as selling pressure mounts. At this point, sellers start to outnumber buyers, believing the asset is either overvalued or a good spot to lock in profits. When a price breaks out above resistance, it signals that the bulls are in strong control.
Support and resistance levels are so powerful because they often become self-fulfilling prophecies. The more times a price tests a certain level and holds, the more traders take notice. This reinforces its strength and makes future reactions at that level even more probable.
Let's say Bitcoin has repeatedly bounced off the $60,000 mark. Traders will quickly start to see this as a major support zone. They'll place buy orders around this level, adding to the buying pressure and helping to keep the price from falling further.
This infographic shows you exactly how key indicators, including support and resistance, look on a modern trading platform.
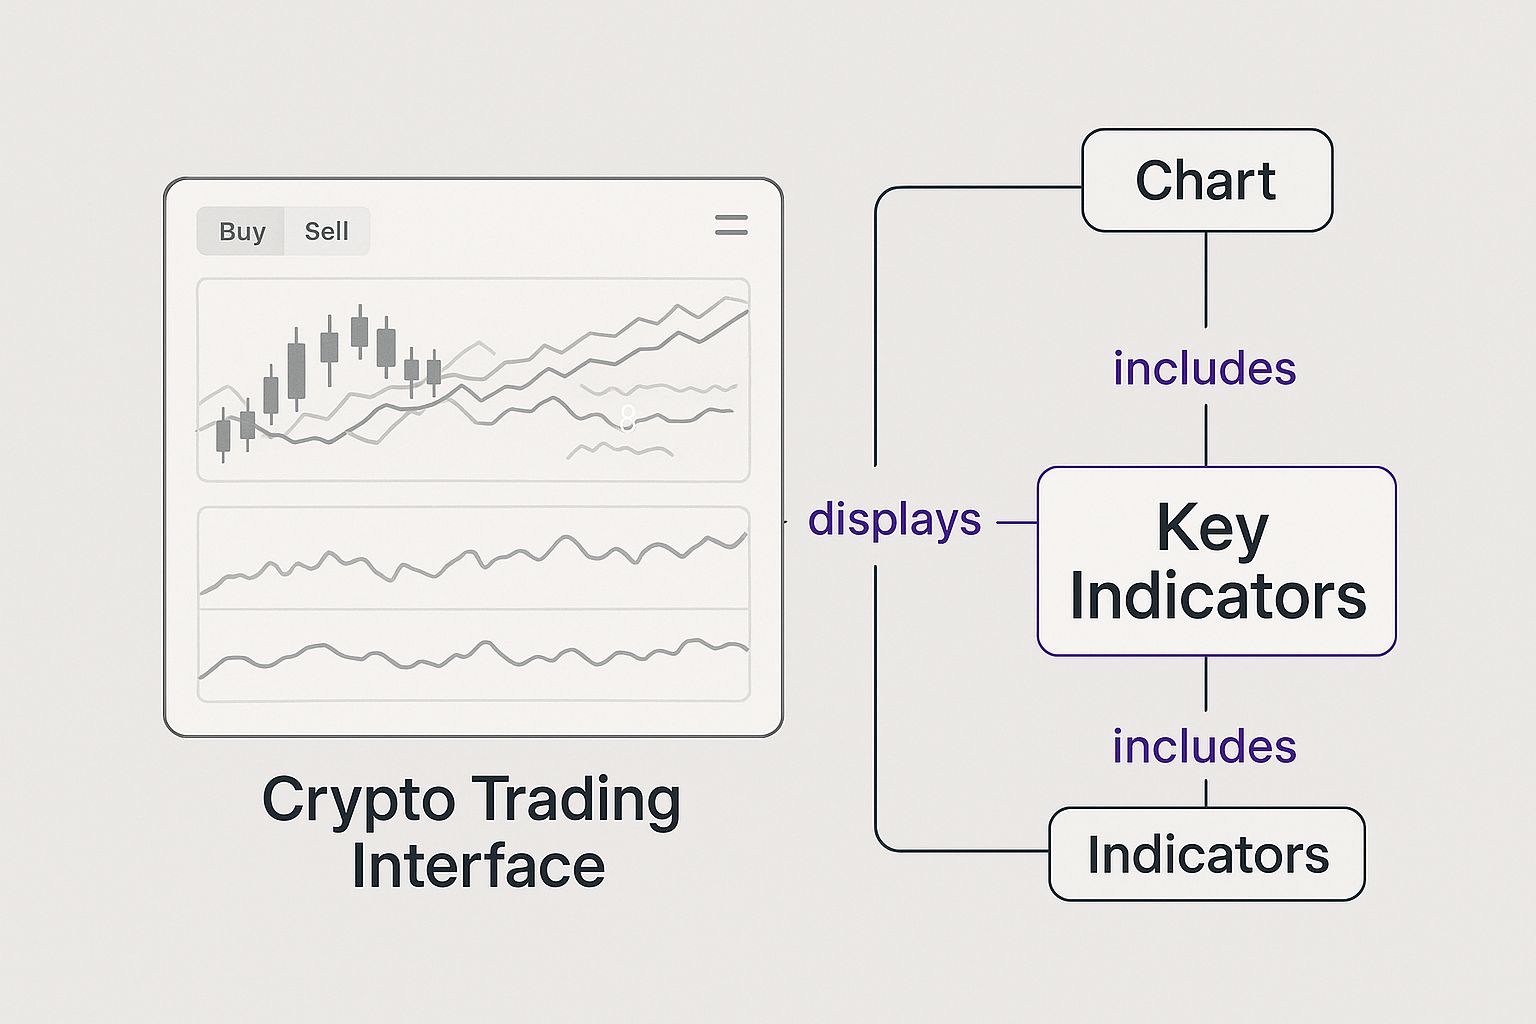
As you can see, these data overlays help traders spot these make-or-break price zones in real-time.
Understanding Market Trends
While support and resistance mark specific price levels, trendlines show the market's overall direction. They're like the angle of the hallway the ball is bouncing in. To spot them, you just have to connect the dots.
- Uptrend (Bullish): You can spot an uptrend when you see a series of higher highs and higher lows. Draw a line connecting at least two of the major lows, and you have an uptrend line that acts as dynamic support.
- Downtrend (Bearish): A downtrend is made up of lower highs and lower lows. To draw a downtrend line, connect two or more major highs. This line becomes your dynamic resistance.
- Sideways Trend (Consolidation): When a price is just bouncing between clear support and resistance levels, it's stuck in a sideways trend. This usually signals that the market is undecided and waiting for its next big move.
Getting a grip on these fundamental concepts is your first step toward reading price action like a pro. Once you can identify these patterns, you can shift from just reacting to the market to actually anticipating what it might do next. To get the latest market analysis, you can stay informed with the vTrader crypto news hub.
How to Interpret Candlestick Patterns
If support and resistance are the floors and ceilings of a crypto chart, candlestick patterns are the conversations happening inside the room. Each candle tells a story—a visual play-by-play of the fight between buyers (bulls) and sellers (bears) over a specific timeframe. Learning to decipher this language is a non-negotiable part of serious technical analysis crypto trading.
Forget trying to memorize dozens of obscure patterns. It’s far more powerful to get inside the psychology of a few key ones. These patterns can give you an incredible edge by revealing shifts in market sentiment, often hinting at whether a trend will continue or reverse.
Common and Powerful Candlestick Patterns
Let's break down three foundational patterns you’ll see constantly. They pack a punch because they tell a clear story about what the market is thinking.
- The Doji: Think of a tug-of-war that ends in a dead heat. That’s a Doji. It shows up when the open and close prices are virtually identical, leaving a candle with almost no body. A Doji screams indecision. Neither the bulls nor the bears could land a decisive blow, which often signals a potential turning point is near.
- The Hammer: This one looks just like it sounds—a short body up top with a long wick dangling below. When a Hammer appears after a price drop, it’s a story of a stunning comeback. Sellers tried to drag the price down, but buyers charged back in, forcing the price right back up near the open. It’s a classic hint of a potential bullish reversal.
- The Engulfing Pattern: This is no contest; it’s a total knockout. A Bullish Engulfing pattern happens when a big green candle completely swallows the previous, smaller red candle. It’s a clear signal that buyers have seized control. The opposite, a Bearish Engulfing pattern, is when a huge red candle dwarfs the prior green one, showing a massive shift toward selling pressure.
Stop memorizing and start reading the story. Every time you see a candle, ask yourself: Who won the battle during this period? Was it a blowout, or a nail-biter? The answer tells you what might happen next.
Here’s a look at these patterns in action on a real chart from the vTrader platform.
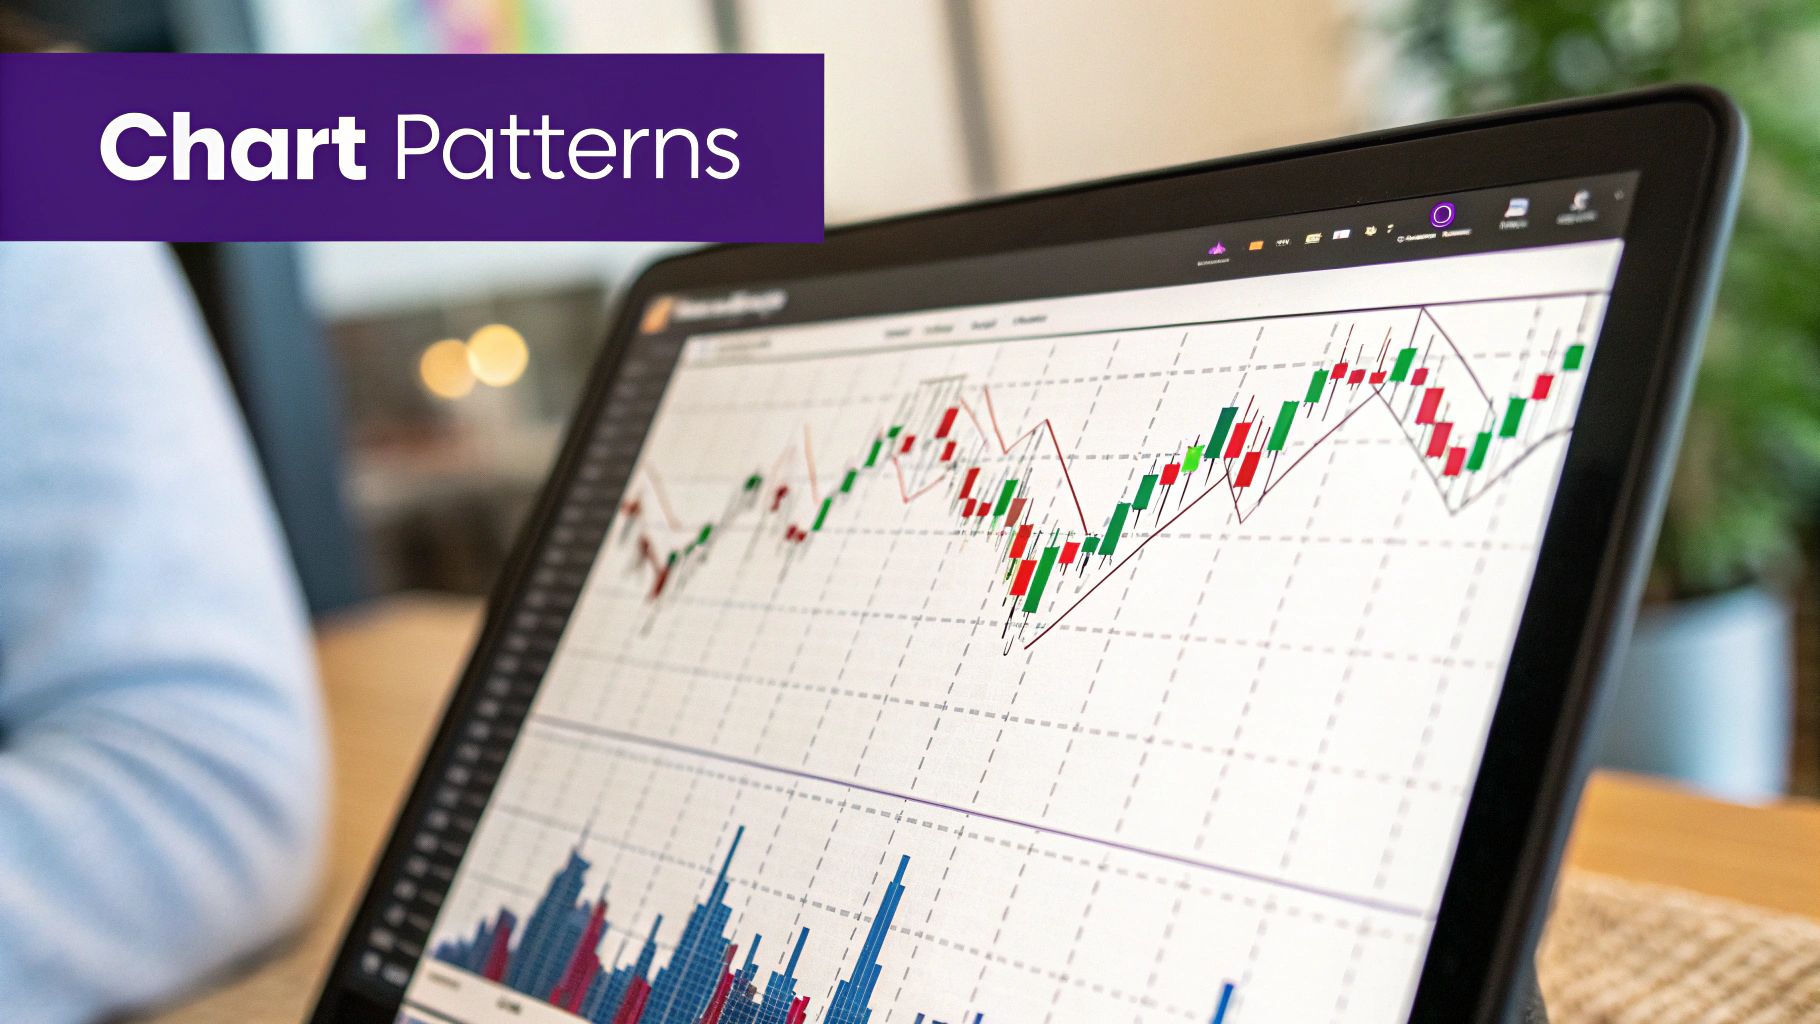
You can see how engulfing patterns and hammers often pop up right near key support or resistance zones, flagging major shifts in momentum just before they happen.
This is where the real magic happens. When you combine these visual cues with the trendlines and support/resistance levels you’ve already mapped out, your trade setups become much stronger. A hammer pattern appearing randomly is interesting. A hammer pattern forming right on top of a major support level? That's a compelling signal to pay close attention to.
This layering of evidence is what turns technical analysis from a guessing game into a strategic method for navigating the crypto markets.
Using Indicators to Measure Market Momentum
While price charts and candlestick patterns tell you what the market is doing, momentum indicators get to the heart of how much force is behind a move. Think of it like a car. The price chart shows you which direction it’s headed, but momentum indicators are your speedometer and tachometer—they tell you how fast the market is accelerating or if it's about to slam on the brakes.
Getting a feel for these tools is a crucial part of technical analysis crypto because they offer a peek under the hood at the market’s true strength. Two of the most reliable and widely used indicators you'll find in any trader's toolkit are the Relative Strength Index (RSI) and the Moving Average Convergence Divergence (MACD).
The Relative Strength Index (RSI)
The easiest way to think about the RSI is as a battery gauge for market momentum. It's an oscillator that moves between 0 and 100, measuring how quickly the price is changing. This helps you spot when a trend might be running out of gas or just warming up for a big move.
-
Overbought (Above 70): When the RSI pushes above 70, it signals that an asset might be "overbought." Imagine a sprinter who's been running flat out for too long—they’re probably getting tired. It’s a warning sign that the buying frenzy could be losing steam.
-
Oversold (Below 30): On the flip side, an RSI reading below 30 suggests the asset is "oversold." The sprinter has caught their breath and is ready for another race. This tells you the sellers might be exhausted, and buyers could be looking to jump back in.
An RSI signal is most powerful when it lines up with other clues. An overbought RSI at a major resistance level is a much stronger warning than one that pops up in the middle of a monster uptrend.
The Moving Average Convergence Divergence (MACD)
If you need to understand the strength, direction, and staying power of a trend, the MACD is your go-to indicator. It works by comparing two different moving averages of an asset's price, showing you how their relationship is changing over time.
You'll see three parts on your chart: the MACD line, the signal line, and the histogram. The magic happens at the crossover. When the MACD line crosses above the signal line, it’s a bullish signal that momentum is shifting up. When it crosses below, it’s a bearish signal, hinting that momentum is turning sour.
Comparing Popular Momentum Indicators
While both RSI and MACD measure momentum, they tell you slightly different stories. Here’s a quick breakdown to help you keep them straight:
| Indicator | What It Measures | Key Signals |
|---|---|---|
| RSI | The speed and magnitude of recent price changes | Overbought (>70) and Oversold (<30) conditions |
| MACD | The relationship between two exponential moving averages | Bullish and Bearish crossovers between the MACD and signal lines |
Ultimately, RSI is great for spotting potential reversal points when price action becomes extreme, while MACD is more focused on confirming the direction and strength of the current trend.
Using Indicators for Confirmation
Here’s the golden rule: never, ever rely on just one indicator. An oversold RSI is a hint, not a command to buy. A bullish MACD crossover is interesting, but it needs some backup.
The sharpest traders use these tools to confirm what they’re already seeing. Let's say you spot a bullish hammer candlestick forming right on a key support level. You glance at your indicators and notice the RSI is just starting to climb out of oversold territory, and the MACD looks like it's about to flash a bullish crossover.
Suddenly, you’re not just guessing. You're layering evidence, turning a simple observation into a high-confidence trade idea. This is how you transform technical analysis from a shot in the dark into a methodical game plan for navigating the crypto markets.
Leveraging Historical Data for Deeper Insights
While daily charts capture the current tug-of-war between buyers and sellers, professional traders know the real money is made by zooming out to see the entire battlefield. Great technical analysis crypto trading isn’t just about what’s happening today; it’s about digging into the market's vast history to find a strategic edge. This is what truly separates the seasoned pros from the everyday traders.
This entire approach is built on the mountains of data collected since crypto’s earliest days. The sheer volume of information is staggering, creating a rich playground for anyone willing to do the analytical heavy lifting.
By running a strategy against years of past data, a trader can see exactly how it would have performed. It's like a championship team studying old game tapes—you build confidence, find the flaws, and prepare for the real thing before a single dollar is on the line.
The Power of Long-Term Indicators
One of the most respected long-term indicators you'll find is the 200-day Exponential Moving Average (EMA). To many institutional traders, this isn't just another squiggly line; it's the definitive border between a bull and a bear market.
When a crypto asset is trading above its 200-day EMA, the long-term outlook is generally bullish. But once it drops below that line, caution flags start waving, and it’s time to pay close attention. Using this indicator helps you filter out the daily noise and focus on the primary trend, keeping you from getting caught on the wrong side of a major market shift.
Finding Patterns in Time
Beyond specific indicators, seasoned analysts also hunt for historical and seasonal trends. Bitcoin, for example, has historically shown very distinct performance patterns during certain months or quarters of the year. While past performance is never a guarantee, these tendencies add another valuable layer of context to your trading decisions.
Of course, digging into all this data effectively requires the right tools. To get the most out of your backtesting and historical analysis, exploring powerful data extraction techniques can seriously level up your ability to process information. Understanding these methods is key to turning raw data into an actionable strategy.
This whole process hinges on access to deep, granular market data. Since 2010, massive volumes of price, volume, and order book data have been collected, now covering over 10,000 coins and 300,000 trading pairs across more than 300 exchanges.
Naturally, all this analysis is only useful if you can execute your trades efficiently. To make sure trading costs don't eat away at your profits, you can check out our fee schedule and see how vTrader’s zero-commission structure helps you keep more of your returns.
Building Your First Crypto Trading Strategy
This is where the rubber meets the road. All the theory in the world doesn't mean much until you can assemble the pieces into a repeatable game plan. A truly solid strategy isn’t about finding one magic signal; it’s about layering multiple, unrelated clues to build an airtight case for a trade.
Let’s walk through how you might set up a hypothetical trade on the vTrader platform. You're not just clicking around hoping for the best. You’re operating with a clear, step-by-step process.
A High-Confidence Trade Scenario
First things first, you zoom out. You spot a clear uptrend on the chart—a classic series of higher highs and higher lows. This is your foundation. The market's overall mood is bullish, so you decide to swim with the current, not against it. But you don't chase the price. You wait patiently for the market to come to you.
Your chart shows a strong support level, an area where the price has bounced hard before. You set an alert and wait. As the price drifts down to this zone, a bullish hammer candlestick forms right on that support line. That’s signal number two. It's a visual cue that sellers tried to push the price down, but buyers stormed in and defended the line.
Now, you need confirmation.
A great trade setup is like a good detective story. You gather clues one by one—a trend, a key level, a candlestick pattern—until the evidence becomes overwhelming. Your indicators are the final witnesses that confirm your theory.
You glance at your indicators. The Relative Strength Index (RSI) is just starting to poke its head out of oversold territory (below 30), and the MACD indicator is showing a bullish crossover. Suddenly, you have four distinct signals all pointing in the same direction. This layering method is the very core of smart technical analysis crypto trading.
Here’s a glimpse of how these tools can work together on the vTrader platform.
The interface is built to let you overlay your trendlines, support levels, and various indicators on one chart, making it much easier to catch these combined signals as they happen.
The Non-Negotiable Step: Risk Management
No strategy is complete without it. This part is crucial. Before you even think about entering the trade, you set a stop-loss order just beneath that support level. Think of it as your safety net. If the trade turns against you, it automatically closes your position, protecting your capital from a major hit. As you build your crypto trading strategy, remember that effective investment risk management is what separates successful traders from gamblers in the long run.
This disciplined, multi-signal approach is what elevates your trading from guesswork to a professional, process-driven operation. And while active trading is a powerful way to engage with the market, it’s not the only one. For those looking for a more hands-off approach to growing their assets, you can learn more about earning rewards with crypto staking right here on our platform.
Frequently Asked Questions About Crypto TA
Even after you've got the basics down, jumping into technical analysis crypto trading for the first time can still feel like a huge leap. It's totally normal. Most aspiring traders run into the same questions and hurdles, so let's tackle a few of the big ones to get you on solid ground.
Does Technical Analysis Work in Crypto?
You bet it does. In fact, many seasoned traders will tell you it's especially powerful in the crypto markets. Why? Because crypto is so driven by pure emotion and momentum—the exact things TA is designed to track. In such a volatile space, the patterns of human psychology show up loud and clear on the charts, giving you a much-needed framework for managing your risk.
The smartest traders I know don't pick a side between technical and fundamental analysis—they use both to their advantage. Think of it this way: fundamental analysis tells you which projects are worth your time, while technical analysis tells you the best time to get in and out. They’re two sides of the same strategic coin.
How Do I Start Without Feeling Overwhelmed?
The trick is to start small and build your skills one layer at a time. Seriously, don't try to drink from the firehose and master every indicator and pattern overnight. That’s a recipe for burnout.
- Step 1: Just focus on the absolute essentials. Learn to spot support, resistance, and basic trendlines. That's it.
- Step 2: Once you’re comfortable, add one or two high-impact candlestick patterns to your arsenal, like the classic Hammer or the powerful Engulfing patterns.
- Step 3: Finally, bring in a single momentum indicator—the RSI is a great place to start—to help confirm what the price action is telling you.
Building your toolkit this way keeps you from getting buried in data. If you have more questions, our complete FAQ page has plenty of other answers to help you get going.
Are There Historical Trends in Crypto?
Absolutely. Chart-watchers are always digging through historical data, hunting for seasonal or cyclical patterns that might give them an edge. Bitcoin, for example, has shown some pretty clear seasonal habits since 2011.
July, for instance, has historically been a good month for Bitcoin, clocking in an average return of around 7.89%. On the other hand, the third quarter as a whole often struggles, with an average return of just 6.07%. To see how this data can add valuable context to your trading, you can discover more insights on these Bitcoin seasonal trends on CoinDesk.
Ready to put what you've learned into action? vTrader gives you the advanced tools you need to build your strategy, all with zero-commission trading so you can keep more of what you earn. Sign up today and start building your strategy.

Steve Gregory is a lawyer in the United States who specializes in licensing for cryptocurrency companies and products. Steve began his career as an attorney in 2015 but made the switch to working in cryptocurrency full time shortly after joining the original team at Gemini Trust Company, an early cryptocurrency exchange based in New York City. Steve then joined CEX.io and was able to launch their regulated US-based cryptocurrency. Steve then went on to become the CEO at currency.com when he ran for four years and was able to lead currency.com to being fully acquired in 2025.